annual report 2012 - Pumpkin Patch investor relations
annual report 2012 - Pumpkin Patch investor relations
annual report 2012 - Pumpkin Patch investor relations
- No tags were found...

Create successful ePaper yourself
Turn your PDF publications into a flip-book with our unique Google optimized e-Paper software.
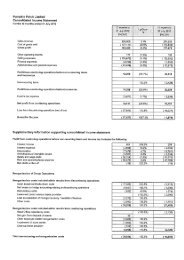
pumpkin patch limited & subsidiaries NOTES TO THE financial statements 31 july <strong>2012</strong>pumpkin patch limited & subsidiaries NOTES TO THE financial statements 31 july <strong>2012</strong>25 Financial risk management continued 25 Financial risk management continuedInterest rate riskForeign exchange risk‐1% +1% ‐10% +10%Carryingamount Profit Equity Profit Equity Profit Equity Profit EquityConsolidated $’000 $’000 $’000 $’000 $’000 $’000 $’000 $’000 $’00031 July <strong>2012</strong>Financial assetsCash and cash equivalents 5,343 6 - (6) - 431 - (353) -Trade receivables 7,618 - - - - 769 - (629) -Employee share scheme28 - - - - - - - -receivableOther receivables 4,374 - - - - 2 - (2) -Derivative financial instruments 1,787 - - - - (1,631) (1,178) 3,007 961Financial liabilitiesTrade payables (14,944) - - - - 1,413 - - (1,156)Employee benefits (5,696) - - - - 210 - - (172)Interest bearing liabilities (60,000) 600 - (600) - - - - -Derivative financial instruments (23,183) - - - - 137 (3,785) (224) 3,147Total increase/ (decrease) 606 (606) - 1,331 (4,963) 1,799 2,78031 July 2011Financial assetsCash and cash equivalents 10,030 39 - (39) - 896 - (733) -Trade receivables 7,554 - - - - 731 - (766) -Employee share scheme100 - - - - - - - -receivableOther receivables 2,933 - - - - 36 - (29) -Derivative financial instruments 5,971 - - - - - (29,239) - 23,990Financial liabilitiesTrade payables (11,898) - - - - (1,198) - 980 -Employee benefits (6,424) - - - - (395) - 323 -Interest bearing liabilities (71,000) 710 - (710) - - - - -Derivative financial instruments (55,976) - - - - 1,196 21,858 (972) (17,757)Total increase/ (decrease) 749 - (749) - 1,264 (7,381) (1,197) 6,233Interest rate riskForeign exchange risk‐1% +1% ‐10% +10%Carryingamount Profit Equity Profit Equity Profit Equity Profit EquityParent $’000 $’000 $’000 $’000 $’000 $’000 $’000 $’000 $’00031 July <strong>2012</strong>Financial assetsAmounts owed from subsidiaries 238,995 - - - - 190 - (156) -31 July 2011Financial liabilitiesAmounts owed from subsidiaries 247,603 - - - - 3,302 - (2,702) -The Parent is not sensitive to any interest rate risk, nor is it sensitive to foreign exchange risk except on amountsowed from its subsidiaries.(b) Credit riskCredit risk is managed on a Group basis and refers to the risk of a counterparty failing todischarge an obligation. In the normal course of business, the Group incurs credit risk fromtrade receivables and transactions with financial institutions. The Group places its cash,short term deposits and derivative financial instruments with only high credit quality financialinstitutions. Sales to retail customers are required to be settled in cash or using major creditcards, mitigating credit risk. Trade receivables arising from wholesale arrangements areindividually reviewed regularly for impairment as part of normal operating procedures andprovided for where appropriate. Overdue amounts that have not been provided for relateto customers that have no recent history of default. Approximately 8.4% (2011: 12.7%) of<strong>report</strong>ed continuing sales give rise to trade receivables. The top five wholesale customersaccount for 81.1% (2011: 81.2%) of the trade receivables balance. Refer also to note 8 forfurther details.(c) Liquidity riskPrudent liquidity risk management implies maintaining sufficient cash and the availabilityof funding through an adequate amount of committed credit facilities. Due to the dynamicnature of the underlying businesses, Management aims at maintaining flexibility in fundingby keeping committed credit lines available.Management monitors rolling forecasts of the Group’s liquidity reserve on the basis ofexpected cash flow. For details of available facilities, refer note 17 for further details.The table below analyses the Group’s non derivative financial liabilities into relevantmaturity groupings based on the remaining period at the <strong>report</strong>ing date to the contractualmaturity date. The amounts disclosed in the table are the contractual undiscountedcash flows.93