At Home with Water - Energy Saving Trust
At Home with Water - Energy Saving Trust
At Home with Water - Energy Saving Trust

Create successful ePaper yourself
Turn your PDF publications into a flip-book with our unique Google optimized e-Paper software.
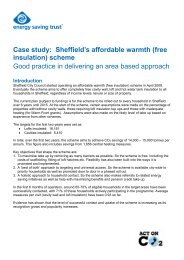
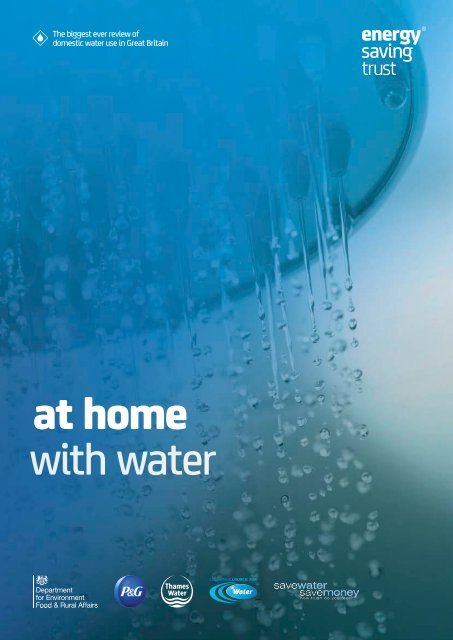
<strong>Energy</strong> <strong>Saving</strong> <strong>Trust</strong><strong>At</strong> <strong>Home</strong> <strong>with</strong> <strong>Water</strong>The simplest actions can mean the biggestsavings. If every household in the UK tookjust one minute off one shower every day,it would save £215 million in energy bills ayear nationwide. If everyone in a four-personmetered household <strong>with</strong> a power showerdid this, it could save £60 on energy bills,and a further £60 on water bills, every year.And if those who still wash their clothes inhot water turned the dial down to 30ºC,they would save £13 per house per year.That could add up to a massive £250 milliona year across all UK homes. And the listgoes on.Utility companies will be able to use thesefindings to improve their engagement <strong>with</strong>customers, helping to reduce householdbills and reduce the risk of water stress. Thekey to success is to ramp up consumerengagement, educate families more aboutwater and energy, and offer householdspecificsolutions for reducing bills.<strong>Energy</strong> and water bills are on the rise, andthere is increasing pressure on our naturalresources. A new approach is needed tohelp people get control of water and energyuse in the home. So rather than preach fromthe pulpit, we will continue this work byundertaking a ‘rethink’ about domesticwater use. This report sets the scene onBritain’s water use in the home. Watchthis space, as we work <strong>with</strong> leadingorganisations to help real people, in realhomes, to conceive the best possible reallife solutions.Philip SellwoodChief Executive, <strong>Energy</strong> <strong>Saving</strong> <strong>Trust</strong>5
<strong>Energy</strong> <strong>Saving</strong> <strong>Trust</strong><strong>At</strong> <strong>Home</strong> <strong>with</strong> <strong>Water</strong>1. <strong>At</strong> <strong>Home</strong> <strong>with</strong> <strong>Water</strong> –the journeyThe <strong>Energy</strong> <strong>Saving</strong> <strong>Trust</strong> investigates, evaluates and adviseson domestic energy and water consumption. Last year, wepublished Powering the Nation, which reviewed the waypeople use electrical devices, and how much it costs the UK.The research allows government to form new policies to helppeople change how they think about and use electricity. <strong>At</strong><strong>Home</strong> <strong>with</strong> <strong>Water</strong> continues the essential need to rethink ourrelationship <strong>with</strong> energy and water.<strong>At</strong> <strong>Home</strong> <strong>with</strong> <strong>Water</strong> will analyse real-lifewater use in homes, and develop consumerledwater efficiency solutions, through atwo-phase approach.• Phase 1: This report. Direct analysis ofmore than 86,000 households’ selfreportedwater use information.• Phase 2: Starts mid-2013. Spendingtime <strong>with</strong> families in their homes,‘rethinking’ water savings’ potential,from a householder’s perspective.The findings presented in this report –Phase 1 – are generated from self-reportedinformation, captured from Britishhouseholds through the online <strong>Water</strong><strong>Energy</strong> Calculator. Put simply, people toldus what water devices they have and howthey use them. More than 86,000 individualresponses contribute to this report and theyare evaluated against current knowledgeand industry estimates. Appendix Aprovides a fuller description of the dataprocessing and analytical stages.The findings of <strong>At</strong> <strong>Home</strong> <strong>with</strong> <strong>Water</strong> can beused to complement measured water usageinformation <strong>with</strong>in the water sector.We now seek to test our findings in Phase 2,by spending time in the home and engaging<strong>with</strong> households. We will look at real-timewater consumption, enabling eachhousehold to understand how it uses water.And we will ‘rethink’ the ways in whichhouseholds and the wider water sector canbetter engage <strong>with</strong> water efficiency, to findmore practical and effective ways to savewater and energy.6
<strong>Energy</strong> <strong>Saving</strong> <strong>Trust</strong><strong>At</strong> <strong>Home</strong> <strong>with</strong> <strong>Water</strong>The <strong>Water</strong> <strong>Energy</strong> CalculatorBe a part of <strong>At</strong> <strong>Home</strong><strong>with</strong> <strong>Water</strong>Contact foundation@est.org.ukLaunched in 2010, the <strong>Water</strong> <strong>Energy</strong>Calculator is an online self-completion toolthat takes respondents through a series ofquestions about their household waterconsumption habits: how many times theybathe or shower, wash the car, boil the kettleand so on. Over two years, more than100,000 households completed the Calculator,providing one of the largest data sets onGreat Britain’s domestic water consumption.The Calculator lets people assess theirwater usage in and around their homes.When they complete the journey theyreceive an assessment of their annualwater usage and the associated energyconsumption. It provides estimated costsof using specific appliances and advicefor reducing water bills and energy bills.Many water companies across Great Britainalready use the <strong>Water</strong> <strong>Energy</strong> Calculator toprovide much needed support for their owncustomers to save money and do a bit morefor the environment.A full set of <strong>Water</strong> <strong>Energy</strong> Calculatorquestions is included in Appendix B.7
<strong>Energy</strong> <strong>Saving</strong> <strong>Trust</strong><strong>At</strong> <strong>Home</strong> <strong>with</strong> <strong>Water</strong>2. Headline findingsAnalysis of responses to the <strong>Energy</strong> <strong>Saving</strong> <strong>Trust</strong>’s<strong>Water</strong> <strong>Energy</strong> Calculator reveals that:• Each person uses about 142 litres of water each day.• The average household uses 349 litres of water each day 1 .• The average annual metered water bill is £427 2 .• Hot water use contributes £228 to the average annual combinedenergy bill and emits 875kg of CO 2per household per year.• 43% of respondents have a water meter 3 in their homes. Theseproperties used around 3% less water than unmetered properties.• Showers are the biggest water user in the house (25%),followed by lavatories (22%).• On average, each individual takes 4.4 showers and 1.3 bathseach week.• People generally spend seven-and-a-half minutes in the shower.87% of people do not exceed ten minutes on their daily shower.• 41% of homes have a dual-flush toilet.• We use the washing machine on average 4.7 times each week,but only about a quarter of us select a 30°C degree wash.• Most people fill the washing machine (82%) and dishwasher(77%) to capacity before turning it on.• About 86% of people use a bowl when washing dishes by hand.• 40% of households boil the kettle four times or more a day –and most (75%) say they boil more water than they need.8
<strong>Energy</strong> <strong>Saving</strong> <strong>Trust</strong><strong>At</strong> <strong>Home</strong> <strong>with</strong> <strong>Water</strong>Who uses the <strong>Water</strong><strong>Energy</strong> Calculator?There are 2.3 residents in the average UK home 4 , which islower than the average occupancy in our sample (2.5 persons).Our respondents included every type of household; however,greater numbers of dual and higher occupancy familiesundertook the <strong>Water</strong> <strong>Energy</strong> Calculator journey.We can also compare the split of primary fuel used to heatrespondents’ homes <strong>with</strong> the expected national picture.The typical UK home uses gas central heating for space andwater 5 , and this is also by far the most common response inour sample.Comparison of household occupancyand primary heating fuel in WEC sampleand UKOccupancy WEC UK1 person 18% 31%2 person 44% 34%3 person 16% 16%4 person 15% 13%5 or more persons 7% 7%Heating WEC UKGas 77% 81%Electricity 16% 12%Oil 5% 5%LPG 1% 1%Solid 0% 1%Biomass 0% 0%1 Using an average household size of 2.52, which includes all metered and unmetered households. <strong>Water</strong><strong>Energy</strong> Calculator.2 Using an average household size of 2.53, which only includes metered households. <strong>Water</strong> <strong>Energy</strong>Calculator.3 WEC results are in line <strong>with</strong> Ofwat meter coverage of 42%, as for March 2012.https://www.ofwat.gov.uk/consumerissues/chargesbills/prs_lft_charges2011-12.pdf4 Number of people in UK households from 2011 Census: Population and Household Estimates for theUnited Kingdom, March 2011, ONS, available at www.ons.gov.uk5 UK Household main heating fuel type estimated from English Housing Survey 2009, Scottish HouseCondition Survey 2009, Living in Wales 2008, and Northern Ireland House Condition Survey 2009.9
<strong>Energy</strong> <strong>Saving</strong> <strong>Trust</strong><strong>At</strong> <strong>Home</strong> <strong>with</strong> <strong>Water</strong>3. Why the focus on water?<strong>Water</strong> is a precious resource. Sometimes itmay not feel like it – especially after one ofthe wettest winters on record.The UK public does not often relate tonews stories on water shortages. It seemsto rain much of the time. When we turn onthe tap there is plenty of water. What isthere to worry about? The dangers –shortages of supply, expensive utility billsand harmful carbon emissions – lurk out ofsight and out of mind.In the early months of 2012, watercompanies placed restrictions on customersin many regions. There was lower thanaverage precipitation that winter – a timewhen water reserves (both underground tofeed rivers and in the big reservoirs acrossthe country) are usually replenished. By theend of 2012, the UK had experienced itssecond wettest year on record. But toomuch precipitation in too short a periodbrings its own problems. People may beforgiven for being confused about why theyshould be concerned about water use on aday-to-day basis.It’s not just a question of supply. When wetake a shower, wash our clothes or make acup of tea, we underestimate or ignore theenvironmental and financial impact. Everytime we turn on a tap or run an appliancethat uses water, we spend money, createcarbon emissions and draw on our waterreserves. Since most of our water bills arequarterly, and more and more of us pay bydirect debit, the cost can often gounnoticed. <strong>Water</strong> bills also tend to besignificantly lower than fuel bills. Yet waterhas a significant, hidden impact on thosecostly fuel bills. Heating water is the secondlargest source of energy use in the home(next to heating our homes) 6 . When asked,only 8% of people in the UK knew this 7 .10
<strong>Energy</strong> <strong>Saving</strong> <strong>Trust</strong><strong>At</strong> <strong>Home</strong> <strong>with</strong> <strong>Water</strong><strong>Energy</strong> bills and carbon emissionscan be cut simply by being moreaware of how we use water:use less, reduce energy bills,reduce emissions.Of all the CO 2emissions in the UK, 6% arefrom water use. A massive 89% of thiscomes from heating water in our homes 8 .The remaining 11% comes from pumpingand treating water as part of the supply andsewage network. If we use less water, it willreduce the volume of water pumped,heated at home, and treated. <strong>Energy</strong> billsand carbon emissions can be cut simply bybeing more aware of how we use water: useless, reduce energy bills, reduce emissions.Utility bills in the UK are rising. In the nextfew years we are likely to place a greaterstrain on our energy supply and on ourwater reserves. We all use water and energyresources in the same rooms and at thesame time, but there is a disconnectbetween the agendas at the policy, regulationand delivery levels. This is a lost opportunity.Reducing water consumption is not anuncomfortable burden. We don’t have to benoticeably more frugal – we only have to beaware of the impact of our decisions andmake some very simple changes. The <strong>Water</strong><strong>Energy</strong> Calculator shows people how tomake a few changes and also the impactthese would have on their combined utilitybills. By using water in a different way(taking a shorter shower <strong>with</strong> an ecoshowerhead,and making sure the washingmachine is full before using it, for example)and making informed choices aboutappliances (replacing a broken washingmachine <strong>with</strong> an A-rated machine), waterand energy costs can be easily reduced.Embedding water efficiency in our heartsand minds will become more and moreimportant. Our first task is to find ourstarting point.6 Department of <strong>Energy</strong> and Climate Change (2012); <strong>Energy</strong> Consumption in the UK 2012; Chapter 3:Domestic; available at www.gov.uk7 http://www.energysavingtrust.org.uk/Publications2/Corporate/Projects/EU-Life-<strong>Energy</strong>-and-<strong>Water</strong>-Project-Report8 Environment Agency (2008): Greenhouse gas emissions of water supply and demand managementoptions, Science Report – SC07001011
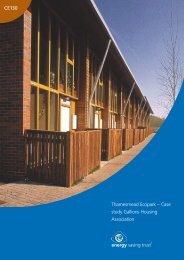
<strong>Energy</strong> <strong>Saving</strong> <strong>Trust</strong><strong>At</strong> <strong>Home</strong> <strong>with</strong> <strong>Water</strong>4. Consuming waterThe water industry collects, treats and suppliesmore than 16 billion litres of water every day fordomestic and commercial customers 9 in the UK.The Environment Agency estimates per capitaconsumption to be around 150 litres per day 10 .From the <strong>Water</strong> <strong>Energy</strong> Calculator, we estimate thatthe average home consumes 349 litres each day andindividuals use an average of 142 litres a day.When cooking, washing, watering the garden and soon are shared across the household, average waterconsumption per person falls (Figure 2).We can also look at responses in finer detail to betterunderstand where water is used in the home.Showers use the most water in the average home,followed by lavatories and cold water from taps –for brushing teeth, cooking, cleaning and drinking(Figure 1).Just over two-fifths (43% 11 ) of our respondents’properties had a water meter installed (Figure 3). Weestimate that these homes use 3% less water thanunmetered households – equating to approximately72 litres per week, or about 3,700 litres a year.This difference between metered and unmeteredhomes, which is calculated from self-reported inputon water usage, is lower than a water saving of 10%often used in the water sector as a notional averagesaving for metered households 12 . <strong>Water</strong> use inhomes, <strong>with</strong> or <strong>with</strong>out meters, varies to a greatextent. It depends on occupancy and differences indaily water use practices. An element of selfselectionmay also be at play for those householdsthat use the <strong>Water</strong> <strong>Energy</strong> Calculator. It is likely thatwater meters will help typical British households tobe more aware of how much water they use(discussed further in Appendix A). Metering has animportant role to play in improving water efficiency,leakage detection and giving customers control oftheir bills, as part of a wider range of demandmanagement interventions. We now look forward toinvestigating effective solutions for water efficiencyand consumer engagement in Phase 2.129 <strong>Water</strong> UK, <strong>Water</strong> Resources, available at: http://www.water.org.uk/home/resources-and-links/uk-waterindustry/resourcesaccessed: 01/04/201310 Environment Agency (2009) http://a0768b4a8a31e106d8b0-50dc802554eb38a24458b98ff72d550b.r19.cf3.rackcdn.com/geho0309bpkx-e-e.pdf11 Ofwat proportion of properties <strong>with</strong> a meter is 42%, as at March 2012. https://www.ofwat.gov.uk/consumerissues/chargesbills/prs_lft_charges2011-12.pdf12 Ofwat, <strong>Water</strong> meters, your questions answered. https://www.ofwat.gov.uk/mediacentre/leaflets/prs_lft_101117meters.pdf
<strong>Energy</strong> <strong>Saving</strong> <strong>Trust</strong><strong>At</strong> <strong>Home</strong> <strong>with</strong> <strong>Water</strong><strong>Water</strong> consumption by use Figure 1Washing machine9%Hand wash dishes 4%Dishwasher 1%Other (cold taps)22%Bath8%Garden 1%Car 1%Bathroom hot tap7%Shower25%Toilet22%Average water consumption per head Figure 2and per householdProportion of <strong>Water</strong> <strong>Energy</strong> Calculator Figure 3properties <strong>with</strong> a water meter1,000800813641600400285421534With a meter43%Without a meter57%2001541541431401341281230I person 2 person 3 person 4 person 5 person 6+ personLitres per personper dayLitres per householdper day13
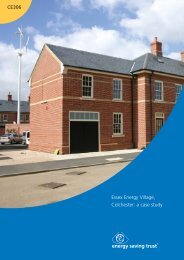
<strong>Energy</strong> <strong>Saving</strong> <strong>Trust</strong><strong>At</strong> <strong>Home</strong> <strong>with</strong> <strong>Water</strong>5. The billsOur water use in the home also contributes to our risingenergy bills. <strong>Water</strong> saving should be core business for energyefficiency and fuel poverty agendas.<strong>Water</strong> chargesHouseholds <strong>with</strong> water meters pay bills chargedproportionately <strong>with</strong> their usage, based on a per litretariff on top of a fixed standing charge. Modelledestimates from the <strong>Water</strong> <strong>Energy</strong> Calculator find thatthe average metered household uses 343 litres ofwater a day.On average, metered users of the Calculator haveslightly higher household occupancy (2.53 personsper household) than the average British home asreported by the water regulator Ofwat (2.1 personsper household 13 ). If we make an adjustment to matchOfwat’s occupancy figure, we see a more consistentcomparison 14 .Following this adjustment, the average water bill in ametered home is £369 15 , aligning it more closely toOfwat’s 2012/13 estimate of £341 16 . For unmeteredhomes, Ofwat’s 2012/13 estimate for the averagewater bill is £404.A water bill of £369 is 29% of the average combinedhousehold energy bill (gas + electricity) for a gasheated house, (£1,285 a year, Figure 4).These figures provide households <strong>with</strong> a goodindication of average water charges. They alsodemonstrate that the <strong>Water</strong> <strong>Energy</strong> Calculator canhelp households to establish their personal usageand their savings potential.14Breakdown and comparison of average Figure 4household energy and water bills£800£700£600£500£400£300£200£100£0£369 £341 £581 £704WECOfwatElectricityGasAnnual energy bills from heating Figure 5water in the kitchen and bathroom£500£450£400£350£300£250£200£150£100£50£0£62£108£163£203£242£304£50 £86 £110 £131 £149 £166I person 2 person 3 person 4 person 5 person 6+ personKitchenBathroom
<strong>Energy</strong> <strong>Saving</strong> <strong>Trust</strong><strong>At</strong> <strong>Home</strong> <strong>with</strong> <strong>Water</strong><strong>Energy</strong> chargeOn average, 16% of a household’s energy bill is fromwater-using activities, split across both gas andelectricity usage. This equates to around £228 ofthe typical respondent’s combined energy bill.Heated water (for activities such as baths, showers,washing up and water-using electrical appliances)contributes a lot to energy bills. But this link, and itsimplications, often goes unnoticed by householders.The <strong>Energy</strong> <strong>Saving</strong> <strong>Trust</strong> recommends that waterefficiency should be a core part of energy efficiency,fuel poverty, carbon reduction agendas and adviceprovided by those engaging <strong>with</strong> domestic customers.13 Ofwat (2010), Service and delivery – performance of the water companies in England and Wales 2009-10: Supporting information.14 Calculated by normalising estimates based on average occupancy of the sample; 2.53 persons permetered household (<strong>Water</strong> <strong>Energy</strong> Calculator) to 2.10 (Ofwat). Unadjusted figures show that the averagewater bill in a metered property is £427 a year.15 The <strong>Water</strong> <strong>Energy</strong> Calculator numbers in this graph based on an average water supply and sewagecharge of £2.73/m 3 , and also includes an average Standing Charge value.16 Ofwat – Average metered and unmetered bills; available at http://www.ofwat.gov.uk/regulating/charges/prs_web_charges2012-13; accessed 01/04/2013.15
<strong>Energy</strong> <strong>Saving</strong> <strong>Trust</strong><strong>At</strong> <strong>Home</strong> <strong>with</strong> <strong>Water</strong>6. Carbon emissionsImproving water efficiency inthe home could significantlyreduce our carbon emissions.We examined the carbon emissions from the <strong>Water</strong><strong>Energy</strong> Calculator responses.The energy used to heat water for devices andappliances emits an average of 875kg of CO 2perhousehold per year. This is equivalent to the CO 2emissions from driving more than 1,700 miles in anaverage family car 17 . The bathroom uses the mosthot water in the home, and so it is the roomresponsible for the most water-related carbonemissions (Figure 6).Carbon emissions from water heating Figure 6and water-using electrical devices in the homeBathroom539 kgCO 2Kitchen336 kgCO 2The energy used to heat water for devicesand appliances emits an average of 875kgof CO 2per household per year.1617 An average passenger car (any fuel) emits 0.311 kgCO 2per mile. Source: 2012 Guidelines to Defra/DECC’s GHG Conversion Factors for Company Reporting.
<strong>Energy</strong> <strong>Saving</strong> <strong>Trust</strong><strong>At</strong> <strong>Home</strong> <strong>with</strong> <strong>Water</strong>7. <strong>At</strong> <strong>Home</strong> <strong>with</strong> <strong>Water</strong> –the tourWe use water in three mainareas of the home: thebathroom, the kitchen andthe garden.Proportion of water use in the Figure 7home by areaOutdoor10%Showers, lavatories, baths and bathroom sinksconsume more than two-thirds (68%) of householdwater (Figure 7).Kitchen22%Bathroom68%The greatest opportunities for saving watercan be found in the bathroom.17
<strong>Energy</strong> <strong>Saving</strong> <strong>Trust</strong><strong>At</strong> <strong>Home</strong> <strong>with</strong> <strong>Water</strong>Period of manufacture of Figure 12household lavatoriesDo you have a dual-flush lavatory? Figure 131940-19806%* Before 1940: 0%After 200158%1980-200136%Yes41%No59%Flushing money awayToilets are the second highest domestic water-usingdevice after showers. They account for one-fifth(22%) of a British household’s water consumption.In a year, the average household flushes the toiletabout 4,600 times. That’s about 28,000 litres ofwater – enough to fill 350 standard baths.Flushing the toilet is an unavoidable fact of life. Butthere are opportunities here for substantial savings.In recent years, technical changes have improvedtheir efficiency. Yet 42% of toilets in British homeswere manufactured before 2001 (see Figure 12).This means that their larger flush volumes couldbe reduced through simple changes, offeringconsiderable water and financial savings.The <strong>Water</strong> Supply (<strong>Water</strong> Fitting Regulations) 1999prohibited the installation of new toilets that usedmore than six litres of water in a single flush. Someolder lavatories flush more than 13 litres. Althoughthe commencement of this regulation slightlypredates the question about toilet age used in the<strong>Water</strong> <strong>Energy</strong> Calculator, it is evident that a sizeableproportion of the nation’s WCs flush larger quantitiesof water than modern units. Significant savings couldbe made through simple retrofitting initiatives orreplacement schemes. Manufacturers have a vitalrole to play – efficient devices can stimulate demand.Displacing, retrofittingand replacingSome water companies offer their customers freewater displacement devices that can be placed incisterns that currently flush between six and ninelitres. These can reduce a flush by one or two litres.Even greater savings can be made by convertingan existing toilet cistern to a dual-flush system,or installing a new water efficient lavatory thateither uses less water in a single flush, or has adual-flush function.Upgrading a standard toilet to a dual-flushmechanism could save more than 7,000 litres perperson per year, cutting a four-person meteredhousehold’s annual water bill by around £80. Fourout of ten homes (41%) have a dual-flush toilet.Only 17% of households <strong>with</strong> pre-2001 toilets,reported having a cistern displacement device.From the response sample we estimate that up to48% of homes could still make some efficiencyimprovements to their toilets.21
<strong>Energy</strong> <strong>Saving</strong> <strong>Trust</strong><strong>At</strong> <strong>Home</strong> <strong>with</strong> <strong>Water</strong>The kitchenKitchens consume over a fifth (22%) of ahousehold’s water. Washing dishes, washingclothes, general cleaning and cooking all putthe plumbing to work.White goods account for much of the waterconsumption in the kitchen and ownership of whitegoods has risen rapidly. Almost every household inour sample reported using a washing machine athome (97%), and four in 10 a dishwasher (41%) 20 .But it is not simply the ownership of these devicesthat is important for water and energy consumption.It is how we use them (for example, choosingefficient settings, or fully loading) and how oftenwe use them.Washing machinesWashing machine uses per week Figure 14109876543210I person 2 person 3 person 4 person 5 person 6+ personIt is more efficient, in terms of both water andheating, to use a fully loaded washing machinethan it is to wash by hand.Per personPer householdAverageA modern automatic washing machine uses about50 litres of water per wash. Whilst that is still a lotof water, the good news is that families say that theyuse the washing machine less often than previouslythought. Data from the <strong>Water</strong> <strong>Energy</strong> Calculatorreports that households use the washing machine onaverage 4.7 times each week (Figure 14), lower thanpreviously used data (5.5 times per week) 21 .22
<strong>Energy</strong> <strong>Saving</strong> <strong>Trust</strong><strong>At</strong> <strong>Home</strong> <strong>with</strong> <strong>Water</strong>Typical washing machine Figure 15temperature selected* 90ºC: 0%Getting cooler!There is more good news. Households are using theirwashing machines at lower temperatures. The vastmajority (95%) say that they wash clothes at 30°C or40°C (Figure 15), showing that a shift to coolertemperatures is happening. But there is potential forfurther savings: only 24% opt for programmes thatwash at 30°C or below.40ºC70%60ºC6%30ºC24%Most respondents said they fully loaded theirwashing machine (Figure 16). Manufacturers advisethat machines should not be overloaded; but manynow say that because of better technology, fuller isbetter. This is certainly the case from an energysaving point of view. The increasing choice ofwashing powders and detergents that wash clothesat lower temperatures, coupled <strong>with</strong> more waterefficient appliances, is further driving markets andbehaviours to deliver greater sustainability savings.Proportion of households fully loading Figure 16the washing machine before useNo18%Washing machine ratingOne third of respondents (33%) did not know theefficiency rating of their washing machines. Of thosethat did: 22% were A+, 35% were A, and 10% were Bor lower. It is difficult to quantify how many washingmachines offer an ‘eco’ setting or performancerating, but the more we can encourage consumers tothink about the efficiency of their domesticappliances the more likely they are to makebeneficial choices when they come to replace them.Yes82%How often do you use a dishwasher? Figure 17More thanonce a day7%20 Office for National Statistics, Family Spending 2011, Table B5Characteristics of households, 2011, United Kingdom.21 Powering the Nation. http://www.energysavingtrust.org.uk/Publications2/Corporate/Research-and-insights/Powering-thenation-household-electricity-using-habits-revealedSee alsowww.energysavingtrust.org.uk/<strong>Energy</strong>-<strong>Saving</strong>-<strong>Trust</strong>/Ourcalculationsfor further information on the standard assumptionsused by the <strong>Energy</strong> <strong>Saving</strong> <strong>Trust</strong>.Never52%No morethan oncea day41%23
<strong>Energy</strong> <strong>Saving</strong> <strong>Trust</strong><strong>At</strong> <strong>Home</strong> <strong>with</strong> <strong>Water</strong>Split between washing up manually Figure 18and using a dishwasherDo you use a bowl when you wash up? Figure 19181614No, tap14%12108648.19.910.510.511.5 13.2Yes, bowl86%200.9I person2.32 person3.1 4.3 4.8 4.43 person 4 person 5 person 6+ personNo. of dishwasher washesNo. of washes by hand25
<strong>Energy</strong> <strong>Saving</strong> <strong>Trust</strong><strong>At</strong> <strong>Home</strong> <strong>with</strong> <strong>Water</strong>Number of times the kettle is boiled Figure 20per household per dayDo you boil more water than you need? Figure 2140353025Boil onlywhat theyneed 25%2015105040%4+ timesa day13%3-4 timesa day20%2-3 timesa day14% 10%1-2 times Up toa day once a day5%NeverBoil morethan needed75%Put the kettle onIt remains a staple of life in the UK. Day in, day outjust about every household in the country sticks onthe kettle at some point: 85% of respondents boil thekettle every day. On average, the kettle is brought tothe boil in each household 24 times every week. 40%of households boil the kettle five times a day ormore, but only one in 20 say they never boil a kettle(Figure 20).The bad news is that three out of four respondentssay they boil more water in the kettle than they need(Figure 21). Boiling water (in a kettle or on a stove forcooking) requires energy – and therefore costsmoney. Real savings come from boiling only what isneeded. We estimate that overfilling costs Britishhouseholds £68 million on energy bills a year. If onlyone person is having a hot drink, it makes no sense tofill or even half-fill the kettle. A half-full 1.8 litrekettle is enough for three cups of tea. All the energyused to heat the water you don’t use will be wasted.26
<strong>Energy</strong> <strong>Saving</strong> <strong>Trust</strong><strong>At</strong> <strong>Home</strong> <strong>with</strong> <strong>Water</strong>The great outdoorsOutdoor water use accounts for less than 10% ofour respondents’ household water consumption.It is split between two main activities – wateringthe garden and washing the car.Hoses and sprinklers typically use about 1,000 litresof water an hour – the equivalent of more thantwelve baths. Consequently, they are the first itemsrestricted by water companies in the event ofdrought. Although outdoor water use usuallyconstitutes a relatively small proportion of totalhousehold consumption, water companies canexperience a more problematic proportional effect intimes of drought, when households water theirgardens during the summer. Enacting a hosepipe banduring droughts is designed to reduce some peakwater consumption whilst preserving water for otheressential uses such as drinking, personal washingand flushing toilets.Four out of five (81%) <strong>Water</strong> <strong>Energy</strong> Calculator usershave a garden; and when it comes to watering it,42% of these households use a hosepipe.The carAbout 70% of car owners reported washing theirvehicles at home, rather than <strong>with</strong> a car wash at agarage or not at all (Figure 22). On average, we washour cars just under once a month (ten times a year).Since 22% of households still use a hose to washthe car, we could make further water savings byswitching to using a bucket.How cars are washed Figure 22<strong>Water</strong> buttsA water butt can be used to harvest rainwater foruse outdoors, which can save money all year round.Hosepipes that use rainwater are also not subject tothe standard ban on hosepipes connected to the tap.42% of households report owning a water butt, butonly 60% of these claim to use it. This is an easyopportunity missed.Do notwash car30%Use hose22%Use bucket48%27
<strong>Energy</strong> <strong>Saving</strong> <strong>Trust</strong><strong>At</strong> <strong>Home</strong> <strong>with</strong> <strong>Water</strong>8. Towards improvedwater efficiencyMany households are taking steps to improvewater efficiency and save money, but there isstill a lot more we can do.This includes using a number of devices andmodifying their behaviour, such as thosehighlighted in this report (for example,installing eco-showerheads or dual-flushlavatories). In almost every case,households fitted <strong>with</strong> water meters weremore likely than those homes that receiveflat-rate water bills to report that they werealready undertaking eco-efficient watermeasures (Figure 23). They can see thebenefit of making the changes.A significant proportion of households <strong>with</strong>water meters asked for it to be installed,generally because it is the financially astuteoption. Not all properties, such as someolder housing stock and flats, can be fitted<strong>with</strong> meters. It is clear that having a meterinstalled can encourage households to bemore water efficient and therefore moreenergy efficient too.<strong>Water</strong>-related eco measures in metered and unmetered households Figure 2328Wash dishes <strong>with</strong> a bowl, not under a running tap 88%88%87%Do not have a dripping tap 87%85%Use a hose trigger when watering garden 83%85%Fill the washing machine before use 80%77%Fill the dishwasher before use 78%80%Do not run the tap whilst brushing teeth 70%45%Have a dual flush toilet 39%49%Use a water butt in their garden 37%24%Boil only what they need in the kettle 25%26%Use a dishwasher eco-setting 23%29%Have an eco-showerhead 21%27%Have a cistern displacement device 11%0 20 40 60 80 100MeteredNon-metered
<strong>Energy</strong> <strong>Saving</strong> <strong>Trust</strong><strong>At</strong> <strong>Home</strong> <strong>with</strong> <strong>Water</strong>9. Our water efficiency prioritiesThe <strong>Water</strong> <strong>Energy</strong> Calculator has provideda vivid picture of where and how householdersare currently using water.It has identified the devices and waterconsumption behaviours across GreatBritain, shows there is more that can bedone, and that there is more help andsupport required.To help us prioritise the opportunitiesfor future water, energy and moneysaving potential, the <strong>Energy</strong> <strong>Saving</strong> <strong>Trust</strong>recommends the following simple actionsthat can be undertaken either by UKhouseholds or the relevant stakeholders.• Aim to replace all remaining old orhigh-flow showerheads <strong>with</strong> waterefficient showerheads (<strong>with</strong> flow ratesof eight litres per minute or fewer).• Increase efforts on water efficiencyeducation, specifically to promote thebenefits of shorter showers.• Aim to either retrofit and/or replace allhigh-volume flush toilets.• Ensure that the most energy and waterefficient machines available arepromoted and incentivised.• When purchasing or replacing waterusingappliances, choose the mostenergy and water efficient model.• Increase the penetration of water metersin GB housing stock. Reported uptake ofwater efficient devices and behaviourswas found to be greater in meteredproperties. The rollout of water meteringcan also provide a key opportunity forhouseholder engagement and educationon household-specific water savingopportunities.• Seek to combine water and energysaving education and delivery schemesfor the benefit of the consumer.• Support and promote the <strong>Water</strong> Label bylinking <strong>with</strong> built environment,procurement and water efficiencyinitiatives.29
<strong>Energy</strong> <strong>Saving</strong> <strong>Trust</strong><strong>At</strong> <strong>Home</strong> <strong>with</strong> <strong>Water</strong>10. What next?The Big <strong>Energy</strong> Rethink will ask the questions that have tobe asked, and will generate solutions across the sustainabilityspectrum – energy efficiency, smart technologies, smarterdriving and more.<strong>At</strong> <strong>Home</strong> <strong>with</strong> <strong>Water</strong> will continue to investigatehousehold water consumption. Better understandingwill help us to develop practical ways to save waterand energy. The real success will be up to familiesand individuals. Therefore, we need solutions thatsuit them. We will soon continue this journey byspending time <strong>with</strong> families, in their homes. We willcompletely ‘rethink’ the nation’s potential to savewater and energy.We will work <strong>with</strong> leading organisations to get realpeople in real homes to conceive the best real lifesolutions. Watch this space.30
<strong>Energy</strong> <strong>Saving</strong> <strong>Trust</strong><strong>At</strong> <strong>Home</strong> <strong>with</strong> <strong>Water</strong>Appendix A – A note about methodologyThe <strong>Water</strong> <strong>Energy</strong> Calculator is a selfcompletiononline tool on the <strong>Energy</strong> <strong>Saving</strong><strong>Trust</strong>’s website (www.est.org.uk). More than100,000 respondents used the Calculatorfrom June 2010 to December 2012. Thedata has been cleansed to resolve missing,inconsistent or irregular responses,generating a total sample size of 86,171responses for analysis. For the total waterand energy consumption calculations, asub-set of 38,839 responses were used, toinclude only respondents that were fullyexplicit in their answers. Those removed atthis stage include 30% that did not knowthe rating of their washing machine, 10%that did not know the age of their toilet,and 2% that did not know the age of theirdishwasher. Where these responses wereunavailable calculations could not be made<strong>with</strong>out interpolation of data based onadditional assumptions. Removing thesenonetheless retained a large data-set.The data points collected were self-reportedanswers to closed questions, and werecognise that there are a number ofpotential biases present in this type ofapproach. Where possible we have soughtto evaluate our results against recognisedbenchmarks and this has revealed strongvalidity. These are aspects which we hopeto explore further in Phase 2.AssumptionsThe following are used in our modelling and calculations 22 :Shower13 litres/min power shower, 8 litres/min mixer shower, 5 litres/min electric showerBath80 litres per full bathToilet5 flushes/day/occupant; dual-flush 5 litres/flush, post-2001 5 litres/flush, 1980-2001 7.5 litres/flush, 1940-1980 9 litres per flush, pre-1940 12 litres per flushWashing Machine50 litres/cycleDishwasherpre-2000 25 litres/cycle, post-2000 14 litres/cycle, Eco setting 10 litres/cycleHand Washing8 litres per bowl wash, 30 litres per running tap washCar Washing250 litres per hose use, 30 litres per bucket use<strong>Water</strong> temperatures Temperature (ºC) Temperature Rise (ºC)Mains 13.4 -Shower 41.0 27.6Basin hot 55.0 41.6Kitchen sink hot 55.0 41.6Bath 44.0 30.6specific heat capacity (kWh / L / K) 0.00116Cost and Carbon Factors p/kWh kgCO 2/kWhGas 4.64 0.185Oil 6.02 0.246LPG 8.77 0.214Electricity E7 (for heating) 9.08 0.517Solid Fuel 3.69 0.296Biomass 4.20 0.000Electricity Standard (for nonheating)15.32 0.517<strong>Water</strong> heating efficiency Standard A-RatedGas 65% 73%Oil 68% 73%LPG 65% 73%Electricity E7 (for heating) 100% -Solid Fuel 50% -3222 See also www.energysavingtrust.org.uk/<strong>Energy</strong>-<strong>Saving</strong>-<strong>Trust</strong>/Our-calculations for further information onthe standard assumptions used by the <strong>Energy</strong> <strong>Saving</strong> <strong>Trust</strong>.
<strong>Energy</strong> <strong>Saving</strong> <strong>Trust</strong><strong>At</strong> <strong>Home</strong> <strong>with</strong> <strong>Water</strong>Appendix B – <strong>Water</strong> <strong>Energy</strong> Calculator questions1. How many people live in your home?2. How do you heat your water?3. Do you have an A-rated boiler?4. Do you have a water meter?5. Which water company are you <strong>with</strong>?6. How many times do you use your washingmachine per week?7. What temperature do you generally wash yourclothes at?8. What is the energy rating of your washingmachine?9. Do you fully load the washing machine beforeusing it?10. How many times does your household use thekettle each week?11. Do you boil more water than you need?12. How many times does your household wash upby hand each week?13. Do you use a bowl for washing up?14. How many times do you use your dishwasherper week?15. How old is your dishwasher (bought before orafter 2000)?16. Do you use the eco setting (if dishwasher ispost 2000)?17. Do you fully load the dishwasher before using it?18. How many baths does your household take perweek?19. Do you fill the bath up every time you use it?20. What kind of shower do you have?21. Do you have a low-flow or eco-shower head(not suitable for electric showers)?22. How many showers does your household takeper week?23. How many minutes, on average, does oneshower last?24. Do you leave the tap running when you cleanyour teeth?25. Do you ensure taps are fully turned off toprevent drips?26. When was your toilet manufactured?27. Does your toilet have a dual flush mechanism?28. Do you use a toilet displacement device (waterhippo etc.)?29. Do you have a car?30. Do you use a hose to clean your car?31. How many times do you wash your car at homeeach year?32. Do you have a garden?33. Do you use the hose to water the garden?34. Do you have a trigger operated spray gun foryour hose?35. Do you own a water butt?36. Do you use the water collected in your butt in thegarden, to wash the car etc?33
<strong>Energy</strong> <strong>Saving</strong> <strong>Trust</strong><strong>At</strong> <strong>Home</strong> <strong>with</strong> <strong>Water</strong>About the <strong>Energy</strong> <strong>Saving</strong> <strong>Trust</strong>Charitable FoundationWe give evidence-based insight and advice to empowermillions to lead affordable, low-energy lifestyles.We are the leading UK organisation in developingevidenced-based insight, research and advice toengage households and communities on their energyand water use. We are a social enterprise <strong>with</strong> acharitable Foundation. Profits from our greenenterprise activities go to our Foundation, to allow usto promote and advance the education of the publicin the conservation, protection and improvement ofthe physical and natural environment.We do this to help protect the world’s climatesystems. Our focus is on reducing and makingsustainable the UK’s use of energy and water, andensuring the prudent use of non-renewable resourcesfor public benefit.There are three very good reasons to promoteaffordable, low-energy lifestyles:1. Leading scientists are united in the beliefthat climate change is real and that actionis required now2. Household fuel bills continue to rise3. Our reliance on imported energy fromabroad is not sustainableThe most practical and cost-effective way to addressthese issues is to reduce our energy consumption.<strong>Saving</strong> energy – or not wasting it – makes total sense.34
<strong>Energy</strong> <strong>Saving</strong> <strong>Trust</strong>21 Dartmouth StreetLondon, SW1H 9BPenergysavingtrust.org.ukCO337 © <strong>Energy</strong> <strong>Saving</strong> <strong>Trust</strong>, July 2013