Nutrient Transport Modelling in the Daugava River Basin - DiVA Portal
Nutrient Transport Modelling in the Daugava River Basin - DiVA Portal
Nutrient Transport Modelling in the Daugava River Basin - DiVA Portal

Create successful ePaper yourself
Turn your PDF publications into a flip-book with our unique Google optimized e-Paper software.
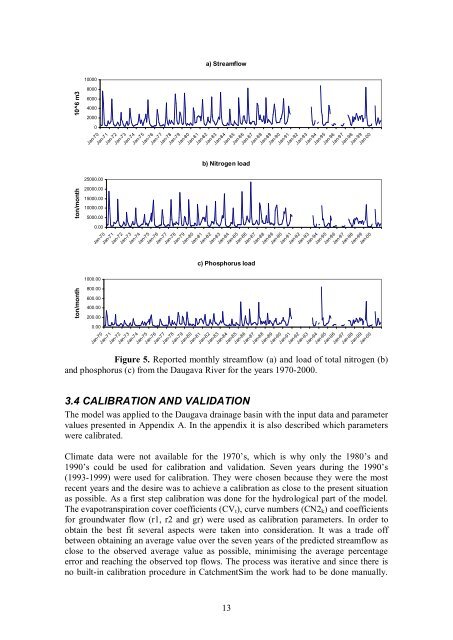
10^6 m3ton/monthton/month1000080006000400020000Jan70Jan7125000.0020000.0015000.0010000.005000.000.001000.00800.00600.00400.00200.000.00Jan70Jan71Jan70Jan71Jan72Jan73a) StreamflowJan72Jan73Jan74Jan75Jan76Jan77Jan78Jan79Jan80Jan81Jan82Jan83Jan84Jan85Jan86b) Nitrogen loadJan72Jan73Jan74Jan75Jan76Jan77Jan78Jan79Jan80Jan81Jan82Jan83Jan84Jan85Jan86c) Phosphorus loadJan74Jan75Jan76Jan77Jan78Jan79Jan80Jan81Jan82Jan83Jan84Jan85Jan86Jan87Jan88Jan89Jan90Jan87Jan88Jan89Jan90Jan91Jan92Jan93Jan94Jan95Jan96Jan97Jan98Jan99Jan00Jan87Jan88Jan89Jan90Jan91Jan92Jan93Jan94Jan95Jan96Jan97Jan98Jan99Jan00Jan91Jan92Jan93Jan94Jan95Jan96Jan97Jan98Jan99Jan00Figure 5. Reported monthly streamflow (a) and load of total nitrogen (b)and phosphorus (c) from <strong>the</strong> <strong>Daugava</strong> <strong>River</strong> for <strong>the</strong> years 19702000.3.4 CALIBRATION AND VALIDATIONThe model was applied to <strong>the</strong> <strong>Daugava</strong> dra<strong>in</strong>age bas<strong>in</strong> with <strong>the</strong> <strong>in</strong>put data and parametervalues presented <strong>in</strong> Appendix A. In <strong>the</strong> appendix it is also described which parameterswere calibrated.Climate data were not available for <strong>the</strong> 1970’s, which is why only <strong>the</strong> 1980’s and1990’s could be used for calibration and validation. Seven years dur<strong>in</strong>g <strong>the</strong> 1990’s(19931999) were used for calibration. They were chosen because <strong>the</strong>y were <strong>the</strong> mostrecent years and <strong>the</strong> desire was to achieve a calibration as close to <strong>the</strong> present situationas possible. As a first step calibration was done for <strong>the</strong> hydrological part of <strong>the</strong> model.The evapotranspiration cover coefficients (CV t ), curve numbers (CN2 k ) and coefficientsfor groundwater flow (r1, r2 and gr) were used as calibration parameters. In order toobta<strong>in</strong> <strong>the</strong> best fit several aspects were taken <strong>in</strong>to consideration. It was a trade offbetween obta<strong>in</strong><strong>in</strong>g an average value over <strong>the</strong> seven years of <strong>the</strong> predicted streamflow asclose to <strong>the</strong> observed average value as possible, m<strong>in</strong>imis<strong>in</strong>g <strong>the</strong> average percentageerror and reach<strong>in</strong>g <strong>the</strong> observed top flows. The process was iterative and s<strong>in</strong>ce <strong>the</strong>re isno built<strong>in</strong> calibration procedure <strong>in</strong> CatchmentSim <strong>the</strong> work had to be done manually.13