Nutrient Transport Modelling in the Daugava River Basin - DiVA Portal
Nutrient Transport Modelling in the Daugava River Basin - DiVA Portal
Nutrient Transport Modelling in the Daugava River Basin - DiVA Portal

Create successful ePaper yourself
Turn your PDF publications into a flip-book with our unique Google optimized e-Paper software.
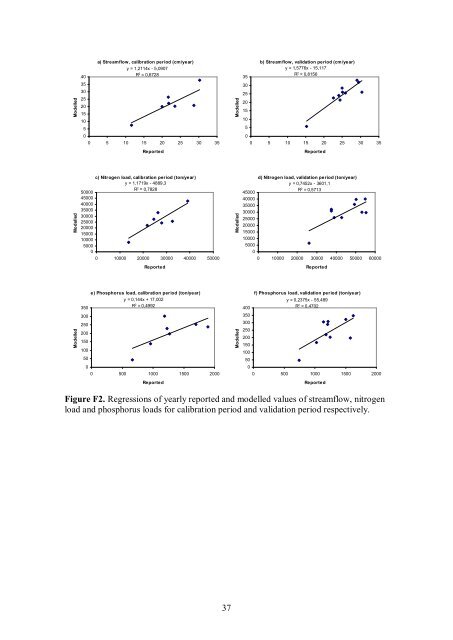
Modelled4035302520151050a) Streamflow , calibration period (cm/year)y = 1,2114x 5,0907R 2 = 0,67280 5 10 15 20 25 30 35ReportedModelled35302520151050b) Streamflow, validation period (cm/year)y = 1,5776x 15,117R 2 = 0,81560 5 10 15 20 25 30 35ReportedModelled50000450004000035000300002500020000150001000050000c) Nitrogen load, calibration period (ton/year)y = 1,1719x 4889,3R 2 = 0,78280 10000 20000 30000 40000 50000ReportedModelled450004000035000300002500020000150001000050000d) Nitrogen load, validation period (ton/year)y = 0,7452x 3601,1R 2 = 0,57130 10000 20000 30000 40000 50000 60000ReportedModelled350300250200150100500e) Phosphorus load, calibration period (ton/year)y = 0,144x + 17,002R 2 = 0,49920 500 1000 1500 2000ReportedModelled400350300250200150100500f) Phosphorus load, validation period (ton/year)y = 0,2375x 55,489R 2 = 0,47020 500 1000 1500 2000ReportedFigure F2. Regressions of yearly reported and modelled values of streamflow, nitrogenload and phosphorus loads for calibration period and validation period respectively.37