Nutrient Transport Modelling in the Daugava River Basin - DiVA Portal
Nutrient Transport Modelling in the Daugava River Basin - DiVA Portal
Nutrient Transport Modelling in the Daugava River Basin - DiVA Portal

You also want an ePaper? Increase the reach of your titles
YUMPU automatically turns print PDFs into web optimized ePapers that Google loves.
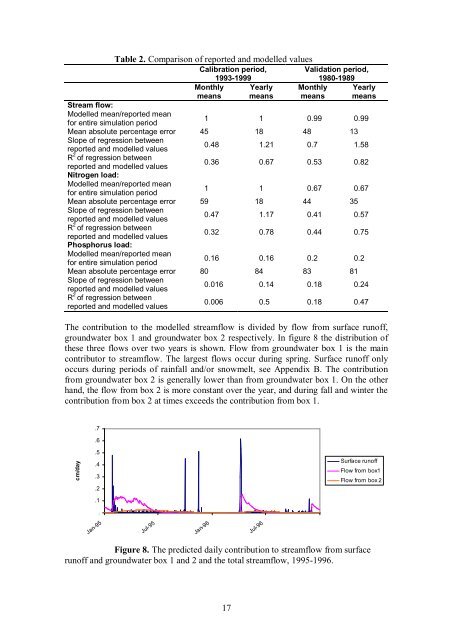
Table 2. Comparison of reported and modelled valuesCalibration period,19931999Validation period,19801989MonthlymeansYearlymeansMonthlymeansYearlymeansStream flow:Modelled mean/reported meanfor entire simulation period1 1 0.99 0.99Mean absolute percentage error 45 18 48 13Slope of regression betweenreported and modelled values0.48 1.21 0.7 1.58R 2 of regression betweenreported and modelled values0.36 0.67 0.53 0.82Nitrogen load:Modelled mean/reported meanfor entire simulation period1 1 0.67 0.67Mean absolute percentage error 59 18 44 35Slope of regression betweenreported and modelled values0.47 1.17 0.41 0.57R 2 of regression betweenreported and modelled values0.32 0.78 0.44 0.75Phosphorus load:Modelled mean/reported meanfor entire simulation period0.16 0.16 0.2 0.2Mean absolute percentage error 80 84 83 81Slope of regression betweenreported and modelled values0.016 0.14 0.18 0.24R 2 of regression betweenreported and modelled values0.006 0.5 0.18 0.47The contribution to <strong>the</strong> modelled streamflow is divided by flow from surface runoff,groundwater box 1 and groundwater box 2 respectively. In figure 8 <strong>the</strong> distribution of<strong>the</strong>se three flows over two years is shown. Flow from groundwater box 1 is <strong>the</strong> ma<strong>in</strong>contributor to streamflow. The largest flows occur dur<strong>in</strong>g spr<strong>in</strong>g. Surface runoff onlyoccurs dur<strong>in</strong>g periods of ra<strong>in</strong>fall and/or snowmelt, see Appendix B. The contributionfrom groundwater box 2 is generally lower than from groundwater box 1. On <strong>the</strong> o<strong>the</strong>rhand, <strong>the</strong> flow from box 2 is more constant over <strong>the</strong> year, and dur<strong>in</strong>g fall and w<strong>in</strong>ter <strong>the</strong>contribution from box 2 at times exceeds <strong>the</strong> contribution from box 1..7.6cm/day.5.4.3.2.1.Surface runoffFlow from box1Flow from box 2Jan95Jul95Jan96Jul96Figure 8. The predicted daily contribution to streamflow from surfacerunoff and groundwater box 1 and 2 and <strong>the</strong> total streamflow, 19951996.17