Turbulent Heat Transfer and Pressure Drop for - PPGEM
Turbulent Heat Transfer and Pressure Drop for - PPGEM
Turbulent Heat Transfer and Pressure Drop for - PPGEM
- No tags were found...

Create successful ePaper yourself
Turn your PDF publications into a flip-book with our unique Google optimized e-Paper software.
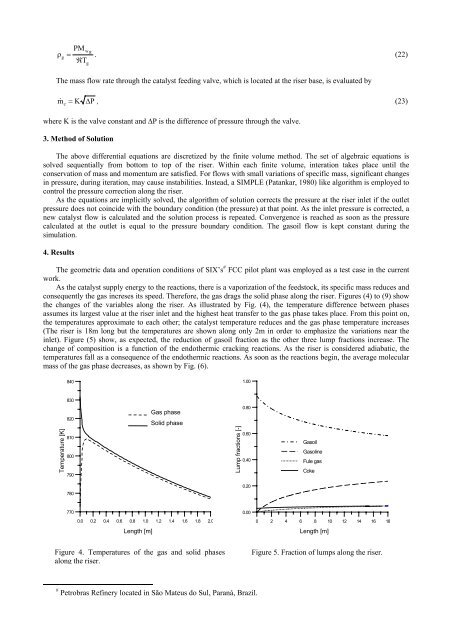
PMw gρg= . (22)RTgThe mass flow rate through the catalyst feeding valve, which is located at the riser base, is evaluated by = K ∆P, (23)m cwhere K is the valve constant <strong>and</strong> ∆P is the difference of pressure through the valve.3. Method of SolutionThe above differential equations are discretized by the finite volume method. The set of algebraic equations issolved sequentially from bottom to top of the riser. Within each finite volume, interation takes place until theconservation of mass <strong>and</strong> momentum are satisfied. For flows with small variations of specific mass, significant changesin pressure, during iteration, may cause instabilities. Instead, a SIMPLE (Patankar, 1980) like algorithm is employed tocontrol the pressure correction along the riser.As the equations are implicitly solved, the algorithm of solution corrects the pressure at the riser inlet if the outletpressure does not coincide with the boundary condition (the pressure) at that point. As the inlet pressure is corrected, anew catalyst flow is calculated <strong>and</strong> the solution process is repeated. Convergence is reached as soon as the pressurecalculated at the outlet is equal to the pressure boundary condition. The gasoil flow is kept constant during thesimulation.4. ResultsThe geometric data <strong>and</strong> operation conditions of SIX’s # FCC pilot plant was employed as a test case in the currentwork.As the catalyst supply energy to the reactions, there is a vaporization of the feedstock, its specific mass reduces <strong>and</strong>consequently the gas increses its speed. There<strong>for</strong>e, the gas drags the solid phase along the riser. Figures (4) to (9) showthe changes of the variables along the riser. As illustrated by Fig. (4), the temperature difference between phasesassumes its largest value at the riser inlet <strong>and</strong> the highest heat transfer to the gas phase takes place. From this point on,the temperatures approximate to each other; the catalyst temperature reduces <strong>and</strong> the gas phase temperature increases(The riser is 18m long but the temperatures are shown along only 2m in order to emphasize the variations near theinlet). Figure (5) show, as expected, the reduction of gasoil fraction as the other three lump fractions increase. Thechange of composition is a function of the endothermic cracking reactions. As the riser is considered adiabatic, thetemperatures fall as a consequence of the endothermic reactions. As soon as the reactions begin, the average molecularmass of the gas phase decreases, as shown by Fig. (6).8401.00830Temperature [K]820810800790Gas phaseSolid phaseLump fractions [-]0.800.600.40GasoilGasolineFule gasCoke0.207807700.000.0 0.2 0.4 0.6 0.8 1.0 1.2 1.4 1.6 1.8 2.00 2 4 6 8 10 12 14 16 18Length [m]Length [m]Figure 4. Temperatures of the gas <strong>and</strong> solid phasesalong the riser.Figure 5. Fraction of lumps along the riser.# Petrobras Refinery located in São Mateus do Sul, Paraná, Brazil.