Turbulent Heat Transfer and Pressure Drop for - PPGEM
Turbulent Heat Transfer and Pressure Drop for - PPGEM
Turbulent Heat Transfer and Pressure Drop for - PPGEM
- No tags were found...

Create successful ePaper yourself
Turn your PDF publications into a flip-book with our unique Google optimized e-Paper software.
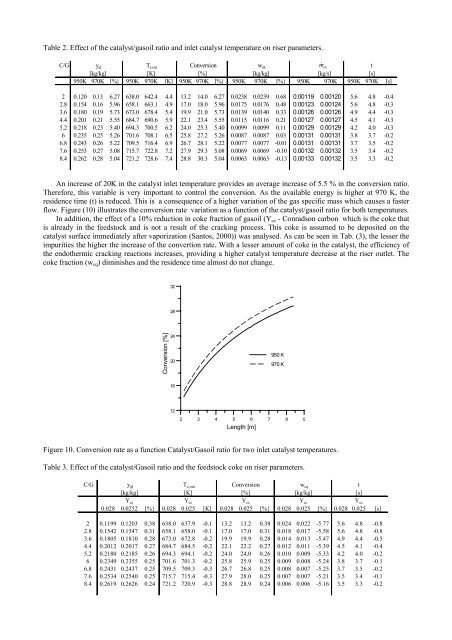
Table 2. Effect of the catalyst/gasoil ratio <strong>and</strong> inlet catalyst temperature on riser parameters.C/G y gl T c,out Conversion w ck t[kg/kg] [K] [%] [kg/kg] [kg/s] [s]950K 970K [%} 950K 970K [K] 950K 970K [%} 950K 970K [%} 950K 970K 950K 970K [s]2 0.120 0.13 6.27 638.0 642.4 4.4 13.2 14.0 6.27 0.0238 0.0239 0.68 0.00119 0.00120 5.6 4.8 -0.42.8 0.154 0.16 5.96 658.1 663.1 4.9 17.0 18.0 5.96 0.0175 0.0176 0.48 0.00123 0.00124 5.6 4.8 -0.33.6 0.180 0.19 5.73 673.0 678.4 5.4 19.9 21.0 5.73 0.0139 0.0140 0.33 0.00126 0.00126 4.9 4.4 -0.34.4 0.201 0.21 5.55 684.7 690.6 5.9 22.1 23.4 5.55 0.0115 0.0116 0.21 0.00127 0.00127 4.5 4.1 -0.35.2 0.218 0.23 5.40 694.3 700.5 6.2 24.0 25.3 5.40 0.0099 0.0099 0.11 0.00129 0.00129 4.2 4.0 -0.36 0.235 0.25 5.26 701.6 708.1 6.5 25.8 27.2 5.26 0.0087 0.0087 0.03 0.00131 0.00131 3.8 3.7 -0.26.8 0.243 0.26 5.22 709.5 716.4 6.9 26.7 28.1 5.22 0.0077 0.0077 -0.01 0.00131 0.00131 3.7 3.5 -0.27.6 0.253 0.27 5.08 715.7 722.8 7.2 27.9 29.3 5.08 0.0069 0.0069 -0.10 0.00132 0.00132 3.5 3.4 -0.28.4 0.262 0.28 5.04 721.2 728.6 7.4 28.8 30.3 5.04 0.0063 0.0063 -0.13 0.00133 0.00132 3.5 3.3 -0.2m ckAn increase of 20K in the catalyst inlet temperature provides an average increase of 5.5 % in the conversion ratio.There<strong>for</strong>e, this variable is very important to control the conversion. As the available energy is higher at 970 K, theresidence time (t) is reduced. This is a consequence of a higher variation of the gas specific mass which causes a fasterflow. Figure (10) illustrates the conversion rate variation as a function of the catalyst/gasoil ratio <strong>for</strong> both temperatures.In addition, the effect of a 10% reduction in coke fraction of gasoil (Y cc - Conradson carbon which is the coke thatis already in the feedstock <strong>and</strong> is not a result of the cracking process. This coke is assumed to be deposited on thecatalyst surface immediately after vaporization (Santos, 2000)) was analysed. As can be seen in Tab. (3), the lesser theimpurities the higher the increase of the convertion rate. With a lesser amount of coke in the catalyst, the efficiency ofthe endothermic cracking reactions increases, providing a higher catalyst temperature decrease at the riser outlet. Thecoke fraction (w cq ) diminishes <strong>and</strong> the residence time almost do not change.3228Conversion [%]2420950 K970 K16122 3 4 5 6 7 8 9Length [m]Figure 10. Conversion rate as a function Catalyst/Gasoil ratio <strong>for</strong> two inlet catalyst temperatures.Table 3. Effect of the catalyst/Gasoil ratio <strong>and</strong> the feedstock coke on riser parameters.C/G y gl T c,out Conversion w cq t[kg/kg] [K] [%] [kg/kg] [s]Y cc Y cc Y cc Y cc Y cc0.028 0.0252 [%} 0.028 0.025 [K] 0.028 0.025 [%} 0.028 0.025 [%} 0.028 0.025 [s]2 0.1199 0.1203 0.38 638.0 637.9 -0.1 13.2 13.2 0.38 0.024 0.022 -5.77 5.6 4.8 -0.82.8 0.1542 0.1547 0.31 658.1 658.0 -0.1 17.0 17.0 0.31 0.018 0.017 -5.58 5.6 4.8 -0.83.6 0.1805 0.1810 0.28 673.0 672.8 -0.2 19.9 19.9 0.28 0.014 0.013 -5.47 4.9 4.4 -0.54.4 0.2012 0.2017 0.27 684.7 684.5 -0.2 22.1 22.2 0.27 0.012 0.011 -5.39 4.5 4.1 -0.45.2 0.2180 0.2185 0.26 694.3 694.1 -0.2 24.0 24.0 0.26 0.010 0.009 -5.33 4.2 4.0 -0.26 0.2349 0.2355 0.25 701.6 701.3 -0.2 25.8 25.9 0.25 0.009 0.008 -5.24 3.8 3.7 -0.16.8 0.2431 0.2437 0.25 709.5 709.3 -0.3 26.7 26.8 0.25 0.008 0.007 -5.25 3.7 3.5 -0.27.6 0.2534 0.2540 0.25 715.7 715.4 -0.3 27.9 28.0 0.25 0.007 0.007 -5.21 3.5 3.4 -0.18.4 0.2619 0.2626 0.24 721.2 720.9 -0.3 28.8 28.9 0.24 0.006 0.006 -5.16 3.5 3.3 -0.2