Turbulent Heat Transfer and Pressure Drop for - PPGEM
Turbulent Heat Transfer and Pressure Drop for - PPGEM
Turbulent Heat Transfer and Pressure Drop for - PPGEM
- No tags were found...

Create successful ePaper yourself
Turn your PDF publications into a flip-book with our unique Google optimized e-Paper software.
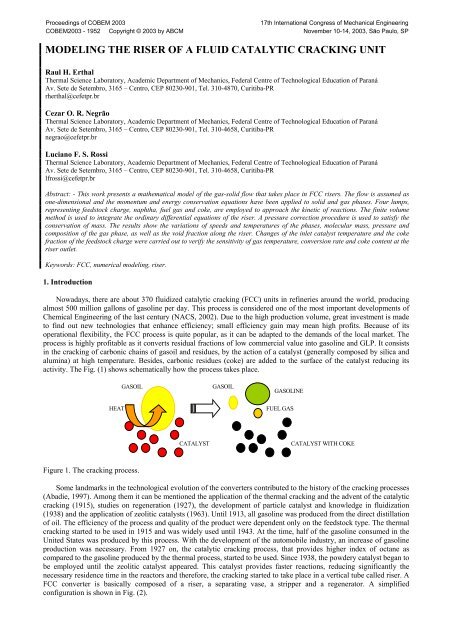
MODELING THE RISER OF A FLUID CATALYTIC CRACKING UNITRaul H. ErthalThermal Science Laboratory, Academic Department of Mechanics, Federal Centre of Technological Education of ParanáAv. Sete de Setembro, 3165 – Centro, CEP 80230-901, Tel. 310-4870, Curitiba-PRrherthal@cefetpr.brCezar O. R. NegrãoThermal Science Laboratory, Academic Department of Mechanics, Federal Centre of Technological Education of ParanáAv. Sete de Setembro, 3165 – Centro, CEP 80230-901, Tel. 310-4658, Curitiba-PRnegrao@cefetpr.brLuciano F. S. RossiThermal Science Laboratory, Academic Department of Mechanics, Federal Centre of Technological Education of ParanáAv. Sete de Setembro, 3165 – Centro, CEP 80230-901, Tel. 310-4658, Curitiba-PRlfrossi@cefetpr.brAbstract: - This work presents a mathematical model of the gas-solid flow that takes place in FCC risers. The flow is assumed asone-dimensional <strong>and</strong> the momentum <strong>and</strong> energy conservation equations have been applied to solid <strong>and</strong> gas phases. Four lumps,representing feedstock charge, naphtha, fuel gas <strong>and</strong> coke, are employed to approach the kinetic of reactions. The finite volumemethod is used to integrate the ordinary differential equations of the riser. A pressure correction procedure is used to satisfy theconservation of mass. The results show the variations of speeds <strong>and</strong> temperatures of the phases, molecular mass, pressure <strong>and</strong>composition of the gas phase, as well as the void fraction along the riser. Changes of the inlet catalyst temperature <strong>and</strong> the cokefraction of the feedstock charge were carried out to verify the sensitivity of gas temperature, conversion rate <strong>and</strong> coke content at theriser outlet.Keywords: FCC, numerical modeling, riser.1. IntroductionNowadays, there are about 370 fluidized catalytic cracking (FCC) units in refineries around the world, producingalmost 500 million gallons of gasoline per day. This process is considered one of the most important developments ofChemical Engineering of the last century (NACS, 2002). Due to the high production volume, great investment is madeto find out new technologies that enhance efficiency; small efficiency gain may mean high profits. Because of itsoperational flexibility, the FCC process is quite popular, as it can be adapted to the dem<strong>and</strong>s of the local market. Theprocess is highly profitable as it converts residual fractions of low commercial value into gasoline <strong>and</strong> GLP. It consistsin the cracking of carbonic chains of gasoil <strong>and</strong> residues, by the action of a catalyst (generally composed by silica <strong>and</strong>alumina) at high temperature. Besides, carbonic residues (coke) are added to the surface of the catalyst reducing itsactivity. The Fig. (1) shows schematically how the process takes place.GASOILGASOILGASOLINEHEATFUEL GASCATALYSTCATALYST WITH COKEFigure 1. The cracking process.Some l<strong>and</strong>marks in the technological evolution of the converters contributed to the history of the cracking processes(Abadie, 1997). Among them it can be mentioned the application of the thermal cracking <strong>and</strong> the advent of the catalyticcracking (1915), studies on regeneration (1927), the development of particle catalyst <strong>and</strong> knowledge in fluidization(1938) <strong>and</strong> the application of zeolitic catalysts (1963). Until 1913, all gasoline was produced from the direct distillationof oil. The efficiency of the process <strong>and</strong> quality of the product were dependent only on the feedstock type. The thermalcracking started to be used in 1915 <strong>and</strong> was widely used until 1943. At the time, half of the gasoline consumed in theUnited States was produced by this process. With the development of the automobile industry, an increase of gasolineproduction was necessary. From 1927 on, the catalytic cracking process, that provides higher index of octane ascompared to the gasoline produced by the thermal process, started to be used. Since 1938, the powdery catalyst began tobe employed until the zeolitic catalyst appeared. This catalyst provides faster reactions, reducing significantly thenecessary residence time in the reactors <strong>and</strong> there<strong>for</strong>e, the cracking started to take place in a vertical tube called riser. AFCC converter is basically composed of a riser, a separating vase, a stripper <strong>and</strong> a regenerator. A simplifiedconfiguration is shown in Fig. (2).
PRODUCTSSEPARATORVESSELE-2RISERSTRIPPERCOMBUSTIONGASREGENERATORSPENTCATALYSTAIRREGENERATECATALYSTGASOIL -DISPERSIONAND LIFTSTEAMFigure 2. Simplified scheme of a FCC converter.The feedstock charge at 200 o C is placed in contact with a catalyst at a higher temperature (700 o C). When in contactwith the catalyst, the load receives energy enough to be heated, to vaporize <strong>and</strong> to produce the endothermic reactions ofthe cracking. Due to the high temperature <strong>and</strong> to the catalytic properties of the medium, the load molecules are broken,resulting in lighter composites <strong>and</strong> coke. Coke consists basically of carbonic chains not cracked, hydrogen <strong>and</strong> aromaticcompounds with characteristics of graphite <strong>and</strong> it is responsible <strong>for</strong> deactivation of the catalyst. The catalyst is draggedby the vaporized load as a consequence of its specific mass variation. In case the reactions were not interrupted, theproducts at the riser outlet would be only carbon, methane <strong>and</strong> hydrogen, which do not have commercial value. At theriser outlet, the mixture goes to a separating vase, where the products are separated from catalyst by cyclones. Afterpass through a stripper, the particles are delivered to a regenerator where the coke is burnt <strong>and</strong> the catalyst is reheated.Since it is clean again, the catalyst goes to the riser, completing the cycle.The modeling of the FCC plants started from the need to underst<strong>and</strong> the cracking reactions. The problem consists inthe evaluation of the specific mass gradient that results from the cracking reactions; the key point of the modeling of theriser. Facing this challenge, the first known kinetic model was developed by Weekman (1968) (cited by Ellis <strong>and</strong> Riggs(1998)). The model considered the gas phase composed of three pseudo-components, called lumps (gasoil, gasoline <strong>and</strong>light oil). According to Martignoni (2000), lumps are composites with similar characteristics such as, molecular mass<strong>and</strong> boiling point. Later, Jacob et al (1976) extended the model of three lumps to a ten lumps model. Other modelsfollowed the same strategy, as the four lumps of Lee et al. (1989) (coke is the fourth lump) <strong>and</strong> the five lumps ofCorella et al. (1991) (cited by Juarez et al. (1997)); the heavy fractions comprise the fifth lump. Since then, the studiesemphasized the chemistry of the process since all the kinetic models depend on constants of reaction <strong>and</strong> energies ofactivation, as proposed by Juarez et al. (1997). As the speed of the endothermic reactions depends on the mechanism ofheat <strong>and</strong> momentum transfer between the two phases <strong>and</strong> with the riser wall, the transport of particles by the gas neededinvestigation. Theologos <strong>and</strong> Markatos (1993) developed a mathematical model of the flow within the riser using theWeekam’s (1970) three lump kinetic model, with emphasis on the analysis of the two-phase flow. A previous onedimensionalanalysis of an air-solid flow is made to validate the empirical correlations used <strong>for</strong> drag <strong>for</strong>ce <strong>and</strong> frictionwith the wall. Ding <strong>and</strong> Gidaspow (1990) <strong>and</strong> Tsuo <strong>and</strong> Gidaspow (1990) considered models of gas-solid flow based onthe Navier-Stokes equation. They showed velocity fields throughout fluidized beds. Kunii <strong>and</strong> Levenspiel (1997)presented fluidization models <strong>and</strong> analyzed the <strong>for</strong>mation of beds <strong>and</strong> the behavior of solid particles in pneumatictransport. Their works had great importance on the determination of void fraction. Haider <strong>and</strong> Levenspiel (1988)presented relations <strong>for</strong> the drag coefficients, which are dependent on the sphericity of particles. Martignoni (2000)developed a 1-D model <strong>for</strong> a FCC riser, using a four lump (gasoil, gasoline, fuel gas, coke) <strong>and</strong> six lump (LCO,gasoline, GLP, coke, gasoil <strong>and</strong> fuel gas) approach. In this model, an analysis of the flow is made taking into accountthe friction with the internal walls, the drag <strong>for</strong>ce <strong>and</strong> the heat transfer mechanisms.The current work presents a mathematical model of the gas-solid flow that occurs in FCC risers. For the sake ofsimplicity, considering the model is to be applied to control systems, the flow is assumed as one-dimensional <strong>and</strong> themomentum <strong>and</strong> energy conservation equations are employed to represent the two-phase flow (gas <strong>and</strong> solid) <strong>and</strong> theheat transfer between the phases. Four lumps are considered in the kinetic of the reaction.2. Mathematical ModelingDuring the catalytic cracking, conversions of the gas phase components <strong>and</strong> changes of mass <strong>and</strong> heat between thesolid <strong>and</strong> gas phases take place. Figure (1) illustrates the control volume where the exchanges of energy <strong>and</strong> mass
etween the phases occur. The contact between the catalyst <strong>and</strong> gasoil provides its instantaneous vaporization. Thishypothesis was made by Ali <strong>and</strong> Rohani (1997) since vaporization happens in only 3% of the residence time. The drag<strong>for</strong>ce <strong>and</strong> the friction <strong>for</strong>ces between the phases <strong>and</strong> the wall are also included. According to Lansarin (1997), thevariation of the specific mass of the solid phase is not significant, even having coke deposition on the catalyst surface.The specific mass of the gas phase varies with the composition, temperature <strong>and</strong> pressure. The majority of the reactionsin the riser is endothermic (Lee et al., 1989), <strong>and</strong> the residence time is in the order of few seconds in industrialinstallations. As this time is very small, the model is considered quasi-steady. In other word, any change in theboundary conditions will affect immediately all the riser variables.F gfHEATmsGASOUSPHASELUMPF DCOKESOLID PHASEzm gFsfFigure 3. Mass <strong>and</strong> energy interactions between the gas <strong>and</strong> solid phases.The one-dimensional momentum conservation equation, applied to the compressible gas flow, assumes the <strong>for</strong>m:2d( ρgεgvg) d(Pεg) 4τpjεg= − − ρggεg−dz dzdr− F εDg(1)<strong>and</strong> applied to the solid phase:d( ρcεcvdz2c) d(Pεc)= − − ρcgεdzc4τcjε−drc+ F (1 − εDg) , (2)where ε g <strong>and</strong> ε c are the void <strong>and</strong> solid fractions, respectively. z is the position, ρ c is the specific mass of the catalyst, ρ gis the specific mass of the gas phase, v c <strong>and</strong> v g are the velocities of the solid <strong>and</strong> gas phases, respectively. P is thepressure <strong>and</strong> d r is the internal diameter of the riser. τ pg <strong>and</strong> τ pc are the gas-wall <strong>and</strong> solid-wall shear stress, respectively(Han <strong>and</strong> Chung, 2000, Martignoni, 2000 <strong>and</strong> Yang, 1978). Those are represented by:1 2τpi= fpiεivi, (3)2where f pi is the friction factor <strong>for</strong> the i phase. The index i indicates the gas (g) or the solid (c) phase. In case of gasphase, the friction factor <strong>for</strong> Reynolds numbers between 2,100 <strong>and</strong> 100,000 is:0.0791fpg= (4)0.25Re<strong>and</strong> <strong>for</strong> Reynolds greater than 100,000, it is:f−0.237pg0.0008 + 0.0552 Re g= . (5)For the solid phase:0.051fpc= . (6)vcF D represents the drag <strong>for</strong>ce, defined by Theologos <strong>and</strong> Markatos (1993) <strong>and</strong> by Tsuo <strong>and</strong> Gidaspow (1990) as:
FDc-2.65gε= ρgεcCD| vg- vc| (vg- vc) ρc, (7)ϕ(ρ - ρ )dgpwhere Re is the Reynods number <strong>and</strong> ϕ is the particle sphericity. The model assumes the particle is perfectly spheric(ϕ=1). The drag coefficient C D was defined by Haider <strong>and</strong> Levenspiel (1989) as-5.0748ϕ-4.0655 ϕ 0.0964+0.5565 ϕ 73.69 Re e[ 1+(8.1716e ) Re ] +ϕ24CD= . (8)6.2122ReRe + 5.378 eThe gas phase temperature is determined by the heat transfer between the solid <strong>and</strong> gas phases:dTdzgAr= [hcAe(Tc− Tg) + ρcεcQR] , (9)m cpggwhere A r <strong>and</strong> A e are the cross-sectional area of the riser <strong>and</strong> the efective superficial area of the catalyst, respectively.mgis the mass flow of the gas phase, Tg <strong>and</strong> T c are the gas <strong>and</strong> solid phase temperatures, respectively. c pg is thespecific heat of the gas phase. h c is the convective heat transfer coefficient, defined by Kunii <strong>and</strong> Levenspiel (1997) as:hk| v- v | ρ εg g c g gc= 0.03 6, (10)3d µPgwhere k g is the thermal conductivity of gas phase defined by API (American Petroleum Institute) technical data book(Techincal Data Committee,1988), cited in Han e Chung (1990):2[ 1.9469 - 0.374 M + 0.00148M]k +−6g= 10WgWg0.1028Tg, (11)where M Wg is the average molecular mass of the gas phase, calculated as a function of the composition (y i ) <strong>and</strong> theaverage molecular mass of each lump (M i ),1yMWg=(12)i∑MiQ R is the heat of <strong>for</strong>mation of the gas phase components, <strong>and</strong> consists in the source term of the equation (Han <strong>and</strong>Chung, 2000):Q222[ H12k12ygo+ ∆H13k13ygo+ ∆H14k14ygo+ ∆H23k 23y gl+ ∆H24k 24y gl] φ cR= -.∆ . (13)This term represents the energy absorbed by the gas phase to make possible the cracking endothermic reactions.The heaviest molecules of gasoil are broken producing smaller molecules such as gasoline, fuel gas <strong>and</strong> coke, asillustrated by Fig. (4). The ∆H jk are the enthalpy of each reaction <strong>and</strong> can be seen in the Table 1.Table 1 Kinetic parameters of cracking reactions (Han,I.-S. <strong>and</strong> C.-B. Chung, 2001).Four-lump cracking reaction Frequency factor (s - 1) Activation energy (kJ/kmol) <strong>Heat</strong> of reaction (kJ/kg)Gas oil to gasoline 1457.50 57359 195Gas oil to C 1 -C 4 gases 127.59 52754 670Gas oil to coke 1.98 31820 745Gasoline to C 1 -C 4 gases 256.81 65733 530Gasoline to coke 6.29 x 10 - 466570 690The gasoline lump produces molecules of fuel gas <strong>and</strong> coke. As the fuel gas conversion to coke is smal, the modeldoes not consider this trans<strong>for</strong>mation. The ∆Hs are related to the enthalpies of the reaction of each component. y go <strong>and</strong>y gl are the gasoil <strong>and</strong> gasoline fractions of the gas phase. These terms are evaluated by the gas phase composition alongthe riser. The composition is defined by the conservation of species applied to an infinitesimal control volume:
dyidzρgεgAr= R φmgi c(14)where φ c is the catalyst deactivation, defined as:K121 - GASOIL 2 - GASOLINEK14K13K24K234 - FUEL GAS3 - COKEFigure 4-The kinetic of the gas phase.[ ]φ = , (15)ce α cw cqwhere α c is the deactivation coefficient that depends on the gas phase temperature:cE( − 0 )Tgc0e Rα = α(16)<strong>and</strong> w cq is the coke fraction on the catalyst. α c0 (=1,1x10 -5 ) <strong>and</strong> E 0 (=49,000 kJ/kmol) are constant values. R i is theproduction rate of each lump:nRi= ∑ kjkyi, (17)where n = 2 <strong>for</strong> second order reactions (conversion of gasoil in gasoline, combustible gas <strong>and</strong> coke) <strong>and</strong> n = 1 <strong>for</strong> firstorder reactions (conversion of gasoline in fuel gas <strong>and</strong> coke) <strong>and</strong> k jk are the kinetic constants evaluated by the Arrheniusequation:kjkE jk( − )RTg0e= k , (18)where k 0 is the pre-exponential factor (frequency factor. See Table 1), R is the universal constant of the ideal gases <strong>and</strong>E jk , the activation energy of the reaction. The cracking of the heavier molecules are considered second order reactions<strong>and</strong> the others, first order ones. E jk is the activation energy <strong>for</strong> each reaction <strong>and</strong> can be found in Table 1.The source term excepted, the energy conservation equation of the solid phase is similar to the gas phase one:dTcdzArhcAe= (Tg− Tc) , (19)m cpccwhere T c is the temperature, c pc is the specific heat of the catalyst (considered constant),Ae, the heat exchange effective area of the solid phase.The solid fraction is evaluated by the mass flow definition:m cis the catalyst flow rate <strong>and</strong>εcmc=ρ v Accr, (20)<strong>and</strong> the void fraction is calculated by:εg= 1−ε c. (21)The gas specific mass is computed by the ideal gas equation:
PMw gρg= . (22)RTgThe mass flow rate through the catalyst feeding valve, which is located at the riser base, is evaluated by = K ∆P, (23)m cwhere K is the valve constant <strong>and</strong> ∆P is the difference of pressure through the valve.3. Method of SolutionThe above differential equations are discretized by the finite volume method. The set of algebraic equations issolved sequentially from bottom to top of the riser. Within each finite volume, interation takes place until theconservation of mass <strong>and</strong> momentum are satisfied. For flows with small variations of specific mass, significant changesin pressure, during iteration, may cause instabilities. Instead, a SIMPLE (Patankar, 1980) like algorithm is employed tocontrol the pressure correction along the riser.As the equations are implicitly solved, the algorithm of solution corrects the pressure at the riser inlet if the outletpressure does not coincide with the boundary condition (the pressure) at that point. As the inlet pressure is corrected, anew catalyst flow is calculated <strong>and</strong> the solution process is repeated. Convergence is reached as soon as the pressurecalculated at the outlet is equal to the pressure boundary condition. The gasoil flow is kept constant during thesimulation.4. ResultsThe geometric data <strong>and</strong> operation conditions of SIX’s # FCC pilot plant was employed as a test case in the currentwork.As the catalyst supply energy to the reactions, there is a vaporization of the feedstock, its specific mass reduces <strong>and</strong>consequently the gas increses its speed. There<strong>for</strong>e, the gas drags the solid phase along the riser. Figures (4) to (9) showthe changes of the variables along the riser. As illustrated by Fig. (4), the temperature difference between phasesassumes its largest value at the riser inlet <strong>and</strong> the highest heat transfer to the gas phase takes place. From this point on,the temperatures approximate to each other; the catalyst temperature reduces <strong>and</strong> the gas phase temperature increases(The riser is 18m long but the temperatures are shown along only 2m in order to emphasize the variations near theinlet). Figure (5) show, as expected, the reduction of gasoil fraction as the other three lump fractions increase. Thechange of composition is a function of the endothermic cracking reactions. As the riser is considered adiabatic, thetemperatures fall as a consequence of the endothermic reactions. As soon as the reactions begin, the average molecularmass of the gas phase decreases, as shown by Fig. (6).8401.00830Temperature [K]820810800790Gas phaseSolid phaseLump fractions [-]0.800.600.40GasoilGasolineFule gasCoke0.207807700.000.0 0.2 0.4 0.6 0.8 1.0 1.2 1.4 1.6 1.8 2.00 2 4 6 8 10 12 14 16 18Length [m]Length [m]Figure 4. Temperatures of the gas <strong>and</strong> solid phasesalong the riser.Figure 5. Fraction of lumps along the riser.# Petrobras Refinery located in São Mateus do Sul, Paraná, Brazil.
As the gas accelerates, it drags the catalyst to the top of the riser. One can note in Fig. (7) the gas <strong>and</strong> catalystspeeds increase faster near the riser inlet. This is a consequence of the highest gradient of the gas specific mass whichvaries with the temperature <strong>and</strong> molecular mass of the gas phase. Because of the difference of speeds <strong>and</strong> change of thegas specific mass, the void fraction increases along the riser (Fig. (8)). Figure (9) shows the variation of pressure alongthe riser. As can be seen, the pressure change is almost linear along the riser. This means the acceleration of the flow(Figure 7) is not sufficient to produce a significant pressure drop.The effect of the inlet catalyst temperature on the component fractions, conversion rate <strong>and</strong> residence time was alsoinvestigated. Table (2) shows the results as a function of the catalyst/gasoil (C/G) ratio <strong>for</strong> two inlet catalyst temperature(950 <strong>and</strong> 970K). As C/G ratio rises, the available catalyst surface increases <strong>and</strong> this auguments the gasoline production(y gl ). Although there is a reduction in the coke fraction the flow rate of coke ( mck) increases.1408Molecular weight [kg/kmol]130120110100Speed [m/s]642Gas phaseSolid phase900 2 4 6 8 10 12 14 16 18Length [m]00 2 4 6 8 10 12 14 16 18Length [m]Figure 6. Molecular mass of the gas phase alongthe riser.Figure 7. Speeds of the gas <strong>and</strong> solid phases alongthe riser.0.9751660000.972165000Void Fraction[-]0.9690.9660.963<strong>Pressure</strong> [Pa]1640001630001620000.9601610000 2 4 6 8 10 12 14 16 180 2 4 6 8 10 12 14 16 18Length [m]Length [m]Figure 8. Void fraction along the the riser.Figure 9. <strong>Pressure</strong> along the riser.
Table 2. Effect of the catalyst/gasoil ratio <strong>and</strong> inlet catalyst temperature on riser parameters.C/G y gl T c,out Conversion w ck t[kg/kg] [K] [%] [kg/kg] [kg/s] [s]950K 970K [%} 950K 970K [K] 950K 970K [%} 950K 970K [%} 950K 970K 950K 970K [s]2 0.120 0.13 6.27 638.0 642.4 4.4 13.2 14.0 6.27 0.0238 0.0239 0.68 0.00119 0.00120 5.6 4.8 -0.42.8 0.154 0.16 5.96 658.1 663.1 4.9 17.0 18.0 5.96 0.0175 0.0176 0.48 0.00123 0.00124 5.6 4.8 -0.33.6 0.180 0.19 5.73 673.0 678.4 5.4 19.9 21.0 5.73 0.0139 0.0140 0.33 0.00126 0.00126 4.9 4.4 -0.34.4 0.201 0.21 5.55 684.7 690.6 5.9 22.1 23.4 5.55 0.0115 0.0116 0.21 0.00127 0.00127 4.5 4.1 -0.35.2 0.218 0.23 5.40 694.3 700.5 6.2 24.0 25.3 5.40 0.0099 0.0099 0.11 0.00129 0.00129 4.2 4.0 -0.36 0.235 0.25 5.26 701.6 708.1 6.5 25.8 27.2 5.26 0.0087 0.0087 0.03 0.00131 0.00131 3.8 3.7 -0.26.8 0.243 0.26 5.22 709.5 716.4 6.9 26.7 28.1 5.22 0.0077 0.0077 -0.01 0.00131 0.00131 3.7 3.5 -0.27.6 0.253 0.27 5.08 715.7 722.8 7.2 27.9 29.3 5.08 0.0069 0.0069 -0.10 0.00132 0.00132 3.5 3.4 -0.28.4 0.262 0.28 5.04 721.2 728.6 7.4 28.8 30.3 5.04 0.0063 0.0063 -0.13 0.00133 0.00132 3.5 3.3 -0.2m ckAn increase of 20K in the catalyst inlet temperature provides an average increase of 5.5 % in the conversion ratio.There<strong>for</strong>e, this variable is very important to control the conversion. As the available energy is higher at 970 K, theresidence time (t) is reduced. This is a consequence of a higher variation of the gas specific mass which causes a fasterflow. Figure (10) illustrates the conversion rate variation as a function of the catalyst/gasoil ratio <strong>for</strong> both temperatures.In addition, the effect of a 10% reduction in coke fraction of gasoil (Y cc - Conradson carbon which is the coke thatis already in the feedstock <strong>and</strong> is not a result of the cracking process. This coke is assumed to be deposited on thecatalyst surface immediately after vaporization (Santos, 2000)) was analysed. As can be seen in Tab. (3), the lesser theimpurities the higher the increase of the convertion rate. With a lesser amount of coke in the catalyst, the efficiency ofthe endothermic cracking reactions increases, providing a higher catalyst temperature decrease at the riser outlet. Thecoke fraction (w cq ) diminishes <strong>and</strong> the residence time almost do not change.3228Conversion [%]2420950 K970 K16122 3 4 5 6 7 8 9Length [m]Figure 10. Conversion rate as a function Catalyst/Gasoil ratio <strong>for</strong> two inlet catalyst temperatures.Table 3. Effect of the catalyst/Gasoil ratio <strong>and</strong> the feedstock coke on riser parameters.C/G y gl T c,out Conversion w cq t[kg/kg] [K] [%] [kg/kg] [s]Y cc Y cc Y cc Y cc Y cc0.028 0.0252 [%} 0.028 0.025 [K] 0.028 0.025 [%} 0.028 0.025 [%} 0.028 0.025 [s]2 0.1199 0.1203 0.38 638.0 637.9 -0.1 13.2 13.2 0.38 0.024 0.022 -5.77 5.6 4.8 -0.82.8 0.1542 0.1547 0.31 658.1 658.0 -0.1 17.0 17.0 0.31 0.018 0.017 -5.58 5.6 4.8 -0.83.6 0.1805 0.1810 0.28 673.0 672.8 -0.2 19.9 19.9 0.28 0.014 0.013 -5.47 4.9 4.4 -0.54.4 0.2012 0.2017 0.27 684.7 684.5 -0.2 22.1 22.2 0.27 0.012 0.011 -5.39 4.5 4.1 -0.45.2 0.2180 0.2185 0.26 694.3 694.1 -0.2 24.0 24.0 0.26 0.010 0.009 -5.33 4.2 4.0 -0.26 0.2349 0.2355 0.25 701.6 701.3 -0.2 25.8 25.9 0.25 0.009 0.008 -5.24 3.8 3.7 -0.16.8 0.2431 0.2437 0.25 709.5 709.3 -0.3 26.7 26.8 0.25 0.008 0.007 -5.25 3.7 3.5 -0.27.6 0.2534 0.2540 0.25 715.7 715.4 -0.3 27.9 28.0 0.25 0.007 0.007 -5.21 3.5 3.4 -0.18.4 0.2619 0.2626 0.24 721.2 720.9 -0.3 28.8 28.9 0.24 0.006 0.006 -5.16 3.5 3.3 -0.2