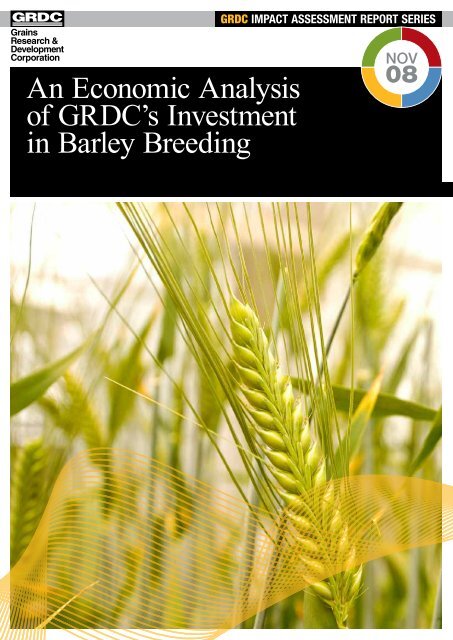
An Economic Analysis of GRDC's Investment in Barley Breeding
An Economic Analysis of GRDC's Investment in Barley Breeding
An Economic Analysis of GRDC's Investment in Barley Breeding
- No tags were found...
You also want an ePaper? Increase the reach of your titles
YUMPU automatically turns print PDFs into web optimized ePapers that Google loves.
SummaryThis report evaluates the impacts from 22 new barley varieties released over theperiod from 2002 to 2008. The new varieties were the ma<strong>in</strong> outputs from 12completed or ongo<strong>in</strong>g projects <strong>in</strong> all states that span vary<strong>in</strong>g durations between2001 and 2011. <strong>Investment</strong> by GRDC <strong>in</strong> the projects be<strong>in</strong>g funded over theperiod <strong>of</strong> the releases from 2002 to 2008 totalled $25.5 million.To correctly account for the cont<strong>in</strong>uous nature <strong>of</strong> a breed<strong>in</strong>g cycle <strong>of</strong> the order <strong>of</strong>a decade, the analysis <strong>in</strong>cluded an estimate <strong>of</strong> contributions from <strong>in</strong>vestmentsprior to 2002 and excluded contributions up to 2008 towards future outputsbeyond 2008. The analysis is therefore only <strong>of</strong> the additional <strong>in</strong>vestments thatcan be readily attributed to achiev<strong>in</strong>g the outputs over the period 2002 to 2008.The benefits from new varieties were estimated from data on current and forecastproduction by the time the varieties are expected to reach about their maximumadoption <strong>in</strong> 2013. The production data and yield estimates from National VarietyTrial data were used to estimate <strong>in</strong>creased production attributable to the newvarieties. The cumulative national yield <strong>in</strong>crease was estimated at 0.75 per centannually over the period to 2013. Further benefits out to the twenty five yearperiod <strong>of</strong> analysis were assumed constant. The assumption recognised that thevarieties be<strong>in</strong>g evaluated would be displaced eventually. However the benefitsare ma<strong>in</strong>ta<strong>in</strong>ed because they provide the basis for further ga<strong>in</strong>s.The evaluation us<strong>in</strong>g the best available estimates <strong>of</strong> benefits suggested the total<strong>in</strong>vestment by GRDC <strong>in</strong> barley breed<strong>in</strong>g is giv<strong>in</strong>g high returns. The benefit costratio tak<strong>in</strong>g <strong>in</strong>to account <strong>in</strong>vestments over the breed<strong>in</strong>g cycle is <strong>of</strong> the order <strong>of</strong>eight to one.The rapid <strong>in</strong>crease <strong>in</strong> production from varieties released early <strong>in</strong> the period <strong>of</strong>evaluation was the ma<strong>in</strong> feature <strong>of</strong> the evaluation. A recent outstand<strong>in</strong>g newvariety H<strong>in</strong>dmarsh appears to be widely adapted and is expected to contributeabout one fifth <strong>of</strong> the national crop by 2013. The <strong>in</strong>vestment appears pr<strong>of</strong>itablebecause adoption <strong>of</strong> new varieties has been rapid to date, and is sufficient toensure the <strong>in</strong>vestment is already close to pr<strong>of</strong>itable. The only qualification to thatconclusion is the yield estimates are based on NVT data. There was littleevidence to support the extent to which trial data on per cent yield <strong>in</strong>creases istransferable to farm level.The <strong>in</strong>vestment was evaluated aga<strong>in</strong>st a base <strong>of</strong> what could have been expectedto eventuate if GRDC had not <strong>in</strong>vested. When GRDC made the decision to <strong>in</strong>vest<strong>in</strong> 2002, the likelihood <strong>of</strong> alternative private sector arrangements evolv<strong>in</strong>g wouldhave been m<strong>in</strong>imal. S<strong>in</strong>ce then varieties with End Po<strong>in</strong>t Royalties are an<strong>in</strong>creas<strong>in</strong>g proportion <strong>of</strong> the crop. A sensitivity analysis showed that thepr<strong>of</strong>itability <strong>of</strong> future GRDC <strong>in</strong>vestments will be determ<strong>in</strong>ed by updatedassumptions on new breed<strong>in</strong>g arrangements and how successful they are likely tobe.The breed<strong>in</strong>g program was rationalised to a three-node model <strong>in</strong> 2006. Theresults <strong>of</strong> this evaluation are more <strong>in</strong>dicative <strong>of</strong> a successful pre-rationalisationmodel. They therefore provide a challeng<strong>in</strong>g benchmark for the new model.- 3 -
1 IntroductionThis report evaluates the impact <strong>of</strong> <strong>in</strong>vestments by GRDC <strong>in</strong> twelve GRDCprojects <strong>in</strong> barley breed<strong>in</strong>g. The projects have vary<strong>in</strong>g duration spann<strong>in</strong>g parts <strong>of</strong>the period from 2002 to 2011. <strong>Investment</strong> <strong>in</strong> the twelve projects from 2002 to2008 totalled $25.5m. Outputs up to mid-2008 are <strong>in</strong>cluded <strong>in</strong> the evaluation.<strong>Barley</strong> is grown for malt for brew<strong>in</strong>g and as a feedgra<strong>in</strong>. Gra<strong>in</strong> meet<strong>in</strong>g malt<strong>in</strong>gspecifications can attract a price premium. Although most barley grown is from amalt<strong>in</strong>g variety potentially suitable for beer production, the major end use hasbeen for livestock feed. At the beg<strong>in</strong>n<strong>in</strong>g <strong>of</strong> the period <strong>of</strong> analysis there wereprojects <strong>in</strong> each <strong>of</strong> the six states. They were produc<strong>in</strong>g a range <strong>of</strong> varieties withvary<strong>in</strong>g levels <strong>of</strong> adaptation to ma<strong>in</strong>ly regional environments. There werenational and regional anomalies and gaps <strong>in</strong> meet<strong>in</strong>g the market. For examplebreed<strong>in</strong>g programs were geared to the domestic malt market based on flat beerdemand. Export malt was an important market <strong>in</strong> Western Australia but therewere deficiencies <strong>in</strong> varieties tailored to that market. In South Australia feedbarley varieties were more important than the distance from the major easternAustralian feedgra<strong>in</strong> markets appeared to warrant. In contrast <strong>in</strong> the north the<strong>in</strong>dustry rema<strong>in</strong>ed malt<strong>in</strong>g-focussed as demand shifted rapidly to feed gra<strong>in</strong>s(Hafi and Connell 2003) and production decl<strong>in</strong>ed as drought frequency <strong>in</strong>creased.Wheat is the major feedgra<strong>in</strong> but not a preference for some end users. Foreastern Australia the feedgra<strong>in</strong> export trade dom<strong>in</strong>ated by wheat is <strong>in</strong>creas<strong>in</strong>gly aresidual one. In 2002 the portfolio <strong>of</strong> barley varieties clearly had some outmodedsuitabilities for likely end uses <strong>in</strong> rapidly evolv<strong>in</strong>g domestic and export markets.The <strong>in</strong>dustry <strong>in</strong>clud<strong>in</strong>g its components needed to adjust.A major rationalisation <strong>of</strong> breed<strong>in</strong>g activities began <strong>in</strong> 2006 when <strong>Barley</strong> Breed<strong>in</strong>gAustralia (BBA) formally commenced operations (BBA Advisory Board 2007). BBAfollowed the earlier formation <strong>of</strong> the <strong>in</strong>dustry body, <strong>Barley</strong> Australia to <strong>in</strong>creasecoord<strong>in</strong>ation activities <strong>of</strong> malsters and marketers. The BBA national plan forbreed<strong>in</strong>g improved varieties to benefit the barley <strong>in</strong>dustry uses a node <strong>in</strong> eachGRDC region to replace the previous state-based system. The plan was based onan earlier study by Fellowes (2005). <strong>Barley</strong> Australia has a key role to controlnational varietal accreditation. The plan also <strong>in</strong>corporated measures tostrengthen l<strong>in</strong>ks with the major GRDC research effort <strong>in</strong> pre-breed<strong>in</strong>g.Over a decade ago barley improvement programs began to take advantage <strong>of</strong> arange <strong>of</strong> new technologies such as molecular markers, double haploid production,and NIR quality evaluation to <strong>in</strong>crease efficiency <strong>in</strong> select<strong>in</strong>g new varieties.Molecular markers for example can <strong>in</strong>dicate presence <strong>of</strong> genes that help conferdisease resistance or improved malt<strong>in</strong>g quality. Selection <strong>in</strong> the laboratory cannow be done more quickly and more cheaply.On Australian gra<strong>in</strong> farms, barley has traditionally been the second mostimportant gra<strong>in</strong> crop after wheat. <strong>Barley</strong> is grown <strong>in</strong> all states <strong>in</strong>clud<strong>in</strong>g <strong>in</strong>northern Tasmania. South Australia and <strong>in</strong>creas<strong>in</strong>gly Western Australia are themajor producers. From a farmer perspective, barley can have a range <strong>of</strong>advantages; for example it has the reputation <strong>of</strong> be<strong>in</strong>g a tough crop moretolerant <strong>of</strong> a poor season or a poor paddock. <strong>Barley</strong> varieties <strong>of</strong>fer <strong>in</strong>creasedchoices and the opportunities to better manage some <strong>of</strong> the likely risks fromfrost, diseases or moisture stress. The chance <strong>of</strong> attract<strong>in</strong>g a premium formalt<strong>in</strong>g quality is another factor advantageous to farmers grow<strong>in</strong>g barley <strong>in</strong> someless risky environments. However, malsters prefer uniform quality and thatobjective can conflict with an objective <strong>of</strong> breed<strong>in</strong>g varieties adaptable to a widerange <strong>of</strong> sites, seasons and end uses.- 4 -
Table 1 summarises the four major markets for Australian barley. Australia is asignificant exporter account<strong>in</strong>g for around a quarter <strong>of</strong> world trade <strong>in</strong> some years.The data are based on an average season. There were two years <strong>in</strong> the pastdecade when, as a result <strong>of</strong> widespread drought, production was less than halfthat <strong>of</strong> the previous year and higher proportions went to domestic users.Table 1 <strong>Barley</strong> production by dest<strong>in</strong>ation and end use (% <strong>of</strong> total)MarketMalt<strong>in</strong>g<strong>Barley</strong>Feed<strong>Barley</strong>TotalDomestic 13 30 43Export 25 32 57Total 38 62 100Source: www.barleyaustralia.com.au (based on an average production <strong>of</strong>about 6.6 Mt. over 2005/06 to 2007/08.)Some key features <strong>of</strong> the Australian barley <strong>in</strong>dustry are:• The domestic market for livestock feed has traditionally been a residualmarket for malt<strong>in</strong>g barley varieties that do not meet malt<strong>in</strong>g specifications.• Domestic demand for varieties more tailored to feedgra<strong>in</strong> markets has beenrapidly <strong>in</strong>creas<strong>in</strong>g.• The northern breed<strong>in</strong>g program has recently shifted priority from breed<strong>in</strong>gtargeted at malt<strong>in</strong>g requirements to breed<strong>in</strong>g more for the feedgra<strong>in</strong> market.• The feedgra<strong>in</strong> market is not yet sophisticated <strong>in</strong> terms <strong>of</strong> quality.• The export markets for malt<strong>in</strong>g barley are expand<strong>in</strong>g particularly <strong>in</strong> Asia.• It is notable that the average Australian malt<strong>in</strong>g selection rate is the highest<strong>of</strong> the world’s export<strong>in</strong>g nations with around 38 per cent <strong>of</strong> our national cropselected as malt (www.barleyaustralia.com.au ).• Markets for malt are diverse <strong>in</strong> terms <strong>of</strong> quality.• Some Asian markets have different brew<strong>in</strong>g processes compared with thosefor Australian beers - they require different malt<strong>in</strong>g varieties, and• Export malt <strong>in</strong>cludes about one-third <strong>in</strong> gra<strong>in</strong> equivalent terms <strong>of</strong> barleyexported as malt.This report identifies outcomes to estimate impacts from barley breed<strong>in</strong>g from aneconomic, social and environmental perspective. The outputs <strong>of</strong> the researchprojects <strong>in</strong> the form <strong>of</strong> improved barley varieties lead to specific outcomes viavarious pathways to adoption. The economic evaluation was based on the actualperformance <strong>of</strong> varieties released over the period from 2002 to 2008 and onestimates <strong>of</strong> their future performance. A cost benefit framework is utilised thattakes <strong>in</strong>to account the breed<strong>in</strong>g cycle. Base case, optimistic, and pessimisticscenarios are proposed to take account <strong>of</strong> uncerta<strong>in</strong>ties, particularly what mighthave eventuated had GRDC not <strong>in</strong>vested <strong>in</strong> barley breed<strong>in</strong>g. The analysis takes<strong>in</strong>to account the long term nature <strong>of</strong> the breed<strong>in</strong>g cycle, <strong>of</strong> the order <strong>of</strong> a decadefrom when crosses are made to the release <strong>of</strong> a new variety. The conclusions andlessons learnt from the cost benefit analysis are then developed.- 5 -
2 Project <strong>Investment</strong>The projects contribute to the general GRDC objective for Output Group1 –Varieties <strong>of</strong> ‘Provid<strong>in</strong>g growers with access to new superior varieties by activelydevelop<strong>in</strong>g world-lead<strong>in</strong>g, cost-efficient breed<strong>in</strong>g programs <strong>in</strong> Australia’.The GRDC <strong>in</strong>vestment <strong>in</strong>cludes twelve projects cover<strong>in</strong>g barley breed<strong>in</strong>g activities<strong>in</strong> six states. The projects are listed <strong>in</strong> Table 2. The complete duration <strong>of</strong> theprojects is <strong>in</strong>cluded. However this evaluation <strong>in</strong>cludes only outputs that werereleased or <strong>in</strong> tra<strong>in</strong> for release by 30 June 2008. To account for the cont<strong>in</strong>uousnature <strong>of</strong> the breed<strong>in</strong>g cycle <strong>of</strong> the order <strong>of</strong> a decade, the analysis <strong>in</strong>cluded anestimate <strong>of</strong> attributions from <strong>in</strong>vestments prior to 2002 and excluded attributionsup to 2008 towards future outputs beyond 2008. Details <strong>of</strong> how <strong>in</strong>vestment costswere attributed to outputs will be presented <strong>in</strong> Section 7.Table 2: <strong>Barley</strong> improvement projects funded by GRDC 2002-2011TitleProjectCodeDuration<strong>Barley</strong> Improvement and QualityProgram for South EasternAustralia<strong>Barley</strong> Breed<strong>in</strong>g Australia –NSWDPI<strong>Barley</strong> Improvement for theGRDC Northern Region<strong>Barley</strong> Breed<strong>in</strong>g Australia -Northern Node<strong>Barley</strong> Improvement and IndustryDevelopment – VIDANational <strong>Barley</strong> EnhancementProgram coord<strong>in</strong>ator<strong>Barley</strong> cultivar development DPIHorsham<strong>Barley</strong> Improvement and IndustryDevelopment for the WesternRegion<strong>Barley</strong> Improvement and IndustryDevelopment for the WesternRegion<strong>Barley</strong> Breed<strong>in</strong>g Australia :Western RegionDAN00055 1/7/2003 to 30/6/2006DAN00101 1/7/2006 to 30/6/2011DAQ00038 1/7/2002 to 30/6/2005DAQ00110 1/7/2006 to 30/6/2011DAV00025 1/7/2002 to 30/6/2005DAV00079 1/7/2006 to 30/6/2008DAV00080 1/7/2006 to 30/6/2009DAW00045 1/7/2002 to 30/6/2005DAW00119 01/07/2005 to 30/6/2006DAW00151 17/2006 to 30/6/2011<strong>Barley</strong> Improvement and <strong>in</strong>dustrydevelopmentUA00032Phase 1:1/7/2002 to30/6/2006Phase 2: 1/7/2006 to- 6 -
30/6/2011Australia Ch<strong>in</strong>a Collaboration on<strong>Barley</strong> Genetic Resources andDevelopment <strong>of</strong> New <strong>Barley</strong>Varieties for High Ra<strong>in</strong>fall AreasUT8 1/7/2001 to 30/6/2007Source: GRDC Project ProposalsThe <strong>in</strong>vestments listed <strong>in</strong> this section are all for the seven year period from2001/02 to 2007/08 although some projects extend to 2011. It should be notedthat the approach adopted <strong>of</strong> attribut<strong>in</strong>g outputs over a period to the relevant<strong>in</strong>vestments <strong>in</strong> the prior breed<strong>in</strong>g cycle still results <strong>in</strong> total costs equivalent toseven years <strong>of</strong> <strong>in</strong>vestment if the rate <strong>of</strong> <strong>in</strong>vestment is constant.The <strong>in</strong>vestments <strong>in</strong> the projects for the period from 2001/02 to 2007/08 are listedby projects <strong>in</strong> Table 3.Table 3: Project Expenditure over the seven years to 30 June 2008 ($)ProjectProject Expenditure(years to 30 June)HostOrganisationsGRDCTotalDAN00055 2,024,762 657,364 2,682,126DAN00101 449,030 339,456 788,486DAQ00038 5,808,650 3,804,161 9,612,811DAQ00110 2,754,100 2,679,541 5,433,641DAV00025 1,345,586 1,900,366 3,245,952DAV00079 26,354 92,541 118,895DAV00080 542,954 766,812 1,309,766DAW00045 9,167,035 3,666,814 12,833,849DAW00119 3,803,106 1,356,838 5,159,944DAW00151 6,175,404 2,667,430 8,842,834UA00032 9,719,790 6,384,335 16,104,125UT8 749,164 1,204,510 1,953,674Total 42,565,935 25,520,168 68,086,103Source: GRDC Project Proposals.Overall for the twelve projects funded over the seven year period GRDC hascontributed 37.5 per cent <strong>of</strong> resources <strong>in</strong> nom<strong>in</strong>al terms with the rema<strong>in</strong><strong>in</strong>gsupport provided by the host organisations. Total <strong>in</strong>vestment came to$68.1million with the GRDC contribution amount<strong>in</strong>g to approximately $25.5million.Estimates <strong>of</strong> the fund<strong>in</strong>g by year <strong>in</strong> nom<strong>in</strong>al dollar terms and by source for theprojects as listed <strong>in</strong> Table 3 are shown <strong>in</strong> Table 4.- 7 -
Table 4: <strong>An</strong>nual expenditure for the projects, 2001/02 to 2007/08Year to 30JuneHostOrganisationsGRDCTotal2002 156,000 193,358 349,3582003 6,901,545 4,124,542 11,026,0872004 6,376,122 3,412,185 9,788,3072005 6,782,085 3,870,694 10,652,7792006 7,255,535 4,539,534 11,795,0692007 7,372,187 4,501,721 11,873,9082008 7,722,461 4,878,134 12,600,595Total 42,565,935 25,520,168 68,086,103Source: GRDC Project Proposals.As shown <strong>in</strong> Table 4, the expenditure <strong>in</strong> 2001/02 was m<strong>in</strong>or compared to otheryears. The Tasmanian project, UT8 was the only project that started <strong>in</strong> 2001/02.Given the desirability <strong>of</strong> <strong>in</strong>clud<strong>in</strong>g a full portfolio <strong>of</strong> breed<strong>in</strong>g projects from allStates, it was necessary to start the period <strong>of</strong> analysis <strong>in</strong> 2001/02. But aspreviously discussed, the <strong>in</strong>vestment analysis will not be biased by the atypicalexpenditure <strong>in</strong> 2001/02 because it is based on the total GRDC expenditure overthe breed<strong>in</strong>g cycle that can be attributed to outputs from 2002 to 2008.3 Project OutputsThe projects <strong>in</strong>clude some funded under the previous model <strong>of</strong> breed<strong>in</strong>g activity<strong>in</strong> six states and the more recent projects as a part <strong>of</strong> the new national approachbased on three nodes. The recent projects <strong>in</strong>clude projects <strong>in</strong> Victoria and NewSouth Wales that contribute breed<strong>in</strong>g material to the nodes as their ma<strong>in</strong> output.This evaluation is <strong>of</strong> outputs achieved from mid 2001 to mid 2008.Outputs from the projects are:• technologies — new barley varieties with improved agronomic performance,with improved quality to meet requirements <strong>of</strong> domestic and export marketsfor feed and malt<strong>in</strong>g barley, together with <strong>in</strong>formation products to accelerateuptake by farmers and by <strong>in</strong>dustry, and• research capacity —breed<strong>in</strong>g stock <strong>in</strong>clud<strong>in</strong>g advanced breed<strong>in</strong>g l<strong>in</strong>es as abasis for future varieties, and a better <strong>in</strong>tegrated national program draw<strong>in</strong>g ona wider range <strong>of</strong> scientific knowledge and understand<strong>in</strong>g, and <strong>in</strong>creas<strong>in</strong>g theskills <strong>of</strong> researchers, farmers and <strong>in</strong>dustry.The new barley varieties have been extensively trialed and compared withexist<strong>in</strong>g varieties over a range <strong>of</strong> sites and seasons before they are released.Information packages on crop management and quality attributes on the newvarieties are also an output to guide extension and <strong>in</strong>dustry development. Priorto release varieties are further assessed for their suitability for the malt<strong>in</strong>g and- 8 -
ew<strong>in</strong>g <strong>in</strong>dustries. Some varieties are released <strong>in</strong>itially as feed varieties pend<strong>in</strong>gf<strong>in</strong>alisation <strong>of</strong> test<strong>in</strong>g and accreditation as either a feed or malt<strong>in</strong>g variety. Maltaccreditation is specified for a target market, either export or domestic brew<strong>in</strong>g.This evaluation <strong>of</strong> readily quantifiable benefits concentrates on the technologicaloutputs lead<strong>in</strong>g more directly to farmer outcomes. The benefits <strong>in</strong> terms <strong>of</strong>capacity build<strong>in</strong>g are not quantified <strong>in</strong> this analysis. They would be partlyreflected <strong>in</strong> the <strong>in</strong>crease to 2008 <strong>in</strong> the potential value <strong>of</strong> the breed<strong>in</strong>g programsadditional to the value at the start <strong>of</strong> the projects <strong>in</strong> 2001/02.The pr<strong>in</strong>cipal technological outputs from the <strong>in</strong>vestment made over the sevenyear period to 2008 are listed <strong>in</strong> Table 5.Table 5: Outputs achieved by the projects from 2002-2008Project Code, Title andDurationOutputs( <strong>in</strong>clud<strong>in</strong>g varieties released 2002-2008)DAN00055 <strong>Barley</strong>Improvement and QualityProgram for South EasternAustralia• Malt<strong>in</strong>g quality advanced l<strong>in</strong>es progressed up tocommercial malt<strong>in</strong>g stage.• Urambie, Cowabie, Tulla, B<strong>in</strong>along ( with QDPI).DAN00101 <strong>Barley</strong> Breed<strong>in</strong>gAustralia – NSWDPI• Genotypes scored for each <strong>of</strong> the three nodes forbarley scald.• Multienvironment evaluation <strong>of</strong> crossbreds.DAQ00038 <strong>Barley</strong>Improvement for the GRDCNorthern Region• Superior barley varieties and advanced breed<strong>in</strong>g l<strong>in</strong>escomb<strong>in</strong><strong>in</strong>g improved yield, feed and/or malt<strong>in</strong>gquality, multiple disease resistances and stability <strong>of</strong>production.• Extension to support decision mak<strong>in</strong>g and marketdevelopment.• Grout, Mackay.DAQ00110 <strong>Barley</strong> Breed<strong>in</strong>gAustralia - Northern Node• New barley varieties, advanced breed<strong>in</strong>g l<strong>in</strong>es andgermplasm with improved quality attributes, andtargeted to feed and malt markets.• NRB03470.DAV00025 <strong>Barley</strong>Improvement and IndustryDevelopment – VIDA• Development <strong>of</strong> germplasm with superior agronomicperformance and malt<strong>in</strong>g quality.• Extension <strong>of</strong> improved management practice formalt<strong>in</strong>g barley.• SloopVIC, Fitzroy, Buloke, H<strong>in</strong>dmarshDAV00079 National <strong>Barley</strong>Enhancement Programcoord<strong>in</strong>ator• A review <strong>of</strong> BBA barley breed<strong>in</strong>g and nationalgermplasm enhancement activities.• Coord<strong>in</strong>ation <strong>of</strong> germplasm and <strong>in</strong>formation flowbetween germplasm enhancement research groupsand BBA barley breed<strong>in</strong>g nodes.DAV00080 <strong>Barley</strong> cultivar • Provision <strong>of</strong> fixed breed<strong>in</strong>g l<strong>in</strong>es, with sufficient- 9 -
development DPI Horshamphenotypic description, to warrant <strong>in</strong>clusion <strong>in</strong> theBBA breed<strong>in</strong>g node S3 trials.• Provision <strong>of</strong> an <strong>in</strong>formation resource to the barley<strong>in</strong>dustry <strong>in</strong> southeastern Australia,DAW00045 <strong>Barley</strong>Improvement and IndustryDevelopment for the WesternRegion• Elite l<strong>in</strong>es with improved malt<strong>in</strong>g and agronomicqualities submitted for evaluation.• Extension <strong>of</strong> management advice.• Baud<strong>in</strong>, Hamel<strong>in</strong>.DAW00119 <strong>Barley</strong>Improvement and IndustryDevelopment for the WesternRegion• Malt<strong>in</strong>g barley l<strong>in</strong>es nom<strong>in</strong>ated from Stage 2.2 toproceed to wide scale test<strong>in</strong>g.• <strong>An</strong> agronomic research and extension program on theperformance <strong>of</strong> barley grow<strong>in</strong>g <strong>in</strong> Western Australiaand extension <strong>of</strong> this <strong>in</strong>formation to growers and<strong>in</strong>dustry.• Vlam<strong>in</strong>gh.DAW00151 <strong>Barley</strong> Breed<strong>in</strong>gAustralia : Western Region• <strong>Barley</strong> varieties, advanced breed<strong>in</strong>g l<strong>in</strong>es andgermplasm exhibit<strong>in</strong>g improved agronomicperformance, disease resistance, and abiotic stresstolerance and gra<strong>in</strong> quality attributes, and targeted tomalt and feed markets.• Roe, Lockyer, HannanUA00032 <strong>Barley</strong>Improvement and <strong>in</strong>dustrydevelopment• Malt<strong>in</strong>g barley varieties with high yield, improveddisease resistance, malt<strong>in</strong>g quality and improvedtolerance to abiotic stress.• Characterisation <strong>of</strong> breeders’ l<strong>in</strong>es, parents and<strong>in</strong>troductions and new varieties for malt<strong>in</strong>g andbrew<strong>in</strong>g quality.• SloopSA, Flagship, Fleet, CommanderUT8 Australia Ch<strong>in</strong>aCollaboration on <strong>Barley</strong>Genetic Resources andDevelopment <strong>of</strong> New <strong>Barley</strong>Varieties for High Ra<strong>in</strong>fallAreas• One new l<strong>in</strong>e superior to Frankl<strong>in</strong> and Gairdner forspr<strong>in</strong>g sow<strong>in</strong>g <strong>in</strong> Tasmania,• 100 varieties <strong>in</strong>troduced from Ch<strong>in</strong>a for use <strong>in</strong>Australian breed<strong>in</strong>g programs, <strong>in</strong>clud<strong>in</strong>g forwaterlogg<strong>in</strong>g and acid soil situations,• VertessSource: GRDC Project Proposals.4 Benefits4.1 <strong>Economic</strong>The major benefit is the extra pr<strong>of</strong>itability accru<strong>in</strong>g to gra<strong>in</strong> farmers from<strong>in</strong>creased productivity <strong>of</strong> gra<strong>in</strong> production. As shown <strong>in</strong> the previous section the<strong>in</strong>vestment has led to outputs <strong>in</strong> the form <strong>of</strong> 22 improved varieties and<strong>in</strong>formation on their management to foster widespread adoption. The majorimpact on productivity arises from higher yields from newer varieties comparedwith the varieties they displace.- 10 -
There are <strong>in</strong> addition other benefits, for example from improved diseaseresistance and from improvements <strong>in</strong> quality lead<strong>in</strong>g to more efficient malt<strong>in</strong>g andbrew<strong>in</strong>g. The program <strong>in</strong> the GRDC Northern Region has changed its priorityfrom breed<strong>in</strong>g malt<strong>in</strong>g varieties to breed<strong>in</strong>g feed varieties to meet <strong>in</strong>creas<strong>in</strong>gdemand. Benefits from changes <strong>in</strong> quality have not been evaluated.<strong>Barley</strong> has an important role <strong>in</strong> value add<strong>in</strong>g. The major domestic market is as afeed gra<strong>in</strong> for <strong>in</strong>tensive livestock feed<strong>in</strong>g. In some regions much <strong>of</strong> the gra<strong>in</strong> isconsumed on-farm or <strong>in</strong> the region. The domestic malt<strong>in</strong>g and brew<strong>in</strong>g <strong>in</strong>dustriesare now more closely <strong>in</strong>tegrated as part <strong>of</strong> a supply cha<strong>in</strong> with the barleybreed<strong>in</strong>g programs to ensure barley produced meets their specifications.<strong>Barley</strong> is an important crop agronomically <strong>in</strong> its role <strong>of</strong> a hardy crop <strong>of</strong>ten moretolerant <strong>of</strong> drought, frost, and disease. In rotations barley has a key role as abreak crop <strong>in</strong> areas <strong>of</strong> southern Australia where Cereal Cyst Nematode (CCN) is aproblem. A CCN benefit is <strong>in</strong>cluded <strong>in</strong> the analysis. <strong>Barley</strong> is a crop that hasadapted to a wide range <strong>of</strong> environments and is likely to have an important role<strong>in</strong> adaptations by the gra<strong>in</strong> <strong>in</strong>dustry to climate change.4.2 Social<strong>Barley</strong> is a significant and traditional part <strong>of</strong> the local economy <strong>in</strong> many Australiancommunities. By improv<strong>in</strong>g yields and ma<strong>in</strong>ta<strong>in</strong><strong>in</strong>g <strong>in</strong>dustry competitiveness, the<strong>in</strong>vestment leads to higher <strong>in</strong>comes, regional stability and thus improv<strong>in</strong>g socialwelfare. These benefits have not been evaluated.4.3 EnvironmentalAlthough there is no significant environmental outcome identified or quantifiedfrom these projects, there is a general environmental management benefit <strong>in</strong>ma<strong>in</strong>ta<strong>in</strong><strong>in</strong>g barley as a key contributor <strong>in</strong> rotations that underp<strong>in</strong> susta<strong>in</strong>ablefarm<strong>in</strong>g systems. <strong>Barley</strong> has a reputation as a highly adaptable crop. Comparedwith wheat, it is <strong>of</strong>ten more resistant to disease and it can be planted later.<strong>Barley</strong> can be used as a break crop to control disease <strong>in</strong> rotations. <strong>Barley</strong> cangive farmers more options for ma<strong>in</strong>ta<strong>in</strong><strong>in</strong>g an effective conservation cropp<strong>in</strong>gsystem with <strong>in</strong>creased ground cover. A further environmental benefit can arisefrom a reduced nitrogen fertiliser requirement. To avoid high prote<strong>in</strong> levels,barley grown for malt<strong>in</strong>g generally needs less nitrogen than wheat.5 National and Rural Research and DevelopmentPrioritiesThe major benefits from the project are the <strong>in</strong>creases <strong>in</strong> productivity <strong>of</strong> gra<strong>in</strong>production. There are <strong>in</strong> addition contributions to capacity build<strong>in</strong>g through abetter <strong>in</strong>tegrated and more national research program. Improved productivity is ahigh priority for Rural Research and Development as shown <strong>in</strong> Table 6.- 11 -
Table 6: National and Rural Research and Development PrioritiesNational Research PrioritiesRural Research and DevelopmentPriorities1. <strong>An</strong> Environmentally Susta<strong>in</strong>able 1. Productivity and Add<strong>in</strong>g ValueAustralia2. Promot<strong>in</strong>g and Ma<strong>in</strong>ta<strong>in</strong><strong>in</strong>g Good 2. Supply Cha<strong>in</strong> and MarketsHealth3. Frontier Technologies for Build<strong>in</strong>g 3. Natural Resource Managementand Transform<strong>in</strong>g Australian Industries4. Safeguard<strong>in</strong>g Australia 4. Climate Variability and Climatechange5. Biosecurity6. Support<strong>in</strong>g the Rural Research andDevelopment PrioritiesThe projects contribute to some extent to each Rural Research priority, butma<strong>in</strong>ly to the productivity priority.Productivity and Add<strong>in</strong>g ValueThe projects improve the pr<strong>of</strong>itability <strong>of</strong> the gra<strong>in</strong>s <strong>in</strong>dustry, particularly byprovid<strong>in</strong>g higher yield<strong>in</strong>g varieties more suited to market needs. The improvedvarieties therefore ma<strong>in</strong>ta<strong>in</strong> the competitiveness <strong>of</strong> value add<strong>in</strong>g <strong>in</strong>dustriesdependent on barley. These <strong>in</strong>clude the domestic malt<strong>in</strong>g and brew<strong>in</strong>g <strong>in</strong>dustries,and feedgra<strong>in</strong>s for livestock. In addition Australia is a lead<strong>in</strong>g exporter <strong>of</strong> barleyfor brew<strong>in</strong>g and livestock feed<strong>in</strong>g. Increas<strong>in</strong>g <strong>in</strong>comes <strong>in</strong> Asia have resulted <strong>in</strong>rapidly expand<strong>in</strong>g markets for beer and for meat.Supply Cha<strong>in</strong> and MarketsThe projects have been more effectively <strong>in</strong>tegrated with the major <strong>in</strong>dustriesdependent on barley. They have improved the flow <strong>of</strong> <strong>in</strong>formation through thesupply cha<strong>in</strong>. Intellectual property rights have been developed through EPR and<strong>in</strong>creased the scope for value creation and private sector <strong>in</strong>volvement.Accreditation for malt<strong>in</strong>g barley varieties and improved l<strong>in</strong>ks with <strong>in</strong>tensivelivestock <strong>in</strong>dustries will help ensure more effective market signals and moreeffective competition. The new national arrangements will assist <strong>in</strong> thedevelopment <strong>of</strong> a better understand<strong>in</strong>g <strong>of</strong> markets and <strong>of</strong> consumerrequirements.Natural Resource ManagementImproved barley varieties will cont<strong>in</strong>ue to have an important role <strong>in</strong> moresusta<strong>in</strong>able farm<strong>in</strong>g systems. Advantages can <strong>in</strong>clude ma<strong>in</strong>ta<strong>in</strong><strong>in</strong>g a role forbarley as a more resilient crop less dependent on fertiliser, and with moreflexibility to help farmers ma<strong>in</strong>ta<strong>in</strong> ground cover and reduce erosion.Climate Variability and Climate Change<strong>Barley</strong> is a highly adaptable crop. Improved barley varieties will cont<strong>in</strong>ue to havean important role <strong>in</strong> cropp<strong>in</strong>g systems that need to cope with <strong>in</strong>creased climatestresses.- 12 -
BiosecurityIncreased production <strong>of</strong> barley will reduce the occasional dependence <strong>of</strong> thefeedgra<strong>in</strong> <strong>in</strong>dustry on imports <strong>of</strong> gra<strong>in</strong> with associated risks from pests anddiseases.By contribut<strong>in</strong>g to the Rural Research priorities above the projects are satisfy<strong>in</strong>gthe National Research Priorities particularly Frontier Technologies for Build<strong>in</strong>gand Transform<strong>in</strong>g Australian Industries.The assessment <strong>of</strong> the percentage contributions to the five Rural ResearchPriorities are:1: 702: 153: 54: 55: 56 Pathways to AdoptionThe rate <strong>of</strong> adoption <strong>of</strong> the new varieties is dependent on the quality <strong>of</strong><strong>in</strong>formation communicated to growers and to end users. The projects <strong>in</strong>cludedcomponents giv<strong>in</strong>g priority to <strong>in</strong>dustry development activities better <strong>in</strong>tegratedwith variety breed<strong>in</strong>g and field and laboratory test<strong>in</strong>g. In 2005 GRDC developedthe National Variety Trials (NVT) as an improved system for comparative cropvariety test<strong>in</strong>g based on standardised trials. The system complements thebreed<strong>in</strong>g system by further test<strong>in</strong>g <strong>of</strong> a limited number <strong>of</strong> l<strong>in</strong>es close tocommercial release. Growers can readily access results relevant to their regionand assess yields compared with widely grown reference varieties(http://www.nvtonl<strong>in</strong>e.com.au/home.htm ). In Western Australia analysis <strong>of</strong> theoptions <strong>in</strong>cludes comprehensive comparisons <strong>of</strong> yield and quality <strong>in</strong> each region(Paynter et al 2008). The likelihood <strong>of</strong> achiev<strong>in</strong>g a malt premium is presentedbased on the ma<strong>in</strong> factors <strong>in</strong>fluenc<strong>in</strong>g key quality measures such as screen<strong>in</strong>gs (ameasure <strong>of</strong> gra<strong>in</strong> size or plumpness).In addition to comparative yields there are other agronomic and disease factorsthat <strong>in</strong>fluence farmer choices <strong>of</strong> new varieties. For example, the South Australianguide (Wheeler 2008) lists rat<strong>in</strong>gs for each variety for eight disease and n<strong>in</strong>eagronomic factors. Growers also need to consider the status <strong>of</strong> a variety from theend user perspective. <strong>Barley</strong> Australia was set up <strong>in</strong> 2005 as a peak <strong>in</strong>dustry bodywith functions <strong>in</strong>clud<strong>in</strong>g accreditation <strong>of</strong> new varieties for malt<strong>in</strong>g or feedgra<strong>in</strong>end uses ( <strong>Barley</strong> Australia 2008). When a grower has considered the range <strong>of</strong><strong>in</strong>formation on a new variety, a trial area might be planted by the grower.However availability <strong>of</strong> seed can be a constra<strong>in</strong>t while seed stocks build up.Given the <strong>in</strong>fluence <strong>of</strong> the above factors, adoption <strong>of</strong> new varieties by displac<strong>in</strong>gwell established traditional varieties may only <strong>in</strong>crease gradually over manyyears. Some <strong>of</strong> the recently predom<strong>in</strong>ant barley varieties were released overtwenty years ago. A GRDC survey <strong>in</strong> 2006 showed that only 41 per cent <strong>of</strong> barleygrowers had grown new barley varieties <strong>in</strong> the past five years. This was nochange from 2005 and well below the levels for wheat <strong>of</strong> over 70 per cent (GRDC2007).However, as the next section will show there has been a rapid <strong>in</strong>crease <strong>in</strong> thenumber <strong>of</strong> releases and rate <strong>of</strong> adoption <strong>of</strong> superior barley varieties <strong>in</strong> the last- 13 -
few years. <strong>Barley</strong> <strong>in</strong>dustry development <strong>of</strong>ficers funded by GRDC have a key roleto communicate <strong>in</strong>formation on varieties most suited to the wide range <strong>of</strong>environments. Their role <strong>in</strong> m<strong>in</strong>imis<strong>in</strong>g what growers perceive as the risk <strong>in</strong>grow<strong>in</strong>g new varieties has become more important. The emphasis on more rapidrelease and commercialisation has <strong>in</strong>creased. Shortened test<strong>in</strong>g times put greateremphasis on better communication and on the role <strong>of</strong> <strong>in</strong>dustry developmentactivities. <strong>An</strong> <strong>in</strong>creas<strong>in</strong>g proportion <strong>of</strong> the crop is subject to End Po<strong>in</strong>t Royalties(EPR) and this will tend to <strong>in</strong>crease the more aggressive market<strong>in</strong>g <strong>of</strong> newvarieties.7 Measur<strong>in</strong>g BenefitsAs discussed <strong>in</strong> Section 4 no major social or environmental benefits wereidentified or evaluated. The only economic benefits identified that can be readilyquantified are those relat<strong>in</strong>g to improved productivity from <strong>in</strong>creased yields.<strong>Barley</strong> prospectsThe benefits are assumed to consist <strong>of</strong> the <strong>in</strong>creased pr<strong>of</strong>its from the higheryield<strong>in</strong>g varieties grown by farmers. The analysis also needs to take <strong>in</strong>to accountany expansion <strong>in</strong> the area sown to barley. In the longer term, pr<strong>of</strong>itabilityrelative to alternative uses <strong>of</strong> the resources <strong>in</strong>volved will be a key factor. <strong>Barley</strong>has traditionally been <strong>of</strong>ten grown <strong>in</strong> rotations with other crops and pastures onmixed or more specialised gra<strong>in</strong> farms. The likelihood <strong>of</strong> a premium for barleythat meets malt<strong>in</strong>g specifications is <strong>of</strong>ten a key factor <strong>in</strong>fluenc<strong>in</strong>g a farmer’schoice <strong>of</strong> crop. In southern Australia and <strong>in</strong> Western Australia malt<strong>in</strong>g barley is<strong>of</strong>ten more competitive with wheat. In parts <strong>of</strong> northern and eastern Australiawheat premiums have traditionally been more likely than barley premiums. Thatmay be chang<strong>in</strong>g. As fertility decl<strong>in</strong>es on some soils that don’t have a susta<strong>in</strong>ablerotation, wheat is becom<strong>in</strong>g more dependent on fertiliser <strong>in</strong>puts. However<strong>in</strong>creas<strong>in</strong>g costs and more variable seasons have made fertiliser decisions morerisky.Table 7 Trends <strong>in</strong> yield and production <strong>of</strong> barley <strong>in</strong> relation to wheat,Australia 1979 to 2008Period<strong>Barley</strong> Yield Advantage(% <strong>in</strong>crease on wheat)<strong>Barley</strong>production(% <strong>of</strong> wheat)1979-1993 2.4 26.61994-2008 4.7 33.1Source: Calculated from ABARE (2006 and 2008) commodity statistics (based on AustralianBureau <strong>of</strong> Statistics and other sources)As shown <strong>in</strong> Table 7 barley production has <strong>in</strong>creased from about one quarter <strong>of</strong>the level <strong>of</strong> wheat to about one-third over the last few decades. The trends maybe <strong>in</strong>fluenced by vary<strong>in</strong>g rates <strong>of</strong> expansion <strong>of</strong> wheat and barley <strong>in</strong> differentregions. Wheat had been the crop <strong>of</strong> choice <strong>in</strong> more marg<strong>in</strong>al areas <strong>of</strong> easternAustralia. The table also shows an <strong>in</strong>creas<strong>in</strong>g yield advantage <strong>of</strong> barley comparedwith wheat. In contrast Stephens (2003) <strong>in</strong> a national analysis to 1996 showedbarley yield trends were generally lower than wheat, attributable to less fertiliserapplied to malt<strong>in</strong>g barley. In the Stephens analysis, barley trends had similarregional patterns to wheat. However, barley trends were better than wheat <strong>in</strong>southern Victoria and southern Western Australia where barley better handleswaterlogg<strong>in</strong>g and frosts. Those problems have probably decreased.- 14 -
attributes such as gra<strong>in</strong> plumpness. On export malt markets, qualityimprovements will have an important role perhaps more <strong>in</strong> ma<strong>in</strong>ta<strong>in</strong><strong>in</strong>gcompetitiveness than achiev<strong>in</strong>g premiums.Leaders <strong>of</strong> the research projects provided details on current and likely futureadoption <strong>of</strong> new varieties and on likely yield <strong>in</strong>creases. The NVT data set isextensive. For barley, over 900 entries are listed <strong>of</strong> mean yields for varietiestested <strong>in</strong> regions and zones cover<strong>in</strong>g the ma<strong>in</strong> barley produc<strong>in</strong>g areas. <strong>Barley</strong>breeders us<strong>in</strong>g NVT experience and knowledge <strong>of</strong> current and likely adoption <strong>of</strong>the new varieties provided estimates <strong>of</strong> vary<strong>in</strong>g detail at State or GRDC Regionlevel for this evaluation. The estimates were provided for 2007/08 correspond<strong>in</strong>gto the end <strong>of</strong> the period <strong>of</strong> <strong>in</strong>vestment, and for 2012/13 as an <strong>in</strong>dication <strong>of</strong> thelikely adoption at about the time the varieties could be expected to achieve nearto their maximum levels. The contributions by 2012/13 assume no furtherreleases.The data detail provided by the barley breeders varied from an analysis byvarieties <strong>of</strong> yields and receivables for each <strong>of</strong> the five sub-regions <strong>in</strong> Victoria toState level estimates <strong>of</strong> receivables <strong>in</strong> Western Australia. The data wasaggregated to the three GRDC regions us<strong>in</strong>g ABARE <strong>in</strong>formation on barley areaand production over the period and NVT data on yields. The additional productionattributed to a specific variety can thus be made up from several regions, eachwith a specific yield benefit and adoption pattern, and each displac<strong>in</strong>g differentolder varieties. The data <strong>in</strong>dicated that adoption as shown by the area <strong>of</strong> the newvarieties released had already been rapid. The estimate for the 2007 crop wasthat about 40 per cent <strong>of</strong> the total area had been planted to new varietiesreleased s<strong>in</strong>ce 2002.There is debate, but seem<strong>in</strong>gly little data other than anecdotal, on the extent towhich NVT yield <strong>in</strong>creases are achieved on farm. Op<strong>in</strong>ions, both positive andnegative, vary. Some argue for example that farmers have more opportunity tooptimise plant<strong>in</strong>g times. As part <strong>of</strong> “Ga<strong>in</strong>s for Gra<strong>in</strong>s” six experienced agriculturalconsultants were asked ‘What percentage <strong>of</strong> yield <strong>in</strong>creases achieved <strong>in</strong> researchtrials is achieved when results are implemented on farm – for new varieties?’(GRDC 1992). Three responses had either a wide range or a very low value. Theother three responses averaged about 90 per cent. Note that the question is adifferent one to the difference <strong>in</strong> yields between experiments and farms wherethe answer is traditionally accepted as about one third less on farm (Davidson1962).Table 8 shows the benefits from the breed<strong>in</strong>g program as measured by the<strong>in</strong>creased yields achieved and the extent <strong>of</strong> adoption estimated <strong>in</strong> 2012/13. Overthe ten year period the new varieties released <strong>in</strong> the seven year period to2007/08 are expected to displace about 80 per cent <strong>of</strong> the varieties that werebe<strong>in</strong>g grown <strong>in</strong> 2002/03. The expected benefit <strong>in</strong> terms <strong>of</strong> <strong>in</strong>creased production is<strong>of</strong> the order <strong>of</strong> about one half a million tonnes or 6 per cent <strong>of</strong> likely nationalproduction by 2012/13. About 10 per cent <strong>of</strong> total production is estimated to befrom varieties bred <strong>in</strong> another GRDC region. The estimated average annual yield<strong>in</strong>crease to 2012/13 is 0.75 per cent compound, consistent with values <strong>in</strong> similarstudies, for example Brennan et al (2004).Table 8 <strong>in</strong>cludes contributions expected by 2012/13 from 19 new releases overthe seven year period to 2007/08. There were also three releases early <strong>in</strong> theperiod not listed, as negligible quantities are grown currently.- 16 -
Table 8: Cumulative yield <strong>in</strong>creases and estimates <strong>of</strong> production <strong>in</strong>2012/13 from new barley varieties released from 2002 to 2008VarietyOrig<strong>in</strong>(1)End Use(2)Year(3)Production <strong>in</strong> GRDC Region('000 tonnes)Northern Southern WesternAustraliaMackay QLD Feed 2002 0 0SloopSA* SA Malt 2002 155 155SloopVIC* VIC Malt 2002 50 50Baud<strong>in</strong> WA Malt 2003 110 586 696Hamel<strong>in</strong> WA Malt 2004 385 385Grout QLD Feed (MP) 2005 166 166Fitzroy VIC Malt 2005 116 116Flagship* UA Malt 2006 791 80 871Fleet* UA Feed 2006 427 427Buloke VIC Malt 2006 544 260 804Vlam<strong>in</strong>gh WA Malt 2006 247 247H<strong>in</strong>dmarsh* VIC Feed (MP) 2007 118 1,483 200 1,801Roe WA Feed 2007 195 195Lockyer WA Feed 2007 147 147Hannan WA Feed (MP) 2007 84 84Commander* UA MP 2008 174 730 904NRB03470 QLD MP 2008 290 290Vertess TAS MP 2008 20 0Urambie NSW Feed 2005 20 0Other (varieties released before 2002) 251 1,249 515 2,055TOTALAUSTRALIAN PRODUCTION1,115 5,580 2,699 9,394('000 tonnes)Contribution from 2002-08 Varieties (per cent) 77 79 81 79Cumulative <strong>An</strong>nual Yield Increase0.77 0.80 0.67 0.75from 2002 to 2013 (per cent per annum)Benefit <strong>in</strong> 2013 from yield <strong>in</strong>crease ('000 tonnes) 72 345 148 566Note:1) Orig<strong>in</strong> refers to the location <strong>of</strong> the breed<strong>in</strong>g program, either state-based or University <strong>of</strong>Adelaide (UA).2) As def<strong>in</strong>ed by <strong>Barley</strong> Australia. MP <strong>in</strong>dicates evaluation for malt<strong>in</strong>g is scheduled or <strong>in</strong>progress.3) Year evaluated or accredited as listed by <strong>Barley</strong> Australia follow<strong>in</strong>g earlier release by abreed<strong>in</strong>g organisation.4) Three varieties listed <strong>in</strong> Table 5 that did not achieve significant production levels by2007/08 have been excluded. Mackay is a significant current variety <strong>in</strong> the Northern Regionbut is assumed to be displaced by 2012/13.* Indicates a variety with Cereal Cyst Nematode resistance (relevant to the Southern Region)H<strong>in</strong>dmarsh appears to be widely adapted and is expected to make the largestcontribution to national production <strong>of</strong> 19 per cent. For 17 sites <strong>in</strong> the NVT,H<strong>in</strong>dmarsh averaged 13 per cent more yield than Gairdner. Although there wereonly a limited number <strong>of</strong> seasons, the geographic extent <strong>of</strong> the <strong>in</strong>creases- 17 -
achieved by H<strong>in</strong>dmarsh gives confidence that the <strong>in</strong>crease is achievable <strong>in</strong> futureand that this is <strong>in</strong>deed a highly adaptable variety. The next four varietiesCommander, Flagship, Buloke and Baud<strong>in</strong> are expected to contribute 30 per centto total production.Attribution <strong>of</strong> benefits to prior <strong>in</strong>vestments <strong>in</strong> project outcomesAs discussed above the benefits accrue from the adoption <strong>of</strong> new varieties. Theyare the major outcome <strong>of</strong> prior <strong>in</strong>vestments by GRDC <strong>in</strong> breed<strong>in</strong>g and <strong>in</strong> prebreed<strong>in</strong>gresearch. A new variety is a result <strong>of</strong> <strong>in</strong>vestments made over theprevious breed<strong>in</strong>g cycle, and <strong>in</strong>creas<strong>in</strong>gly from pre-breed<strong>in</strong>g. The pattern <strong>of</strong> thebreed<strong>in</strong>g <strong>in</strong>vestment can be calculated by assum<strong>in</strong>g the duration <strong>of</strong> a typicalbreed<strong>in</strong>g cycle and apportion<strong>in</strong>g prior <strong>in</strong>vestments to varieties released <strong>in</strong> aparticular year (AGTRANS 2007a).Estimates by barley breeders for the length <strong>of</strong> the breed<strong>in</strong>g cycle ranged from 8years for feed varieties to 12 years generally. New technologies are expected toresult <strong>in</strong> shorter cycles. As shown by Brennan et al (2004) <strong>in</strong> wheat breed<strong>in</strong>g,there has been a 12 year lag between the cross be<strong>in</strong>g made and the release <strong>of</strong> animproved variety. For this analysis for simplicity a 10 year lag is assumed. Onthat basis for example 10 per cent <strong>of</strong> the <strong>in</strong>vestment <strong>in</strong> 1993 can be attributed toOutputs over the period from 2002 to 2008.Table 9: Attribution <strong>of</strong> <strong>in</strong>vestments dur<strong>in</strong>g the breed<strong>in</strong>g cycles from1992-2008 to outputs <strong>of</strong> the breed<strong>in</strong>g program from 2002 to 2008(nom<strong>in</strong>al $)Year(to 30 June) GRDC OtherAttribution to Outputs from2002 to 2008Per cent GRDC($,000)Other($,000)1992 1.240 3.242 0 0.000 0.0001993 1.608 3.575 10 0.161 0.3571994 1.975 3.907 20 0.395 0.7811995 2.343 4.240 30 0.703 1.2721996 2.710 4.572 40 1.084 1.8291997 3.078 4.905 50 1.539 2.4521998 3.445 5.237 60 2.067 3.1421999 3.813 5.570 70 2.669 3.8992000 4.180 5.902 70 2.926 4.1322001 4.150 6.235 70 2.905 4.3642002 4.150 6.567 70 2.905 4.5972003 4.120 6.900 60 2.472 4.1402004 3.412 6.376 50 1.706 3.1882005 3.871 6.782 40 1.548 2.7132006 4.540 7.256 30 1.362 2.1772007 4.502 7.372 20 0.900 1.4742008 4.878 7.722 10 0.488 0.772Total 58,012 96,360 700 25,829 41,291Note: GRDC and Other (ma<strong>in</strong>ly host organisation) <strong>in</strong>vestments were <strong>in</strong>terpolated us<strong>in</strong>g actual datafrom Clements et al (1992), from GRDC (2000), and from the project data <strong>of</strong> Table 4.- 18 -
The <strong>in</strong>vestments <strong>in</strong> barley breed<strong>in</strong>g over the period from 1993 to 2001 wereapproximated us<strong>in</strong>g actual values for 1992 and for 2000 as shown <strong>in</strong> Table 9. Aswould be expected <strong>in</strong>tuitively, the percentage allocations to the releases over theseven year period from 2002 to 2008 are equivalent to seven years <strong>of</strong><strong>in</strong>vestment.The calculated totals for GRDC and for ‘Other’ <strong>in</strong> Table 9 are very similar to theactual nom<strong>in</strong>al totals from 2002 to 2008. The actual GRDC total <strong>in</strong> Table 4 was$25.520m compared with $25.829m as estimated for the breed<strong>in</strong>g cycle <strong>in</strong> Table9. But the key differences <strong>in</strong> an <strong>in</strong>vestment context arise from the differences <strong>in</strong>the price level and <strong>in</strong> the time value <strong>of</strong> money. On that basis us<strong>in</strong>g the ConsumerPrice Index and a 5 per cent discount rate, the present value cost <strong>of</strong> the<strong>in</strong>vestment <strong>in</strong> outputs from 2002 to 2008 is about 50 per cent higher for themore rigorous breed<strong>in</strong>g cycle approach compared with simply us<strong>in</strong>g actual costsover the period from 2002 to 2008.Attribut<strong>in</strong>g benefits from the large GRDC <strong>in</strong>vestment <strong>in</strong> pre-breed<strong>in</strong>g research ismore problematic. The benefits are difficult to evaluate and attribute, but theycan be assumed to be eventually embodied <strong>in</strong> new varieties. The views <strong>of</strong> thebarley breeders were that pre-breed<strong>in</strong>g research would have only made a smallcontribution to the releases over the period from 2002 to 2008. The use <strong>of</strong>molecular mark<strong>in</strong>g technology is one example. Markers are used most efficiently<strong>in</strong> the earlier years <strong>of</strong> a breed<strong>in</strong>g cycle so that much <strong>of</strong> their contribution will be <strong>in</strong>future releases. Where pre-breed<strong>in</strong>g research results <strong>in</strong> <strong>in</strong>troduction <strong>of</strong> novelmaterial <strong>in</strong>to a breed<strong>in</strong>g program, the time lag to benefits be<strong>in</strong>g realised can be<strong>of</strong> the order <strong>of</strong> one to two decades. On balance, no allowance was seen asnecessary for the benefits from pre-breed<strong>in</strong>g research. Increas<strong>in</strong>gly <strong>in</strong> future toavoid double count<strong>in</strong>g <strong>in</strong> evaluat<strong>in</strong>g breed<strong>in</strong>g programs, allowances will need tobe made.The CounterfactualIn the absence <strong>of</strong> the GRDC <strong>in</strong>vestment, breed<strong>in</strong>g programs would most likelyhave been quickly cut back. But as varieties with EPR <strong>in</strong>creased as a proportion<strong>of</strong> the crop, commercial <strong>in</strong>terests may have purchased rights to exist<strong>in</strong>ggermplasm and been able to fund limited ongo<strong>in</strong>g programs. This would be thecase particularly where there is an EPR capture mechanism for a particular enduse. Imported varieties have not been a low-risk viable alternative without amajor <strong>in</strong>vestment to develop adapted varieties.The key assumptions <strong>in</strong> determ<strong>in</strong><strong>in</strong>g a basel<strong>in</strong>e from which to measure benefits isthat <strong>in</strong> the absence <strong>of</strong> the GRDC <strong>in</strong>vestment:• there would have been a four year gap before net benefits became positive asnew varieties were released, and• The level <strong>of</strong> net benefits would then <strong>in</strong>crease at only half that achieved by theGRDC <strong>in</strong>vestment.Benefits as measured by gross marg<strong>in</strong> changes on farmThe <strong>in</strong>creased production <strong>of</strong> barley was shown <strong>in</strong> Table 8. The additional pr<strong>of</strong>itscan be estimated from changes <strong>in</strong> the gross marg<strong>in</strong> to take account <strong>of</strong> theadditional costs <strong>in</strong>volved <strong>in</strong> produc<strong>in</strong>g and market<strong>in</strong>g a marg<strong>in</strong>al <strong>in</strong>crease <strong>in</strong>production. Possible impacts <strong>of</strong> shifts <strong>in</strong> supply and demand need to be firstconsidered.Given that on average over one half <strong>of</strong> barley production is exported <strong>in</strong>tocompetitive markets, barley could be assumed to be a price taker so that priceeffects from <strong>in</strong>creased supply will be m<strong>in</strong>or. Farquharson and Griffith (2001)- 19 -
showed that the then s<strong>in</strong>gle desk arrangements for barley sell<strong>in</strong>g <strong>in</strong> NSW hadcapacity to practice some discrim<strong>in</strong>atory pric<strong>in</strong>g but only <strong>in</strong> a smaller domesticmarket. In an analysis <strong>of</strong> Queensland barley prices Gali and Brown (2002)showed that feed barley prices led malt<strong>in</strong>g barley prices.Australian barley is a major contributor to both export malt and feed markets. Inthe domestic market, feedgra<strong>in</strong>s are the major market and as with the exportfeedgra<strong>in</strong> market there are other gra<strong>in</strong>s that can substitute for barley to someextent. Given the above supply and demand factors, the analysis will assume the<strong>in</strong>creased production has no readily quantifiable significant impact on prices. Thisassumption is the same as made by Brennan et al (2004) <strong>in</strong> an economicevaluation <strong>of</strong> New South Wales wheat breed<strong>in</strong>g program. In relation to potentialexpansion <strong>of</strong> the barley <strong>in</strong>dustry, this analysis will not <strong>in</strong>clude any benefit thatimproved varieties will have on the rate <strong>of</strong> expansion. But the additional yield onthe expanded area <strong>of</strong> barley, as forecast by ABARE, will be <strong>in</strong>cluded as a benefit.The assumption is further justified if it is considered that competitor crops arealso achiev<strong>in</strong>g <strong>in</strong>creased yields from new varieties.The approach adopted for measur<strong>in</strong>g benefits for barley differs <strong>in</strong> some respectsfrom a previous evaluation (AGTRANS 2007b) <strong>of</strong> the benefits <strong>of</strong> breed<strong>in</strong>gprograms for the cluster ‘Other Crops’, durum wheat, oats, and two triticaleprojects. Because there was greater complexity with four programs <strong>in</strong>volved andall had expanded rapidly <strong>in</strong> recent years, project costs rather than costs over thebreed<strong>in</strong>g cycle were used. Also a more conservative cost reduction approach wasused to estimate benefits to take account <strong>of</strong> uncerta<strong>in</strong>ty <strong>in</strong> the impacts <strong>of</strong> largeyield <strong>in</strong>creases form a short period <strong>of</strong> field trials.Table 10 summarises the major assumptions made <strong>in</strong> undertak<strong>in</strong>g the evaluation.- 20 -
for the total <strong>in</strong>vestment and for the GRDC <strong>in</strong>vestment (the latter based simply onapportion<strong>in</strong>g benefits accord<strong>in</strong>g to costs).Table 11: <strong>Economic</strong> impact <strong>of</strong> the total <strong>in</strong>vestment(2007/08 $ terms, 5% discount rate)Total <strong>Investment</strong> Present +5 Years +10 Years +25 YearsCumulative PV <strong>of</strong> Benefits ($m) 112 413 647 1,022Cumulative PV <strong>of</strong> Costs ($m) 121 121 121 121Cumulative NPV ($m) -8 292 526 901Benefit Cost Ratio (BCR) 0.93 3.43 5.36 8.48Internal Rate <strong>of</strong> Return (%) 3.8 18.7 21.2 22.1Table 12: <strong>Economic</strong> impact <strong>of</strong> the GRDC <strong>in</strong>vestment(2007/08 $ terms, 5% discount rate)GRDC <strong>Investment</strong> Present +5 Years +10 Years +25 YearsCumulative PV <strong>of</strong> Benefits ($m) 42 154 240 380Cumulative PV <strong>of</strong> Costs ($m) 46 46 46 46Cumulative NPV ($m) -5 107 194 334Benefit Cost Ratio (BCR) 0.90 3.31 5.18 8.18Internal Rate <strong>of</strong> Return (%) 3.2 18.4 20.9 21.8Before consider<strong>in</strong>g other possible scenarios for the outcomes from the GRDC<strong>in</strong>vestment, some <strong>in</strong>terpretation <strong>of</strong> the pattern <strong>of</strong> future benefits is warranted.The graph (Figure 1) shows the pattern <strong>of</strong> benefits for the base case for theperiod <strong>of</strong> analysis. The broad pattern <strong>of</strong> benefits ris<strong>in</strong>g to a peak and thendecl<strong>in</strong><strong>in</strong>g to a slightly lower plateau is <strong>in</strong>fluenced by four ma<strong>in</strong> factors:• The early phase shaped ma<strong>in</strong>ly by the rapid <strong>in</strong>creases <strong>in</strong> adoption rate alreadyachieved and by the estimated <strong>in</strong>creases <strong>in</strong> yields,• The peak determ<strong>in</strong>ed by the estimated peak adoption rate and maximum level<strong>of</strong> benefits/ha,• The decl<strong>in</strong><strong>in</strong>g phase as determ<strong>in</strong>ed <strong>in</strong>itially by the assumption that <strong>in</strong> theabsence <strong>of</strong> the GRDC <strong>in</strong>vestment, the barley breed<strong>in</strong>g effort would becont<strong>in</strong>ued but with a lag and with reduced benefits, and• The plateau based on the assumption that benefits would be ma<strong>in</strong>ta<strong>in</strong>ed eventhough the current crop <strong>of</strong> varieties would eventually be displaced.There can be some confidence on the magnitude <strong>of</strong> the rapid early benefits. Theadoption data are based on results actually achieved. The yield estimates areless certa<strong>in</strong> as they are based on NVT data and not farm data. However therewas no consensus on whether the per cent <strong>in</strong>creases achieved <strong>in</strong> NVT should bediscounted to estimate farm level response.The sensitivity analyses to illustrate other scenarios will therefore concentrate onpessimistic and optimistic factors <strong>in</strong>fluenc<strong>in</strong>g the overall level <strong>of</strong> benefits and alsoon the benefits <strong>in</strong> the medium term. The next section develops two scenarios toshow the possible range <strong>of</strong> outcomes.- 23 -
9 Other ScenariosAs concluded <strong>in</strong> the previous section, benefits <strong>in</strong> the early part <strong>of</strong> the analysis canbe considered achieved with more confidence than those later <strong>in</strong> the periodanalysed. Optimistic and pessimistic scenarios therefore need to be developed byadjustments particularly to the assumptions determ<strong>in</strong><strong>in</strong>g the medium term level<strong>of</strong> benefits.9.1 OptimisticThe assumptions made on the potential benefits achieved if GRDC had not<strong>in</strong>vested <strong>in</strong> barley breed<strong>in</strong>g are the ma<strong>in</strong> determ<strong>in</strong>ant <strong>of</strong> the medium termbenefits. The optimistic scenario is thus about optimism that the ‘crowd<strong>in</strong>g out’hypothesis is not applicable. The ‘crowd<strong>in</strong>g out’ hypothesis describes <strong>in</strong> thiscontext a publicly funded <strong>in</strong>vestment where market failure as the rationale forpublic <strong>in</strong>vestment was not necessary – the private sector would have <strong>in</strong>vestedanyway.Thus a more optimistic scenario (<strong>in</strong> terms <strong>of</strong> returns to the GRDC <strong>in</strong>vestment) willresult if the benefits <strong>in</strong> the ‘without GRDC <strong>in</strong>vestment’ situation are halved. Therewould then be less ‘crowd<strong>in</strong>g out’. The <strong>in</strong>itial assumption was that alternativebreed<strong>in</strong>g arrangements would start up with a four-year lag and with net benefitsreduced by one half. The assumption recognised that with <strong>in</strong>creas<strong>in</strong>g EPR therewould eventually be opportunities for commercial breed<strong>in</strong>g operations to beg<strong>in</strong> <strong>in</strong>selected markets. This analysis has shown that new varieties should cont<strong>in</strong>ue tobe rapidly adopted and eventually encourage commercial breeders <strong>in</strong> somemarkets where the opportunities for capture <strong>of</strong> EPR are better def<strong>in</strong>ed. Howeverthere is some uncerta<strong>in</strong>ty on the extent <strong>of</strong> possible alternative arrangements.Therefore to illustrate the potential change <strong>in</strong> benefits, the benefits <strong>in</strong> the‘without’ situation were reduced by one half, result<strong>in</strong>g <strong>in</strong> benefits only a quarter<strong>of</strong> the ‘with GRDC’ <strong>in</strong>vestment. The <strong>in</strong>crease <strong>in</strong> returns is shown <strong>in</strong> Table 12 forthe GRDC <strong>in</strong>vestment. This scenario <strong>in</strong>dicates that there would only be a small<strong>in</strong>crease <strong>in</strong> return to the GRDC <strong>in</strong>vestment if a commercial alternative was lesslikely. The implication is that the rapid early <strong>in</strong>crease <strong>in</strong> adoption <strong>of</strong> new varietiesis the dom<strong>in</strong>ant factor <strong>in</strong> achiev<strong>in</strong>g high returns.Table 13: Return to the GRDC <strong>in</strong>vestment – Optimistic Scenario(2007/08 $ terms, 5% discount rate)GRDC <strong>Investment</strong> 0 Years 5 Years 10 Years 25 YearsCumulative PV <strong>of</strong> Benefits ($m) 43 167 284 493Cumulative PV <strong>of</strong> Costs ($m) 46 46 46 46Cumulative NPV ($m) -4 120 238 447Benefit Cost Ratio (BCR) 0.92 3.59 6.12 10.62Internal Rate <strong>of</strong> Return (%) 3.5 19.2 22.1 23.19.2 PessimisticThe pessimistic scenario is based on the follow<strong>in</strong>g changes to the two key factors<strong>in</strong> terms <strong>of</strong> uncerta<strong>in</strong>ty <strong>of</strong> the assumptions:• A reduction <strong>of</strong> one third <strong>in</strong> benefits up to the peak year <strong>in</strong> 2012/13, and• Benefits decl<strong>in</strong><strong>in</strong>g from 2012/13 to zero by the end <strong>of</strong> the analysis.- 24 -
Results are shown <strong>in</strong> Table 14. There are several risk factors that could contributeto a decl<strong>in</strong>e from the constant level assumed once adoption had stabilised. Thema<strong>in</strong> assumption was that the varieties be<strong>in</strong>g evaluated would eventually bedisplaced by yet to be released higher yield<strong>in</strong>g varieties <strong>in</strong> the com<strong>in</strong>g years.However the benefits were assumed to be ma<strong>in</strong>ta<strong>in</strong>ed because the further yield<strong>in</strong>creases are attributable to the further <strong>in</strong>vestments.The one-third reduction <strong>in</strong> benefits to 2012/13 takes <strong>in</strong>to account possible risks<strong>in</strong>clud<strong>in</strong>g changes <strong>in</strong> adoption rates as determ<strong>in</strong>ed by:• how well NVT percentage yield advantages translate to farm scale, and• whether new varieties achieve accreditation for malt<strong>in</strong>g.For some <strong>of</strong> the more significant emerg<strong>in</strong>g varieties such as Commander,accreditation for malt<strong>in</strong>g is highly likely as provisional malt<strong>in</strong>g status has alreadybeen achieved. For Grout, which is currently a significant feed variety <strong>in</strong> theGRDC Northern Region, future adoption assumed that would cont<strong>in</strong>ue eventhough there is a possibility <strong>of</strong> Grout achiev<strong>in</strong>g malt<strong>in</strong>g status. Adoption <strong>of</strong> thenew Northern Region variety, NRB03470, was also based on a conservativeassumption <strong>of</strong> accreditation as a feed variety.With the possible exception <strong>of</strong> H<strong>in</strong>dmarsh, there are generally enough varietiesand available alternatives to m<strong>in</strong>imise the overall impact on benefits fromwhether or not any one variety is accredited for malt<strong>in</strong>g. <strong>An</strong> analysis tak<strong>in</strong>g <strong>in</strong>toaccount various scenarios based on probabilities <strong>of</strong> varieties achiev<strong>in</strong>gaccreditation would become quite complex. Explicit assumptions would beneeded on the premium for a malt end use, and on domestic and export marketsfor each variety <strong>in</strong> terms <strong>of</strong> for malt<strong>in</strong>g or for feed. In this analysis H<strong>in</strong>dmarsh isexpected to be the most widely grown variety account<strong>in</strong>g for about 20 percent <strong>of</strong>the crop by 2012/13. H<strong>in</strong>dmarsh is yet to be accredited for malt<strong>in</strong>g. The rate <strong>of</strong>adoption assumed for H<strong>in</strong>dmarsh took <strong>in</strong>to account to some extent the possibilitythat H<strong>in</strong>dmarsh might only be accredited as a feed variety. If it were not to beaccredited, there could be some substitution from other malt<strong>in</strong>g varieties andsome reduction <strong>in</strong> aggregate benefits. But the changes would be much smallerthan the one-third reduction assumed for this pessimistic scenario.The longer term decl<strong>in</strong>e <strong>in</strong> benefits could also take <strong>in</strong>to account a pessimistic viewon the impacts <strong>of</strong> climate change <strong>in</strong>clud<strong>in</strong>g higher costs for key <strong>in</strong>puts such asfuel and fertiliser. However, barley as a resilient crop may be less impacted byclimate change and there is scope for adaptation to reduce the impacts.Potential impacts and adaptations have been reviewed by Howden et al (2008).Gunasekera et al (2007) <strong>in</strong> a prelim<strong>in</strong>ary study <strong>of</strong> economic impacts on Australianagriculture have <strong>in</strong>dicated production impacts <strong>of</strong> a 9.2 per cent decl<strong>in</strong>e (from thereference case <strong>of</strong> no climate change impacts) <strong>in</strong> Australian gra<strong>in</strong> production by2030. The last decade has <strong>in</strong>cluded two major droughts, higher than historicdrought <strong>in</strong>cidence, but possibly realistic for the next 25 years given projections <strong>of</strong>up to 20 per cent more drought months over most <strong>of</strong> Australia by 2030 (CSIROand the Bureau <strong>of</strong> Meteorology 2007).- 25 -
from breed<strong>in</strong>g cycles <strong>of</strong> the order <strong>of</strong> a decade the analysis is clearly morereflective <strong>of</strong> returns from the previous structure.The analysis has not considered benefits <strong>in</strong> relation to <strong>in</strong>vestments at the projectlevel. However benefits were aggregated by GRDC region and they are veryuniform <strong>in</strong> terms <strong>of</strong> the likely percentage <strong>in</strong>crease <strong>in</strong> production. The Northernand Western regions each had about one quarter <strong>of</strong> their <strong>in</strong>crease from varietiesbred <strong>in</strong> other regions. The correspond<strong>in</strong>g figure for the Southern region was twoper cent. This pattern is likely to simply reflect the relative size and location <strong>of</strong>the Southern region. It also reflects some level <strong>of</strong> <strong>in</strong>tegration at the nationallevel.As a result <strong>of</strong> the early releases and their rapid adoption, and <strong>of</strong> the assumedyield <strong>in</strong>creases, the <strong>in</strong>vestment can be expected to break even by 2009. Therecan be some degree <strong>of</strong> confidence <strong>in</strong> this conclusion as it is based on the actualpattern <strong>of</strong> deliveries. There is less certa<strong>in</strong>ty on the yield assumptions as these <strong>in</strong>most cases are simply based on <strong>in</strong>creases recorded <strong>in</strong> NVT trials. The evaluationwas not able to locate any strong evidence on the transferability <strong>of</strong> NVT <strong>in</strong>creasesto the field situation. The confidence <strong>in</strong> the evaluation would be considerably<strong>in</strong>creased if that were available (as clearly would be the utility <strong>of</strong> the NVTsystem). Note the issue raised is not the well accepted and well understoodreliability <strong>of</strong> NVT <strong>in</strong> terms <strong>of</strong> rank<strong>in</strong>g.Given that the <strong>in</strong>vestment is already close to pr<strong>of</strong>itable under the assumptionsused and is based on actual data, sensitivity analyses were more relevant toassumptions on medium term benefits. If benefits <strong>in</strong> the medium term decl<strong>in</strong>esubstantially, the <strong>in</strong>vestment still rema<strong>in</strong>s highly pr<strong>of</strong>itable. The decl<strong>in</strong>e couldresult for example if there was a reduced rate <strong>of</strong> replacement varieties <strong>in</strong> futureand pr<strong>of</strong>itability decl<strong>in</strong>ed, for example from impacts <strong>of</strong> climate change. Based onnational yield and production trends, barley appears to be <strong>in</strong>creas<strong>in</strong>glycompetitive with wheat. The analysis assumed that position would be ma<strong>in</strong>ta<strong>in</strong>edparticularly as barley is considered a highly adapted crop generally andparticularly as climate change impacts <strong>in</strong>crease.The <strong>in</strong>vestment was evaluated aga<strong>in</strong>st a problematic base <strong>of</strong> what might haveeventuated if GRDC had not <strong>in</strong>vested. The assumption was made that otherbreed<strong>in</strong>g arrangements would evolve but there would be a lag and net benefitswould be only one half <strong>of</strong> currently achieved benefits. The analysis was not verysensitive to more pessimistic assumptions <strong>in</strong>dicat<strong>in</strong>g that the rapid early adoption<strong>of</strong> new varieties was dom<strong>in</strong>at<strong>in</strong>g the analysis. The pessimistic assumptions<strong>in</strong>cluded the possibility that recently released varieties might not be accredited asmalt<strong>in</strong>g varieties. However the varieties were still assumed to be widely adoptedas feed varieties.The length <strong>of</strong> the lag until other breed<strong>in</strong>g arrangements evolve will depend onhow quickly EPR grow to make commercial arrangements more likely. Thiseconomic analysis has not quantified EPR because they are a transfer payment,that is a cost to the farmer and a benefit to the breed<strong>in</strong>g agency. Future<strong>in</strong>vestment decisions will need to take greater account <strong>of</strong> EPR revenue than wasthe case <strong>in</strong> 2002. When the projects at the start <strong>of</strong> this period <strong>of</strong> evaluation werefunded <strong>in</strong> 2002 a higher proportion <strong>of</strong> the crop was not covered by EPR.<strong>An</strong>other conservative aspect <strong>of</strong> the analysis is the exclusion <strong>of</strong> quality aspectsthat may contribute to a price premium. But to some extent the adoptionestimates should reflect all advantages, not only <strong>in</strong> yield.- 27 -
The analysis is <strong>of</strong> a national system <strong>in</strong> transition from one based on state-basedbreed<strong>in</strong>g programs to one now based on three nodes. The results are moreattributable to the previous structure. The analysis does however provide achalleng<strong>in</strong>g performance benchmark for the new structure.11 AcknowledgmentsProject Leaders , <strong>Barley</strong> Breed<strong>in</strong>gDr Jason Egl<strong>in</strong>gton, University <strong>of</strong> AdelaidePr<strong>of</strong> Jerome Franckowiak, Queensland Department <strong>of</strong> Primary Industries andFisheriesDr Reg Lance, Department <strong>of</strong> Agriculture and Food, Western AustraliaDavid Moody, Victorian Department <strong>of</strong> Primary IndustriesJohn Oliver, NSW Department <strong>of</strong> Primary IndustriesDr Meixue Zhou, University <strong>of</strong> Tasmania<strong>Barley</strong> Research and Development OfficersKym McIntyre Queensland Department <strong>of</strong> Primary Industries and FisheriesBlakely Paynter, Department <strong>of</strong> Agriculture and Food, Western AustraliaGra<strong>in</strong>s Research and Development Corporation, CanberraV<strong>in</strong>ce Fernandes, Bus<strong>in</strong>ess <strong>An</strong>alystLeecia <strong>An</strong>gus, Manager, Wheat & <strong>Barley</strong> Breed<strong>in</strong>g12 ReferencesABARE (2006). “Australian Commodity Statistics 2007”, Canberra.ABARE (2008). Crop Report, June 2008.AGTRANS (2007a). “<strong>An</strong> <strong>Economic</strong> <strong>An</strong>alysis <strong>of</strong> <strong>Investment</strong> <strong>in</strong> Cereal Rust Control”.A Report to GRDC.AGTRANS (2007b). “<strong>An</strong> <strong>Economic</strong> <strong>An</strong>alysis <strong>of</strong> <strong>Investment</strong> <strong>in</strong> Breed<strong>in</strong>g <strong>of</strong> ‘Other’Cereal Crops”. A Report to GRDC.BBA Advisory Board (2007). “<strong>Barley</strong> Breed<strong>in</strong>g Australia National Plan 2006-2009”. <strong>Barley</strong> Breed<strong>in</strong>g Australia.<strong>Barley</strong> Australia (2008). List<strong>in</strong>g <strong>of</strong> accredited barley varieties,www.barleyaustralia.com.auBrennan, J.P. and Bialowas, A. (2001) “Changes <strong>in</strong> Characteristics <strong>of</strong> NSW WheatVarieties”, 1965-1997, <strong>Economic</strong> Research Report No. 8, NSW Agriculture, WaggaWagga.Brennan, J., Mart<strong>in</strong>, P., and Mullen, J. (2004). “<strong>An</strong> Assessment <strong>of</strong> the <strong>Economic</strong>,Environmental and Social Impacts <strong>of</strong> NSW Agriculture’s Wheat Breed<strong>in</strong>gProgram”. NSW Agriculture, Orange. <strong>Economic</strong> Research Report No. 17.Clements, R., Rosielle, A., and Hilton, R. (1992). “National Review <strong>of</strong> CropImprovement <strong>in</strong> the Australian Gra<strong>in</strong>s Industry”. GRDC.- 28 -
CSIRO and Bureau <strong>of</strong> Meteorology (2007). “Climate Change <strong>in</strong> Australia”:Technical Report 2007, CSIRO, Melbourne.Davidson, B. (1962). “Crop yields <strong>in</strong> experiments and on farms”. Nature 194, 458– 459.Edwards, A. (2008) Farm Weekly Budget Guide (p48) -http://fw.farmonl<strong>in</strong>e.com.au/budget/ Agriculture Western AustraliaFarquharson, R. and Griffith, G. (2001). “S<strong>in</strong>gle Desk Sell<strong>in</strong>g by the NSW Gra<strong>in</strong>sBoard: Public Benefit or Public Cost?”. Agribus<strong>in</strong>ess Review Vol. 9 2001, Paper 6Fellowes R. (2005). “<strong>Barley</strong> Bus<strong>in</strong>ess Plan”. Report to the <strong>Barley</strong> Steer<strong>in</strong>gCommittee.Gali, V. and Brown, C. (2002). “Price Relationships <strong>in</strong> the Queensland <strong>Barley</strong>Market”. Agribus<strong>in</strong>ess, Vol. 18 (2) 181–196 (2002)GRDC (1992) “Ga<strong>in</strong>s for Gra<strong>in</strong>s – Overview”. Vol 1, GRDC CanberraGRDC (2000) “<strong>An</strong>nual Report, 1999-2000.” GRDC Canberra.GRDC (2007). <strong>An</strong>nual Report 2006-07. GRDC, Canberra.Gunasekera, D., Yeon Kim, Tulloh. C., Ford, M. (2007) “Climate Change -ImpactsOn Australian Agriculture” Australian Commodities Vol. 14 No. 4, DecemberQuarter 2007.Hafi , A. and Connell, P. (2003) “Feed Gra<strong>in</strong>s: Future Supply and Demand<strong>in</strong> Australia”, ABAREHowden, S.M., Gifford, R.G. and Me<strong>in</strong>ke, H. (2008). “Gra<strong>in</strong>s”. In <strong>An</strong> overview <strong>of</strong>climate change adaptation <strong>in</strong> Australian primary <strong>in</strong>dustries – impacts, options andpriorities, Edited by C.J. Stokes & S.M. Howden CSIRO. p44-70, Report preparedfor the National Climate Change Research Strategy for Primary Industries.Lawrance, L., Barrett, D., Bragatheswaran, G. and O’Donnell, V. (2008). “Outlookfor wheat, coarse gra<strong>in</strong>s and oilseeds to 2012-13”. Australian Commodities vol 15no.1. ABARE Canberra.NSW DPI (2008). Farm Enterprise Budget Series, New South Wales Department<strong>of</strong> Primary Industries.Oborne, G. and Jervois, K (1993). “Breed<strong>in</strong>g special purpose oat cultivars withresistance and tolerance to cereal cyst nematode”. In Ga<strong>in</strong>s for Gra<strong>in</strong>s Vol 2 CaseStudies, p49-53. GRDC, Canberra.Paynter, B., Hills, A. and Russell, J. (2008). <strong>Barley</strong> variety and agronomy options.Department <strong>of</strong> Agriculture and Food, Western Australia.Sparrow, D. and Buckby, M. (1993). “Selection <strong>of</strong> one disease-resistant barleyvariety,” In Ga<strong>in</strong>s for Gra<strong>in</strong>s Vol 2 Case Studies, p120-124. GRDC, Canberra.Stephens D. (2003).”National and regional assessments <strong>of</strong> crop yield trends andwater use efficiencies”. Proceed<strong>in</strong>gs <strong>of</strong> the Australian Agronomy Conference 2003.- 29 -
Wheeler, R. (2008). “<strong>Barley</strong> variety sow<strong>in</strong>g guide 2008”, Factsheet FS 7/86/008.SARDI.Wilson,W.W. (1984). “Hedonic prices <strong>in</strong> the malt<strong>in</strong>g barley market”. WesternJournal <strong>of</strong> Agricultural <strong>Economic</strong>s. 9 (1):pp 29-40.- 30 -


