420 P. Majumdar et al. / Materials Science and Engineering A 489 (2008) 419–425forged Ti–29Nb–13Ta–4.6Zr (wt.%) alloy and concluded thatthe Young’s <strong>modulus</strong> <strong>of</strong> ′′ martensite is comparable with phase. Saito et al. [24] have reported that cold working substantiallydecreases the elastic <strong>modulus</strong> and increases the yieldstrength <strong>of</strong> Ti–23Nb–0.7Ta–2Zr–O alloy, though the reasons forthis decrease in the elastic <strong>modulus</strong> has not been discussed indetail. Munuera et al. [25] have investigated the <strong>nano</strong>scale surfaceelasticity <strong>of</strong> three different <strong>titanium</strong> <strong>alloys</strong> (Ti–7Nb–6Al,Ti–13Zr–13Nb and Ti–15Zr–4Nb) in their as received state andafter oxidation treatment using force microscopy mode in scanningforce microscopy and reported that the Young’s <strong>modulus</strong> <strong>of</strong>the sample surface was below 65 GPa and was as low as 20 GPafor some oxidized samples. The values were related to the ratio<strong>of</strong> the amount <strong>of</strong> and phases in the as received samples aswell as to different chemical composition <strong>of</strong> the outer layersobtained after different oxidation treatment.With the above background in mind, present investigationwas undertaken to prepare and characterize ‘near ’ and‘metastable ’ <strong>titanium</strong> <strong>alloys</strong> with no toxic alloying elements.Particular emphasis was laid on measuring the elastic <strong>modulus</strong><strong>of</strong> the <strong>alloys</strong> and correlate it with the microstructure. The elastic<strong>modulus</strong> <strong>of</strong> the <strong>alloys</strong> was measured <strong>by</strong> ultrasonic method as wellas <strong>by</strong> <strong>nano</strong>-indentation technique and the values obtained fromthese two techniques are compared in the light <strong>of</strong> microstructuralvariations. In addition, the elastic <strong>modulus</strong> <strong>of</strong> cp-Ti wasalso measured for comparison <strong>of</strong> the elastic <strong>modulus</strong> <strong>of</strong> variousphases. Cp-Ti is expected to show a homogenous microstructureand therefore it was also used as a ‘standard’ material to examinethe effectiveness <strong>of</strong> <strong>nano</strong>-indentation technique to measurethe elastic <strong>modulus</strong>.1.1. Measurement <strong>of</strong> <strong>modulus</strong> <strong>of</strong> elasticityYoung’s Modulus <strong>of</strong> <strong>Elastic</strong>ity is defined as the ratio <strong>of</strong> stress(force per unit area) to corresponding strain (deformation) in theelastic region <strong>of</strong> deformation <strong>of</strong> a material loaded under tensionor compression. This basic material property is <strong>of</strong> interest inmany manufacturing and research applications and is relatedto the atomic bonding <strong>of</strong> the materials. In case <strong>of</strong> biomaterialsfor load bearing applications, the elastic <strong>modulus</strong> is an importantparameter. The stiffness mismatch between implant material andsurrounding bone leads to ‘stress shielding’ <strong>of</strong> the bone. Higherstiffness or Young <strong>modulus</strong> <strong>of</strong> the implant will result in a greateramount <strong>of</strong> bone loss, bone fracture and loss <strong>of</strong> bone interface.Also, loss <strong>of</strong> bone due to stress shielding effects makes revisionsurgeries more difficult. Finite element analysis has suggestedthat a low elastic <strong>modulus</strong> hip prosthesis can stimulate betterbone growth <strong>by</strong> distributing the stress to the adjacent bone tissue[26–29]. The elastic <strong>modulus</strong> <strong>of</strong> the materials can be determined<strong>by</strong> different methods, such as ultrasonic and <strong>nano</strong>-indentationtechniques.Nano-indentation is a technique for determining both theelastic and plastic properties <strong>of</strong> the materials at a <strong>nano</strong>scale levelin a single experiment where no special sample preparation isrequired (however, a good surface finish is needed). In <strong>nano</strong>indentation,the indentation process is continuously monitoredwith respect to force, displacement and time. The reduced elastic<strong>modulus</strong>, E r , is defined as [30,31]:√ π 1E r = √ (1.1)2C Acwhere A c is the projected contact area and C is the contact compliancebetween the indenter and the sample, equal to the tangentto the force–displacement curve during unloading at maximumload F max after correction for frame compliance:C = C t − C f = dh(1.2)dFwhere C t is the total compliance, C f the frame compliance, Fthe force and h is the displacement.Finally,1E r= 1 − υ2 sE s+ 1 − υ2 iE i(1.3)where υ s and υ i , E s and E i are Poisson’s ratios and elastic moduli<strong>of</strong> the sample and indenter, respectively.Velocity <strong>of</strong> the ultrasonic waves in a solid medium is directlyrelated to the elastic properties and density <strong>of</strong> the material. Theelasticity <strong>of</strong> the material delays the transmission <strong>of</strong> wave andintroduces a time delay, i.e. a phase lag. When the frequency<strong>of</strong> the wave is higher than the audible range, it is called elasticwave or ultrasound. Two types <strong>of</strong> vibration-induced deformationresulting in compression or shear are generally possible in aninfinite medium. These are associated with two modes <strong>of</strong> elasticwave propagation, i.e. longitudinal waves, where particles aredisplaced along the direction <strong>of</strong> propagation, and transverse orshear waves, where the particles are displaced perpendicular tothe direction <strong>of</strong> propagation. The velocity <strong>of</strong> propagation <strong>of</strong> theelastic waves in a body is characteristics <strong>of</strong> the material [32].Ultrasonic waves are generated in the material <strong>by</strong> a transmitteroscillating at the desired waveform and frequency, withcollection <strong>by</strong> a detector. Ultrasonic velocity changes have beendetermined <strong>by</strong> time-<strong>of</strong>-flight measurements using a pulse-echomethod. The relationships between ultrasonic velocity and theelastic properties <strong>of</strong> materials are given below [33–35].Young’s <strong>modulus</strong> (E) is expressed asE = ρV S 2(3V L 2 − 4V S 2)VL 2 − V S2 (1.4)Shear <strong>modulus</strong> (G) is the ratio <strong>of</strong> shearing stress τ to shearingstrain γ within the proportional limit <strong>of</strong> a material and isexpressed asG = ρV 2 S (1.5)whereas, Poisson’s ratio υ is the ratio <strong>of</strong> transverse contractionstrain to longitudinal extension strain in the direction <strong>of</strong>stretching force and is expressed as = (1/2)(V L 2 − 2V S 2)VL 2 − V S2 (1.6)In the above set <strong>of</strong> equations, V L and V S are the ultrasoniclongitudinal and shear wave velocities, respectively, and ρ is thedensity <strong>of</strong> the material.
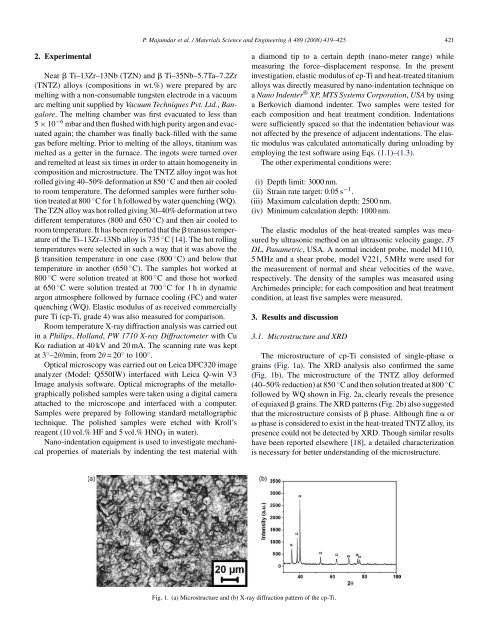
P. Majumdar et al. / Materials Science and Engineering A 489 (2008) 419–425 4212. ExperimentalNear Ti–13Zr–13Nb (TZN) and Ti–35Nb–5.7Ta–7.2Zr(TNTZ) <strong>alloys</strong> (compositions in wt.%) were prepared <strong>by</strong> arcmelting with a non-consumable tungsten electrode in a vacuumarc melting unit supplied <strong>by</strong> Vacuum Techniques Pvt. Ltd., Bangalore.The melting chamber was first evacuated to less than5 × 10 −6 mbar and then flushed with high purity argon and evacuatedagain; the chamber was finally back-filled with the samegas before melting. Prior to melting <strong>of</strong> the <strong>alloys</strong>, <strong>titanium</strong> wasmelted as a getter in the furnace. The ingots were turned overand remelted at least six times in order to attain homogeneity incomposition and microstructure. The TNTZ alloy ingot was hotrolled giving 40–50% deformation at 850 ◦ C and then air cooledto room temperature. The deformed samples were further solutiontreated at 800 ◦ C for 1 h followed <strong>by</strong> water quenching (WQ).The TZN alloy was hot rolled giving 30–40% deformation at twodifferent temperatures (800 and 650 ◦ C) and then air cooled toroom temperature. It has been reported that the transus temperature<strong>of</strong> the Ti–13Zr–13Nb alloy is 735 ◦ C [14]. The hot rollingtemperatures were selected in such a way that it was above the transition temperature in one case (800 ◦ C) and below thattemperature in another (650 ◦ C). The samples hot worked at800 ◦ C were solution treated at 800 ◦ C and those hot workedat 650 ◦ C were solution treated at 700 ◦ C for 1 h in dynamicargon atmosphere followed <strong>by</strong> furnace cooling (FC) and waterquenching (WQ). <strong>Elastic</strong> <strong>modulus</strong> <strong>of</strong> as received commerciallypure Ti (cp-Ti, grade 4) was also measured for comparison.Room temperature X-ray diffraction analysis was carried outin a Philips, Holland, PW 1710 X-ray Diffractometer with CuK radiation at 40 kV and 20 mA. The scanning rate was keptat 3 ◦ –2θ/min, from 2θ =20 ◦ to 100 ◦ .Optical microscopy was carried out on Leica DFC320 imageanalyzer (Model: Q550IW) interfaced with Leica Q-win V3Image analysis s<strong>of</strong>tware. Optical micrographs <strong>of</strong> the metallographicallypolished samples were taken using a digital cameraattached to the microscope and interfaced with a computer.Samples were prepared <strong>by</strong> following standard metallographictechnique. The polished samples were etched with Kroll’sreagent (10 vol.% HF and 5 vol.% HNO 3 in water).Nano-indentation equipment is used to investigate mechanicalproperties <strong>of</strong> materials <strong>by</strong> indenting the test material witha diamond tip to a certain depth (<strong>nano</strong>-meter range) whilemeasuring the force–displacement response. In the presentinvestigation, elastic <strong>modulus</strong> <strong>of</strong> cp-Ti and heat-treated <strong>titanium</strong><strong>alloys</strong> was directly measured <strong>by</strong> <strong>nano</strong>-indentation technique ona Nano Indenter ® XP, MTS Systems Corporation, USA <strong>by</strong> usinga Berkovich diamond indenter. Two samples were tested foreach composition and heat treatment condition. Indentationswere sufficiently spaced so that the indentation behaviour wasnot affected <strong>by</strong> the presence <strong>of</strong> adjacent indentations. The elastic<strong>modulus</strong> was calculated automatically during unloading <strong>by</strong>employing the test s<strong>of</strong>tware using Eqs. (1.1)–(1.3).The other experimental conditions were:(i) Depth limit: 3000 nm.(ii) Strain rate target: 0.05 s −1 .(iii) Maximum calculation depth: 2500 nm.(iv) Minimum calculation depth: 1000 nm.The elastic <strong>modulus</strong> <strong>of</strong> the heat-treated samples was measured<strong>by</strong> ultrasonic method on an ultrasonic velocity gauge, 35DL, Panametric, USA. A normal incident probe, model M110,5 MHz and a shear probe, model V221, 5 MHz were used forthe measurement <strong>of</strong> normal and shear velocities <strong>of</strong> the wave,respectively. The density <strong>of</strong> the samples was measured usingArchimedes principle; for each composition and heat treatmentcondition, at least five samples were measured.3. Results and discussion3.1. Microstructure and XRDThe microstructure <strong>of</strong> cp-Ti consisted <strong>of</strong> single-phase grains (Fig. 1a). The XRD analysis also confirmed the same(Fig. 1b). The microstructure <strong>of</strong> the TNTZ alloy deformed(40–50% reduction) at 850 ◦ C and then solution treated at 800 ◦ Cfollowed <strong>by</strong> WQ shown in Fig. 2a, clearly reveals the presence<strong>of</strong> equiaxed grains. The XRD patterns (Fig. 2b) also suggestedthat the microstructure consists <strong>of</strong> phase. Although fine or phase is considered to exist in the heat-treated TNTZ alloy, itspresence could not be detected <strong>by</strong> XRD. Though similar resultshave been reported elsewhere [18], a detailed characterizationis necessary for better understanding <strong>of</strong> the microstructure.Fig. 1. (a) Microstructure and (b) X-ray diffraction pattern <strong>of</strong> the cp-Ti.