Flexible modelling using basis expansions (Chapter 5) Linear ...
Flexible modelling using basis expansions (Chapter 5) Linear ...
Flexible modelling using basis expansions (Chapter 5) Linear ...

You also want an ePaper? Increase the reach of your titles
YUMPU automatically turns print PDFs into web optimized ePapers that Google loves.
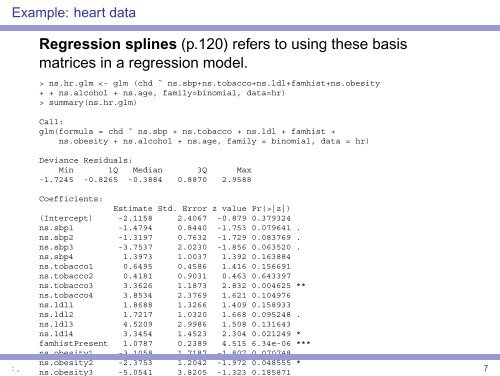
Example: heart dataRegression splines (p.120) refers to <strong>using</strong> these <strong>basis</strong>matrices in a regression model.> ns.hr.glm summary(ns.hr.glm)Call:glm(formula = chd ˜ ns.sbp + ns.tobacco + ns.ldl + famhist +ns.obesity + ns.alcohol + ns.age, family = binomial, data = hr)Deviance Residuals:Min 1Q Median 3Q Max-1.7245 -0.8265 -0.3884 0.8870 2.9588Coefficients:Estimate Std. Error z value Pr(>|z|)(Intercept) -2.1158 2.4067 -0.879 0.379324ns.sbp1 -1.4794 0.8440 -1.753 0.079641 .ns.sbp2 -1.3197 0.7632 -1.729 0.083769 .ns.sbp3 -3.7537 2.0230 -1.856 0.063520 .ns.sbp4 1.3973 1.0037 1.392 0.163884ns.tobacco1 0.6495 0.4586 1.416 0.156691ns.tobacco2 0.4181 0.9031 0.463 0.643397ns.tobacco3 3.3626 1.1873 2.832 0.004625 **ns.tobacco4 3.8534 2.3769 1.621 0.104976ns.ldl1 1.8688 1.3266 1.409 0.158933ns.ldl2 1.7217 1.0320 1.668 0.095248 .ns.ldl3 4.5209 2.9986 1.508 0.131643ns.ldl4 3.3454 1.4523 2.304 0.021249 *famhistPresent 1.0787 0.2389 4.515 6.34e-06 ***ns.obesity1 -3.1058 1.7187 -1.807 0.070748 .: ,ns.obesity2 -2.3753 1.2042 -1.972 0.048555 *ns.obesity3 -5.0541 3.8205 -1.323 0.1858717