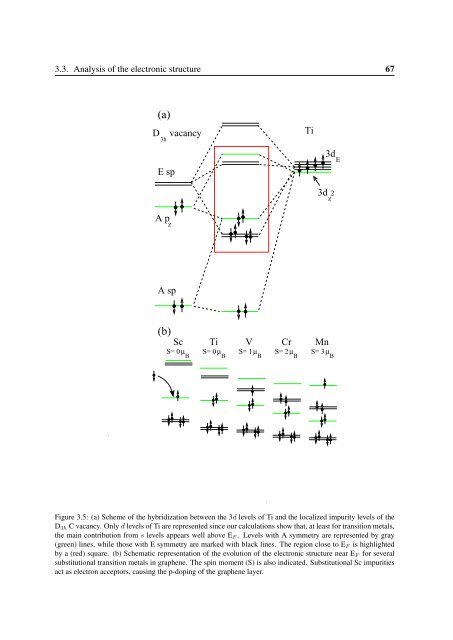
3.3. Analysis of the electronic structure 67(a)D vacancy3hTi3d EE sp3d z2A p zA sp(b)ScTiVCrMnS= 0 µ BS= 0 µ BS= 1 µ BS= 2 µ BS= 3 µ BFigure 3.5: (a) Scheme of the hybridization between the 3d levels of Ti and the localized impurity levels of theD 3h C vacancy. Only d levels of Ti are represented since our calculations show that, at least for transition metals,the main contribution from s levels appears well above E F . Levels with A symmetry are represented by gray(green) lines, while those with E symmetry are marked with black lines. The region close to E F is highlightedby a (red) square. (b) Schematic representation of the evolution of the electronic structure near E F for severalsubstitutional transition metals in graphene. The spin moment (S) is also indicated. Substitutional Sc impuritiesact as electron acceptors, causing the p-doping of the graphene layer.
68Chapter 3. Substitutional Metallic Impurities in Graphene: Structural, Electronic andMagnetic PropertiesAccording to our model there are three localized defect levels with A 1 character and threetwofold-degenerate levels with E character. Two of these E levels correspond to bondingantibondingsp-d pairs, while the third one corresponds to 3d non-bonding states. For Sc-Mnthe three A 1 levels can be pictured as a low lying bonding level with A sp-d z 2 character and abonding-antibonding pair with A p z -d z 2 character.Therefore, as shown in Fig. 3.5 we have four metal-vacancy bonding levels (two A andone doubly-degenerate E levels) that can host up to eight electrons. Ti contributes with fourvalence electrons, and there are four electrons associated with the localized carbon-vacancylevels. Thus, for Ti the bonding states are completely occupied. Consequently, Ti presents thehighest binding energy among all 3d transition metals and has a zero spin moment.The situation for Sc ought to be discussed in detail. As Sc has three valence electrons, inprinciple we could expect an incomplete filling of the metal-vacancy bonding levels and a spinmoment of ∼1 µ B . However, in our model the highest bonding state (with A p z -d z 2 character)appears below E F and the Sc impurity can act as an acceptor impurity. Our calculations showthat this is indeed the case. The Sc-vacancy p z -d z 2 impurity level captures an electron fromthe extended states of the graphene layer which becomes p-doped. In total, the substitutionalSc-graphene system does not show any spin polarization.We can now contrast the expectations from our model with actual calculations. Figure 3.6shows the band structure of Sc (a) and Ti (b) close to the E F . As expected, the main contributionfrom the 3d shell is found above E F . Below E F we find one defect band with p z -d z 2character and two bands (degenerate at Γ) with sp-d character. These bands are in close correspondencewith the bonding A and E levels appearing in our model. In the case of Ti theE F is located inside a gap of ∼0.5 eV that opens at K point in the Brillouin zone. This gapappears due to the relatively small 4×4 supercell used in these calculations and is reducedwhen larger supercells are used. Thus, the filling of the graphene extended bands is not appreciablychanged by substitutional doping with Ti. For Sc the situation is different. As shown inFig. 3.6 (a) E F moves away from the K point, the Sc-vacancy complex captures one electronand the graphene layer becomes doped with holes.Regarding the unoccupied bands, the 3d contribution for Sc above E F appears quite broadeneddue to the strong hybridization with the graphene states. Indeed, the defect levels aresomewhat difficult to identify and to correlate with our model. One exception is a flat bandwith strong d z 2 character appearing at ∼1.5 eV that, due to its symmetry, does not coupleso efficiently with the host states. The case of Ti is much easier to interpret in terms of thesimplified model presented in Fig. 3.5 (a). In particular, we can find two bands at ∼0.6 eVwith strong d xy and d x 2 −y2 contribution that correspond with the non-bonding d impurity levels,and one band with d z 2 character at ∼0.8 eV corresponding with the A p z -d z 2 antibondinglevel. Around 2.6 eV we can also find the two E sp-d antibonding defect levels, although inthis case much more hybridized with the host.3.3.2 V, Cr and Mn: 3d magnetismAs we have seen above, the metal-vacancy bonding levels are completely filled for substitutionalSc and Ti and, as a consequence, the spin moment associated with these impurities iszero. However, following our model in Figures 3.5 (a) and (b), as we move along the transitionmetal series the number of valence electrons increases and the non-bonding 3d impurity statesstart to become occupied. Hence, due to the strong atomic character and localization of these