07 CAFR cover FINAL.p65 - WMATA.com
07 CAFR cover FINAL.p65 - WMATA.com
07 CAFR cover FINAL.p65 - WMATA.com
- No tags were found...

Create successful ePaper yourself
Turn your PDF publications into a flip-book with our unique Google optimized e-Paper software.
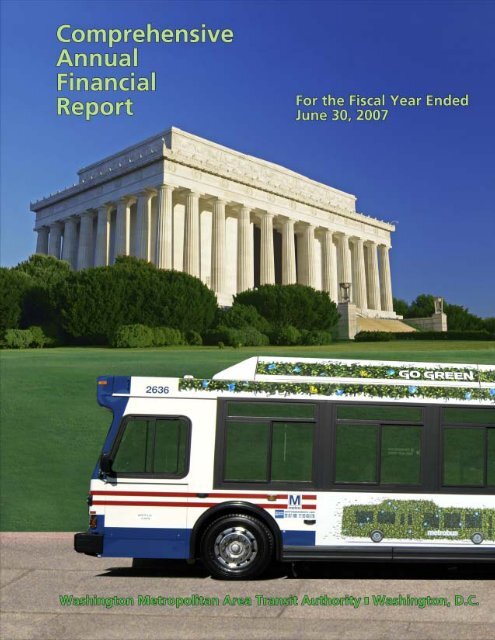
Washington Metropolitan Area Transit AuthorityFY 20<strong>07</strong> Comprehensive Annual Financial ReportVisionThe Best Ride in the NationMissionAuthority provides the nation’s best transit serviceto our customers andimproves the quality of life inthe Washington metropolitan areaValuesSafety and SecurityProfessionalismIntegrityContinuous ImprovementRespect for AllGoalsRetain and Attract the Best and BrightestCreate a Safety CultureDeliver Quality ServiceUse Every Resource WiselyMaintain and Enhance Authority’s Image
Washington Metropolitan Area Transit AuthorityFY 20<strong>07</strong> Comprehensive Annual Financial ReportComprehensive Annual Financial ReportYear Ended June 30, 20<strong>07</strong>Table of ContentsSECTION ONE - INTRODUCTORY(Unaudited)Letter of Transmittal 1Board of Directors 5Agency Oversight 6Organizational Chart and Officers 7Certificate of Achievement for Excellence in Financial Reporting 8SECTION TWO - FINANCIALIndependent Auditors' Report 9Management’s Discussion and Analysis 11Financial Statements:Statement of Net Assets 21Statements of Revenues, Expenses and Changes inNet Assets 23Statements of Cash Flows 24Notes to Financial Statements 26Required Supplementary InformationSchedules of Funding Progress 52SECTION THREE - STATISTICAL(Unaudited)Net Assets by Component 53Changes in Net Assets 54Principal Revenue Pay Categories 55Passenger Fare Structure 56Pledged-Revenue Coverage 57Ten Major Private Employers 58Authorized Employee Positions 59Operating Indicators 60Metrorail System Map 61
Washington Metropolitan Area Transit AuthorityFY 20<strong>07</strong> Comprehensive Annual Financial ReportSECTION ONE – INTRODUCTORY (Unaudited)Letter of TransmittalBoard of DirectorsAgency OversightOrganizational Chart and OfficersCertificate of Achievement for Excellence in Financial Reporting
Washington Metropolitan Area Transit AuthorityFY 20<strong>07</strong> Comprehensive Annual Financial ReportProfile of the AuthorityThe Authority was created on February 20, 1967 by an interstate <strong>com</strong>pact (the Compact) throughlegislation passed by the District of Columbia, the State of Maryland, the Commonwealth of Virginia andthe U.S. Congress. The Authority‘s purpose is to plan, build, finance and operate a balancedtransportation system in the National Capital area. In fulfillment of this goal, the Authority provides theregion with three coordinated types of transportation services: rail (Metrorail), bus (Metrobus) andparatransit (MetroAccess).Construction of the Metrorail system began in December 1969. Later, by February 1973, four area bus<strong>com</strong>panies were acquired forming the basis for the Metrobus system. And in May 1994, MetroAccess,the curb-to-curb service for mobility impaired passengers, began operation.On January 13, 2001, the Authority <strong>com</strong>pleted the original 103-mile Metrorail system with the opening ofthe 6.5 miles extension of the Green Line from Anacostia to Branch Avenue. And in the second quarterof fiscal year 2005, three Metrorail stations and approximately 3.2 miles of track were added to theMetrorail system resulting in a total of 86 stations and approximately 106.1 miles of track.The Authority serves a population of approximately 3.4 million within a 1,500-square–mile area. Its transitzone consists of the District of Columbia, the suburban Maryland counties of Montgomery and PrinceGeorge’s and the Northern Virginia counties of Arlington, Fairfax and Loudoun, as well as the NorthernVirginia cities of Alexandria, Falls Church, Fairfax, Manassas and Manassas Park.Metrorail carries the second largest number of passengers and Metrobus carries the fifth largest numberof passengers in the nation.Change in MissionAfter 40 years, the Authority mission has changed. The Authority will focus on operating the best transitsystem in the nation and the building will be done by others to the Authority’s specifications.Organizational StructureThe Authority is governed by a board of six Directors and six Alternates, <strong>com</strong>posed of two Directors andtwo Alternates from the states of Maryland and Virginia, and the District of Columbia. The Board ofDirectors (Board) determines policy for the Authority.Subject to policy direction and delegations from the Board, the General Manager (GM) is responsible forall activities and functions of the Authority. The GM directs staff in implementing and carrying outprograms and initiatives of the Authority.BudgetThe Authority’s annual budget serves as the foundation for its financial planning and control. The GM andstaff prepare and submit the budget to the Board for approval. The budget is divided in two broadcategories: operating and capital costs.It is the responsibility of each cost center to administer its operation in such a manner to ensure that theuse of the funds is consistent with the goals and programs authorized by the Board and that approvedspending levels are not exceeded.For fiscal year 20<strong>07</strong>, the Authority had an approved budget of $1.89 billion with the largest portion, $1.13billion, including debt service, dedicated to operating the system. The budget contained approximately11,000 authorized staff positions.2
Washington Metropolitan Area Transit AuthorityFY 20<strong>07</strong> Comprehensive Annual Financial ReportEconomic ConditionLocal EconomyThe Authority is located in the nation’s capital and therefore, its operation is influenced by the economicconditions of the District of Columbia and the surrounding jurisdictions.The economy of the District of Columbia and the greater economy of the Washington Metropolitan area,for the past several years, grew at an uneven pace. The District of Columbia’s economy is now growingat a below average pace, reflecting the slowdown in government spending that began over a year ago.From the late 1999 through the middle of 2003, the District outperformed the nation as federalgovernment activity shielded the economy from the worst of the national slowdown. Of late, it has gottenless of a boost as government spending started to slow. In the past year, government payrolls, whichmake up one-third of all employment in the District, was the largest impediment on growth, because aslowdown in government spending drove a slow-down in government payrolls.Employment growth in the District has matched the national average, although, it lagged substantiallybehind the Washington metropolitan region. Although only a tiny segment of the economy, the Districtcontinues to loose manufacturing jobs, and recent months has seen a slowdown in construction jobs, alikely result of the slowdown in the residential real estate market.Although, the unemployment rate in the District remains well above the national average, it has been on astrong downward trend for nearly three years. Private service-producing payrolls are the main engine ofgrowth in the District. Also, the new DC Convention Center has been a key factor in the re<strong>cover</strong>y of theleisure and hospitality industry in the District since 2005, as well, as the redefining of downtown District’sentertainment and office areas.Long-term Financial PlanningThe Authority and the local jurisdictions developed and executed a formal long-range <strong>com</strong>prehensivefunding agreement for capital improvements, <strong>com</strong>monly called known as “Metro Matters”. This is the fouryear of the six-year $4.3 billion Metro Matter program. Metro Matters uses a pay-as-you-go fundingstrategy and has the following six main <strong>com</strong>ponents:• Infrastructure Renewal Program: including Metrorail and Metrobus maintenanceand rehabilitation,• Rail Car Program: including purchase of new rail cars, the upgrade of power andsignal systems required for eight-car train operations and modifications tofacilities to create additional maintenance capacity for fleet expansion,• Bus Program: including purchase of advanced technology buses to addressovercrowding, regional bus stop database, maps and stop improvements, andanalysis of future service requirements,• Security Program: including providing a continuity of operations, mainly in theform of a alternative operations control center• System Expansion Program: including providing for future investments,• Credit facility: including providing funds as required.3
Washington Metropolitan Area Transit AuthorityFY 20<strong>07</strong> Comprehensive Annual Financial Report5
Washington Metropolitan Area Transit AuthorityFY 20<strong>07</strong> Comprehensive Annual Financial Report6
Washington Metropolitan Area Transit AuthorityFY 20<strong>07</strong> Comprehensive Annual Financial Report7
_________________________________________________This Page Intentionally Left Blank________________________________ _________________
Washington Metropolitan Area Transit AuthorityFY 20<strong>07</strong> Comprehensive Annual Financial ReportSECTION TWO - FINANCIALIndependent Auditors’ ReportManagement’s Discussion and AnalysisBasic Financial Statements:Statement of Net AssetsStatements of Revenues, Expenses, and Changes inNet AssetsStatements of Cash FlowsNotes to Financial StatementsRequired Supplementary InformationSchedules of Funding Progress
KPMG LLP2001 M Street, NWWashington, DC 20036Independent Auditor’s ReportTo the Board of DirectorsWashington Metropolitan Area Transit Authority:We have audited the ac<strong>com</strong>panying statement of net assets of the Washington Metropolitan Area TransitAuthority (Authority) as of June 30, 20<strong>07</strong> and 2006, and the related statements of revenues, expenses andchanges in net assets, and cash flows for the years then ended. These financial statements are theresponsibility of the Authority’s management. Our responsibility is to express an opinion on these basicfinancial statements based on our audits.We conducted our audits in accordance with auditing standards generally accepted in the United States ofAmerica and the standards applicable to financial audits contained in Government Auditing Standards,issued by the Comptroller General of the United States. Those standards require that we plan and performthe audit to obtain reasonable assurance about whether the financial statements are free of materialmisstatement. An audit includes consideration of internal control over financial reporting as a basis fordesigning audit procedures that are appropriate in the circumstances, but not for the purpose of expressingan opinion on the effectiveness of the Authority’s internal control over financial reporting. Accordingly,we express no such opinion. An audit also includes examining, on a test basis, evidence supporting theamounts and disclosures in the financial statements, assessing the accounting principles used andsignificant estimates made by management, as well as evaluating the overall financial statementpresentation. We believe that our audits provide a reasonable basis for our opinion.In our opinion, the financial statements referred to above present fairly, in all material respects, thefinancial position of the Authority, as of June 30, 20<strong>07</strong> and 2006 and the changes in its financial positionand cash flows for the year then ended in conformity with U.S. generally accepted accounting principles.In accordance with Government Auditing Standards, we have also issued our report dated September 28,20<strong>07</strong> on our consideration of the Authority’s internal control over financial reporting and on our tests of its<strong>com</strong>pliance with certain provisions of laws, regulations, contracts, and grant agreements, and other matters.The purpose of that report is to describe the scope of our testing of internal control over financial reportingand <strong>com</strong>pliance and the results of that testing, and not to provide an opinion on the internal control overfinancial reporting or on <strong>com</strong>pliance. That report is an integral part of an audit performed in accordancewith Government Auditing Standards and should be considered in assessing the results of our audits.KPMG LLP, a U.S. limited liability partnership, is the U.S.member firm of KPMG International, a Swiss cooperative.
The Management’s Discussion and Analysis and Required Supplementary Information on pages 11through 20 and 52 are not a required part of the basic financial statements but are supplementaryinformation required by U.S. generally accepted accounting principles. We have applied certain limitedprocedures, which consisted principally of inquiries of management regarding the methods of measurementand presentation of the required supplementary information. However, we did not audit the informationand express no opinion on it.Our audit was conducted for the purpose of forming an opinion on the financial statements that <strong>com</strong>prisethe Authority’s basic financial statements. The ac<strong>com</strong>panying introductory section and statistical tables arepresented for the purpose of additional analysis and are not a required part of the basic financial statements.The introductory section and statistical tables have not been subjected to the auditing procedures applied inthe audit of the basic financial statements and, accordingly, we express no opinion on them.September 28, 20<strong>07</strong>
Washington Metropolitan Area Transit AuthorityFY 20<strong>07</strong> Comprehensive Annual Financial ReportManagement’s Discussion and AnalysisAs management of the Washington Metropolitan Area Transit Authority (Authority), we offer readers of the basicfinancial statements this narrative overview and analysis of the financial activities of the Authority as of June 30,20<strong>07</strong>, 2006 and 2005 and for the years ended June 30, 20<strong>07</strong> and 2006. This discussion and analysis is designedto assist the reader in focusing on significant financial issues and activities and to identify any noteworthychanges in financial position. We encourage readers to consider the information presented here in conjunctionwith the basic financial statements taken as a whole.Fiscal Year 20<strong>07</strong> Financial Highlights• Capital assets increased by $97.7 million or 1.2 percent, largely attributable to bus purchases, facilitiesenhancements and rail rehabilitation.• Noncurrent liabilities decreased by $60.5 million or 3.7 percent, largely due to bond repayments anddecreases in outstanding lease agreement obligations.• Operating revenues increased by $17.6 million or 2.9 percent, due to an increase in ridership. Specialevents such as Washington area capital events, sporting events, as well as an increase in gas prices allcontributed to the increase in revenue and ridership.• Operating expenses increased by $145.0 million or 9.9 percent, due primarily to an increase in labor costto <strong>cover</strong> vacancies, system maintenance cost, and additional safety and security activities. The costassociated with the increase use of the Authority’s paratransit service and rising fuel cost also contributedto this increase.Overview of the Basic Financial StatementsThis required annual report consists of three parts: Management’s Discussion and Analysis, Basic FinancialStatements and Required Supplementary Information. The basic financial statements also include notes thatprovide in more detail some of the information in the basic financial statements.Basic Financial Statements. The Authority’s basic financial statements are prepared in conformity withaccounting principles generally accepted in the United States of America (GAAP) as applied to an enterpriseusing the accrual basis of accounting. Under this basis, revenues are recognized in the period in which they areearned, and expenses are recognized in the period in which they are incurred.The Authority’s basic financial statements are the Statements of Net Assets, the Statements of Revenues,Expenses and Changes in Net Assets and the Statements of Cash Flows.The Statements of Net Assets report the Authority’s net assets. Net assets, the difference between assets andliabilities, are one way to measure the financial position of the Authority. This is only one measure, however, andthe reader should consider other indicators, such as the rate of growth of operating subsidies, passenger farelevels, ridership, general economic conditions in the metropolitan area and the age and condition of capital assetsused by the Authority.The Statements of Revenues, Expenses and Changes in Net Assets report all of the revenues earned andexpenses incurred during the reporting periods.The Statements of Cash Flows provide information on cash receipts and cash payments during the reportingperiods.The basic financial statements can be found on pages 21-26 of this report.11
Washington Metropolitan Area Transit AuthorityFY 20<strong>07</strong> Comprehensive Annual Financial ReportManagement’s Discussion and AnalysisOverview of the Basic Financial Statements (Continued)Notes to the Basic Financial Statements. The notes provide additional information that is essential to a fullunderstanding of the data provided in the basic financial statements. The notes to the basic financial statementscan be found on pages 27- 51 of this report.Required Supplementary Information. In addition to the basic financial statements and ac<strong>com</strong>panying notes,this report also presents certain required supplementary information concerning the Authority’s progress infunding its obligation to provide pension benefits to its employees. Required supplementary information can befound on page 52 of this report.Financial AnalysisStatements of Net AssetsAs noted earlier, net assets may serve over time as an indicator of the Authority’s financial position. This is onlyone measure; however, the reader should consider other indicators, such as the age and condition of theAuthority’s three-decade system, as well as its need for increasing operating subsidies and ridership levels. Thefollowing table provides an overview of the Authority’s financial position for the years ended June 30, 20<strong>07</strong>, 2006and 2005:Table 1Condensed Statements of Net AssetsJune 30, 20<strong>07</strong>, 2006 and 2005(in thousands)20<strong>07</strong> 2006 2005Current and other assets $2,270,758 $2,351,726 $ 2,485,329Capital assets 8,234,163 8,136,494 7,800,188Total assets 10,504,921 10,488,220 10,285,517Current liabilities 767,616 552,638 444,055Noncurrent liabilities 1,591,253 1,651,760 1,721,722Total liabilities 2,358,869 2,204,398 2,165,777Net assets:Investment in capital assets, net ofrelated debt 7,880,168 7,904,568 7,547,065Restricted 265,884 379,254 572,675Total net assets $ 8,146,052 $ 8,283,822 $ 8,119,740Current YearNet assets decreased by $137.7 million or 1.7 percent during the current fiscal year, due to an increase inspending for capital expenditures and the method of jurisdictional funding for such capital expenditures.The largest portion of the Authority’s net assets, $7.9 billion or 96.7 percent, reflects its investment in capitalassets (e.g., land, buildings, transit facilities and revenue vehicles), less any related debt used to12
Washington Metropolitan Area Transit AuthorityFY 20<strong>07</strong> Comprehensive Annual Financial ReportStatements of Net Assets (Continued)Current Year (Continued)Management’s Discussion and Analysisacquire those assets. The Authority uses these capital assets to provide public transportation services for themetropolitan area. Consequently, these assets are not available for future spending. Although the Authority’sinvestment in its capital assets is reported net of related debt, it should be noted that the resources needed torepay this debt must be provided from other sources, since the capital assets themselves cannot be used toliquidate these liabilities.A portion of the Authority’s net assets, $265.9 million or 3.3 percent, represents resources that are subject toexternal restrictions set by the governing jurisdictions. Restricted net assets include advance contributions forfuture construction, reimbursable projects and other targeted programs.Capital assets increased by $97.7 million or 1.2 percent, largely attributable to bus purchases, facilitiesenhancements and rail rehabilitation.Current liabilities increased by $215.0 million or 38.9 percent, mainly due to the issuance of <strong>com</strong>mercial papernotes for the purpose of funding Metro Matters.Noncurrent liabilities decreased by $60.5 million or 3.7 percent, largely due to bond repayments and decreases inoutstanding lease agreement obligations.Prior YearNet assets increased by $164.1 million or 2.0 percent during the current fiscal year, due mainly to an increase incapital contributions that were used to fund facility enhancements and rehabilitations, and purchase oftransportation vehicles.The largest portion of the Authority’s net assets, $7.9 billion or 95.4 percent, reflects its investment in capitalassets (e.g., land, buildings, transit facilities and revenue vehicles), less any related debt used to acquire thoseassets. The Authority uses these capital assets to provide public transportation services for the metropolitanarea. Consequently, these assets are not available for future spending. Although the Authority’s investment in itscapital assets is reported net of related debt, it should be noted that the resources needed to repay this debt mustbe provided from other sources, since the capital assets themselves cannot be used to liquidate these liabilities.A portion of the Authority’s net assets, $379.3 million or 4.6 percent, represents resources that are subject toexternal restrictions set by the governing jurisdictions. Restricted net assets include advance contributions forfuture construction, reimbursable projects and other targeted programs.Capital assets increased by $336.3 million or 4.3 percent, largely attributable to bus purchases, facilitiesenhancements and rail rehabilitation.Current liabilities increased by $108.6 million or 24.5 percent, mainly due to increases in account payables forpurchases and injury and damage claims.Noncurrent liabilities decreased by $70.0 million or 4.1 percent, largely due to transit bond repayments anddecreases in outstanding lease agreement obligations.Restricted net assets decreased by $193.4 million or 33.8 percent, which is mainly attributable to a reduction inadvance contributions for bus procurement and other reimbursable projects.13
Washington Metropolitan Area Transit AuthorityFY 20<strong>07</strong> Comprehensive Annual Financial ReportManagement’s Discussion and AnalysisStatements of Revenues, Expenses, and Changes in Net AssetsThe following financial information was derived from the Statements of Revenues, Expenses, and Changes in NetAssets and reflects how the Authority’s net assets changed during the fiscal year:Table 2Statements of Revenues, Expenses, and Changes in Net AssetsFor the Years Ended June 30, 20<strong>07</strong>, 2006 and 2005(in thousands)20<strong>07</strong> 2006 2005OPERATING REVENUESPassenger revenue $ 563,356 $ 555,262 $ 522,475Charter and contract revenue 6,767 3,909 3,395Advertising revenue 33,000 30,000 29,000Rental revenue 20,777 17,108 16,466Other revenue 1,192 1,199 1,206Total operating revenues 625,092 6<strong>07</strong>,478 572,542NONOPERATING REVENUESInvestment in<strong>com</strong>e 3,288 3,981 5,011Interest in<strong>com</strong>e from leasing transactions 87,874 88,548 91,924In<strong>com</strong>e from pension plans 16,392 - 16,687Other 12,281 9,413 3,790Total nonoperating revenues 119,835 101,942 117,412Total revenues 744,927 709,420 689,954OPERATING EXPENSESLabor 573,514 536,439 498,865Fringe benefits 302,416 271,577 272,756Services 117,867 102,081 77,063Materials and supplies 144,584 123,439 105,560Utilities 72,286 67,010 61,517Casualty and liability costs 28,223 44,688 16,869Leases and rentals 2,925 3,999 4,096Miscellaneous 3,452 5,205 3,253Depreciation and amortization 361,141 306,955 299,7<strong>07</strong>Total operating expenses 1,606,408 1,461,393 1,339,686NONOPERATING EXPENSESExpense from pension plan - 14,514 -Interest expense 99,712 98,526 102,535Total nonoperating expenses 99,712 113,040 102,535Total expenses 1,706,120 1,574,433 1,442,221Loss before capital grants/subsidies (961,193) (865,013) (752,267)Jurisdictional subsidies:Operations 589,639 546,132 441,949Interest 10,413 11,926 10,611Capital contributions 223,371 471,037 297,208Change in net assets (137,770) 164,082 (2,499)Net assets, beginning of year 8,283,822 8,119,740 8,122,239Net assets, ending of year $ 8,146,052 $ 8,283,822 $ 8,119,74014
Washington Metropolitan Area Transit AuthorityFY 20<strong>07</strong> Comprehensive Annual Financial ReportManagement’s Discussion and AnalysisStatements of Revenues, Expenses, and Changes in Net Assets (Continued)RevenuesCurrent YearTotal revenues for Fiscal Year 20<strong>07</strong> totaled $744.9 million. Operating revenues, which include passengerrevenue, totaled $625.1 million, an increase of $17.6 million or 2.9 percent as described below.Passenger revenue, a significant portion of the Authority’s operating revenues, increased by $8.1 million or 1.5percent. The increase can be attributed to higher ridership, which reached record levels in Fiscal Year 20<strong>07</strong>.Metrorail ridership climbed to a record level of over 2<strong>07</strong> million annual trips for an increase of 1.1 percent.Metrobus ridership grew to 131.5 million annual trips resulting in an increase of 0.5 percent. Sporting events,such as the Washington Redskins and the Washington Nationals home games, and national capital events, suchas the Independence Day Celebration and the Cherry Blossom Festival, contributed to the increase in passengerrevenue and ridership. Additionally, record gas prices and construction or closure of several main roadwaysleading into the District of Columbia also attributed to the increase in annual trips.A strong regional economy and the Authority’s ability to attract and retain riders contributed to higher transitusage. Passenger trips for the last three years are shown below:Passenger Trips(in thousands)35,00030,00025,00020,00015,00010,0005,000FY05 FY06 FY<strong>07</strong>0JulyAugustSeptemberOctoberNovemberDecemberJanuaryFebruaryMarchAprilMayJune15
Washington Metropolitan Area Transit AuthorityFY 20<strong>07</strong> Comprehensive Annual Financial ReportManagement’s Discussion and AnalysisStatements of Revenues, Expenses, and Changes in Net Assets (Continued)Revenues (Continued)Charter and contract revenue for bus increased by $2.9 million or 73.1 percent, primarily due to new contracts forthe DC Circulator, the yellow line to Fort Totten rail service extension, the red line Grosvenor Turnback and theMetro Extra 79 Georgia Avenue bus route.Nonoperating revenues increased by $17.9 million or 17.6 percent, primarily due to in<strong>com</strong>e from pension plans.Capital contributions to the Authority decreased by $247.7 million or 52.6 percent, primarily due to a decrease infunding for transit construction projects.Fiscal Year 20<strong>07</strong> RevenuesCapital contributions14%Subsidies39%Other1%Interest in<strong>com</strong>e7%Rental revenue1%Advertising revenue2%Passenger revenue36%Prior YearTotal revenues, which include passenger revenue, increased by $19.5 million or 2.8 percent. Operating revenuestotaled $6<strong>07</strong>.5 million, as described below.Passenger revenue, a significant portion of the Authority’s operating revenues, increased by $32.8 million or 6.3percent. This increase can be attributed to higher ridership, Washington Nationals games, and the utilization ofparking facilities, including a new garage that opened at the New Carrollton metro station.Metrorail ridership climbed to a record level of over 206 million annual trips for an increase of 5.3 percent.Metrobus ridership grew to 131 million annual trips resulting in an increase of 2.7 percent. Sporting events, suchas the Washington Redskins and the Washington Nationals home games, and national capital events, such asthe Independence Day Celebration and the Cherry Blossom Festival, contributed to the increase in passengerrevenue and ridership. Record gas prices also helped drive this increase.Charter and contract revenue for bus increased by $0.5 million or 15.1 percent, primarily due to increases in newand existing contracts and in special service on the College Park – Bethesda and the Lee Highway – FarragutSquare bus routes.Nonoperating revenues decreased by $15.5 million or 13.2 percent, primarily due to an increase in pension planexpenses.16
Washington Metropolitan Area Transit AuthorityFY 20<strong>07</strong> Comprehensive Annual Financial ReportManagement’s Discussion and AnalysisStatements of Revenues, Expenses, and Changes in Net Assets (Continued)Revenues (Continued)Capital contributions to the Authority increased by $173.8 million or 58.5 percent, primarily due to delayed receiptof prior year federal grants and an increase in Metro Matters jurisdictional billings. Metro Matters is a partnershipbetween the Authority and the Washington metropolitan area jurisdictions to maintain and improve the threedecadeold transit system.ExpensesCurrent YearTotal expenses increased by $131.7 million or 8.4 percent to $1.7 billion in Fiscal Year 20<strong>07</strong> as <strong>com</strong>pared to $1.6billion for Fiscal Year 2006. A review of significant changes in operating expenses is described below.Salaries and benefits increased by $67.9 million or 8.4 percent. Salaries and benefits were driven by contractualwage increases and increased levels of revenue vehicle maintenance and system enhancements. AdditionalTransit Police were added for general safety and security as well as for Washington sporting events, nationalcapital events and festivals.Services increased by $15.8 million or 15.5 percent. Service Expenses were $117.9 million as <strong>com</strong>pared toFiscal Year 2006 with costs of $102.1 million. The increase in costs was primarily driven by the increased usageof MetroAccess, SmartCard service and transportation consultation services.Materials and supplies increased by $21.1 million or 17.1 percent. The steadily increasing cost for fuel accountedfor the largest portion of this increase.Utilities increased by $5.3 million or 7.9 percent, due to increased propulsion usage to operate eight-carpassenger trains and higher natural gas costs.Fiscal Year 20<strong>07</strong> ExpensesLabor/Fringes51%Interest Expense6%Services7%Depreciation andAmortization21%Casualty and Liability2%Utilities4%Materials andSupplies9%17
Washington Metropolitan Area Transit AuthorityFY 20<strong>07</strong> Comprehensive Annual Financial ReportManagement’s Discussion and AnalysisStatements of Revenues, Expenses, and Changes in Net Assets (Continued)Expenses (Continued)Prior YearTotal expenses increased by $132.2 million or 9.2 percent to $1.6 billion in Fiscal Year 2006 as <strong>com</strong>pared to $1.4billion for Fiscal Year 2005. A review of significant changes in operating expenses is described below.Salaries and benefits increased by $36.4 million or 4.7 percent. Salaries and benefits were driven by increasedlevels of overtime for bus and rail personnel to <strong>cover</strong> vacancies. Additional Transit Police were added for generalsafety and security as well as for Washington sporting events, national capital events and festivals.Services increased by $25.0 million or 32.5 percent. Costs were $102.1 million as <strong>com</strong>pared to Fiscal Year 2005with costs of $77.1 million. The increase in costs was primarily driven by the increased usage of MetroAccessand contract services for the DC Circulator bus. The lease buyout of the Authority’s former paratransit servicecontract also contributed to the increase.Materials and supplies increased by $17.9 million or 16.9 percent. The steadily increasing cost for fuel accountedfor the largest portion of this increase.Utilities increased by $5.5 million or 8.9 percent, due to increased propulsion usage to operate eight-carpassenger trains and higher natural gas costs.Capital Assets and Debt AdministrationThe following table shows the capital assets of the Authority:Table 3Schedules of Capital AssetsJune 30, 20<strong>07</strong>, 2006 and 2005(in thousands)20<strong>07</strong> 2006 2005Land $ 431,291 $ 431,291 $ 431,291Buildings and improvements 453,633 448,921 436,820Transit facilities 7,431,297 7,126,154 7,211,193Revenue vehicles 1,933,396 1,745,241 1,619,357Other equipment 1,296,290 1,205,935 1,131,154Construction in progress 871,245 1,033,335 540,618Intangible costs 1,157,217 1,157,217 1,157,21713,574,369 13,148,094 12,527,650Less accumulated depreciationand amortization 5,340,206 5,011,600 4,727,462Net capital assets $ 8,234,163 $ 8,136,494 $ 7,800,18818
Washington Metropolitan Area Transit AuthorityFY 20<strong>07</strong> Comprehensive Annual Financial ReportCapital Assets and Debt Administration (Continued)Capital AssetsCurrent YearManagement’s Discussion and AnalysisNet capital assets increased by $97.7 million or 1.2 percent, as described below.Revenue vehicles increased by $188.1 million or 10.8 percent, as a result of placing into service rail cars andclean natural gas transportation vehicles. In addition, costs associated with railcar rehabilitation also contributedto the increase.Construction in progress decreased by $162.1 million or 15.7 percent, as a result of transferring a number of<strong>com</strong>pleted projects to transit facilities and equipment.Additional information on the Authority’s capital assets can be found in note 5 on pages 35- 36 of this report.Prior YearNet capital assets increased by $336.3 million or 4.3 percent, as described below.Revenue vehicles increased by $125.9 million or 7.8 percent, as a result of hybrid-electric and clean natural gastransportation vehicle purchases.Construction in progress increased by $492.7 million or 91.1 percent, due to facilities enhancements andrehabilitation costs for track and power distribution facilities, railcars, and escalators and elevators. Ongoing costsrelated to transportation vehicle purchases also contributed to the increase in construction in progress.Future Capital PlansDuring Fiscal Year 20<strong>07</strong>, Metro Matters funds were used for the maintenance of the Authority’s infrastructure.Maintenance includes such work as replacing deteriorated or damaged track, repairing cracks and leaks instations and tunnels, replacing obsolete <strong>com</strong>munications and train control equipment, and performing generalbuilding maintenance at many <strong>WMATA</strong> facilities. This work will continue through Fiscal Year 2010.The Metro Matters Rail Cars and Facilities program will allow Metrorail to have an estimated fifty percent of itspeak hour trains operating in an eight-car configuration. To achieve these goals, <strong>WMATA</strong> is procuring 122 railcars (6000-series), and expanding and making other necessary improvements to the Brentwood, Greenbelt, andShady Grove rail yards and maintenance facilities. By December 2008, eight-car train operations are expected toachieve a 50 percent service rate.Bonds and Other DebtThe Authority’s total outstanding bond debt as of June 30, 20<strong>07</strong> and 2006 was $178.9 million and $203.5 million,respectively. By insuring its bonds, the Authority has obtained a AAA rating from Standard and Poor’s for existingissuances. The bonds’ uninsured rating is A minus.The Authority’s total outstanding Commercial Paper Notes, Series A debt as of June 30, 20<strong>07</strong> was $215 million.19
Washington Metropolitan Area Transit AuthorityFY 20<strong>07</strong> Comprehensive Annual Financial ReportBonds and Other Debt (Continued)Management’s Discussion and AnalysisAdditional information on the Authority’s bonds and other debt can be found in note 6 on pages 37-39 of thisreport.Lease ObligationsInformation on these transactions can be found in note 11 on pages 49 - 50 of this report.Economic FactorsEmployment in the Washington, D.C. metropolitan area was stable throughout the Fiscal Year performing abovethe national average. According to the George Mason University, Center for Regional Analysis (CRA), theemployed labor force was 2.9 million at June 20<strong>07</strong>, an increase of 27,000 jobs or 0.9 percent. The region benefitsfrom a low unemployment rate of 3.3 percent at June 20<strong>07</strong> as well as June 2006. This <strong>com</strong>pares favorably withthe national unemployment rate of 4.5 percent at June 20<strong>07</strong>. The region is the seat of the federal government,which accounts for nearly 35.0 percent of the region’s economy, according to CRA.Requests for InformationThis financial report is designed to provide interested readers with a general overview of the Authority’s finances.Questions concerning this report or requests for additional financial information should be directed to the Office ofAccounting, Washington Metropolitan Area Transit Authority, 600 Fifth St., NW, Washington, D.C. 20001,telephone number (202) 962-1605.20
Washington Metropolitan Area Transit AuthorityFY 20<strong>07</strong> Comprehensive Annual Financial ReportStatements of Net AssetsJune 30, 20<strong>07</strong> and 2006(in thousands)ASSETS20<strong>07</strong> 2006Current assets:Cash and deposits (note 3) $ 9,576 $ 7,462Investments (note 3) 280,872 395,126Contributions receivable (note 4) 102,443 62,896Accounts receivable and other assets (net of$1,400 in uncollectible accounts) 26,676 21,130Current portion of prefunded lease <strong>com</strong>mitments (note 11) 132,264 145,066Materials and supplies inventory (net of allowance of$8,441 in 20<strong>07</strong> and $8,639 in 2006) 82,603 79,746Total current assets 634,434 711,426Noncurrent assets:Long-term portion of contributions receivable (note 4) 138,727 119,745Net pension asset (note 8) 202,789 186,397Prefunded lease <strong>com</strong>mitments (notes 11 and 12) 1,294,808 1,334,158Capital assets (note 5):Construction in progress 871,245 1,033,335Land 431,291 431,291Transit facilities and equipment, net 6,931,627 6,671,868Total noncurrent assets 9,870,487 9,776,794Total assets 10,504,921 10,488,220The ac<strong>com</strong>panying notes are an integral part of these basic financial statements.21
Washington Metropolitan Area Transit AuthorityFY 20<strong>07</strong> Comprehensive Annual Financial ReportStatements of Net Assets (Continued)June 30, 20<strong>07</strong> and 2006(in thousands)20<strong>07</strong> 2006LIABILITIESCurrent liabilities:Accounts payable and accrued expenses 189,227 203,627Accrued salaries and benefits 77,920 68,443Accrued interest payable 5,177 4,896Deferred revenue 77,881 69,220Current portion of estimated liabilityfor injury and damage claims (notes 10 and 12) 34,394 29,995Current portion of retainage on contracts (note 12) 4,508 2,057Current portion of deferred lease revenue (note 12) 5,469 5,469Current portion of bonds payable and other debt (notes 6 and 12) 240,776 23,865Current portion of obligations under lease agreements (notes 11 and 12) 132,264 145,066Total current liabilities 767,616 552,638Noncurrent liabilities:Estimated liability for injury and damage claims (notes 10 and 12) 62,870 55,177Retainage on contracts (note 12) 29,729 26,388Deferred lease revenue (note 12) 50,720 56,421Bonds payable and other debt (notes 6 and 12) 153,126 179,616Obligations under lease agreements (notes 11 and 12) 1,294,808 1,334,158Total noncurrent liabilities 1,591,253 1,651,760Commitments and contingencies (note 8, 9, 10 and 11)NET ASSETSTotal liabilities 2,358,869 2,204,398Invested in capital assets, net of related debt 7,880,168 7,904,568Restricted 265,884 379,254Total net assets $ 8,146,052 $ 8,283,822The ac<strong>com</strong>panying notes are an integral part of the basic financial statements.22
Washington Metropolitan Area Transit AuthorityFY 20<strong>07</strong> Comprehensive Annual Financial ReportStatements of Revenues, Expenses, and Changes in Net AssetsFor the Years Ended June 30, 20<strong>07</strong> and 2006(in thousands)20<strong>07</strong> 2006OPERATING REV ENUESPassenger revenue $ 563,356 $ 555,262Charter and contract revenue 6,767 3,909A dvertising revenue 33,000 30,000Rental revenue 20,777 17,108Other revenue 1,192 1,199Total operating revenues 625,092 6<strong>07</strong>,478OPERATING EX PENSESLabor 573,514 536,439Fringe benefits 302,416 271,577Services 117,867 102,081Materials and supplies 144,584 123,439Utilities 72,286 67,010Casualty and liability costs 28,223 44,688Leases and rentals 2,925 3,999Miscellaneous 3,452 5,205Depreciation and amortization 361,141 306,955Total operating expenses 1,606,408 1,461,393Operating loss (981,316) (853,915)NONOPERATING REVENUES (EXPENSES)Investment in<strong>com</strong>e 3,288 3,981Interest in<strong>com</strong>e from leasing transactions 87,874 88,548Interest expense from leasing transactions (87,874) (88,548)Interest expense (11,838) (9,978)In<strong>com</strong>e (expense) from pension plans 16,392 (14,514)Other 12,281 9,413Jurisdiction subsidies:Operations 589,639 546,132Interest 10,413 11,926Total nonoperating revenues (expenses), net 620,175 546,960Loss before capital contributions (361,141) (306,955)Revenue from capital contributions 223,371 471,037Change in net assets (137,770) 164,082Total net assets, beginning of year 8,283,822 8,119,740Total net assets, ending of year $ 8,146,052 $ 8,283,822The ac<strong>com</strong>panying notes are an integral part of these basic financial statements.23
Washington Metropolitan Area Transit AuthorityFY 20<strong>07</strong> Comprehensive Annual Financial ReportStatements of Cash FlowsFor the Years Ended June 30, 20<strong>07</strong> and 2006(in thousands)20<strong>07</strong> 2006CASH FLOW FROM OPERATING ACTIVITIESCash received from operations $ 628,206 $ 617,046Cash paid to suppliers (352,578) (250,834)Cash paid to and on behalf of employees (866,453) (810,490)Cash paid for operating claims (16,132) (24,475)Net cash used in operating activities (606,957) (468,753)CASH FLOWS FROM NONCAPITAL FINANCING ACTIVITIESCash received from jurisdiction subsidies 547,503 448,764Net cash provided by noncapital financing activities 547,503 448,764CASH FLOWS FROM CAPITAL AND RELATED FINANCING ACTIVITIESConstruction of capital assets (459,212) (536,769)Capital contributions 202,400 420,736Interest paid on bonds and other debt (11,558) (10,340)Principal paid on bonds and other debt (548,865) (23,040)Proceeds from <strong>com</strong>mercial paper 740,000 -Interest subsidy for revenue bonds 8,983 9,978Net cash used in capital and related financing activities (68,252) (139,435)CASH FLOWS FROM INVESTING ACTIVITIESProceeds from sale and maturities of investments 368,881 424,506Purchases of investments (254,630) (274,898)Interest received from operational investments 16,815 9,757Net cash provided by investing activities 131,066 159,365Net change in cash and deposits 2,114 (59)Cash and deposits, beginning of year 7,462 7,521Cash and deposits, end of year $ 9,576 $ 7,462The ac<strong>com</strong>panying notes are an integral part of these basic financial statements.24
Washington Metropolitan Area Transit AuthorityFY 20<strong>07</strong> Comprehensive Annual Financial ReportStatements of Cash Flows (Continued)For the Years Ended June 30, 20<strong>07</strong> and 2006(in thousands)RECONCILIATION OF OPERATING LOSS TO NET CASHUSED IN OPERATING ACTIVITIES20<strong>07</strong> 2006Operating loss $ (981,316) $ (853,915)Adjustments to reconcile operating loss to net cash used inoperating activities:Depreciation and amortization expense 361,141 306,955(Increase) decrease in accounts receivables (net) and other assets (5,547) 9,727(Increase) in materials and supplies inventory (2,858) (480)(Decrease) increase in accounts payable and accrued expenses (14,400) 48,158Increase (decrease) in accrued salaries and benefits 9,477 (2,474)Increase in estimated liability for injury and damage claims 12,092 20,213Increase (decrease) in deferred revenue 8,661 (159)Increase in retainage on contracts 5,793 3,222Total adjustments 374,359 385,162Net cash used in operating activities $ (606,957) $ (468,753)Noncash investing, capital, and financing activities:(Decrease) increase in fair value of investments $ (1,663) $ 5,096Other in<strong>com</strong>e (expense) from pension $ 16,392 $ (14,514)Interest expense from leasing transaction $ (87,874) $ (88,548)Interest in<strong>com</strong>e from leasing transaction $ 87,874 $ 88,548The ac<strong>com</strong>panying notes are an integral part of these basic financial statements.25
Washington Metropolitan Area Transit AuthorityFY 20<strong>07</strong> Comprehensive Annual Financial Report(1) Summary of Significant Accounting Policies(a) OrganizationNotes to Basic Financial StatementsJune 30, 20<strong>07</strong> and 2006The Washington Metropolitan Area Transit Authority (Authority) was created, effective February 20, 1967, bythe Interstate Compact (Compact) by and between Maryland, Virginia and the District of Columbia, pursuantto Public Law 89-774, approved November 6, 1966. The Authority was created to plan, construct, financeand operate a public transit system serving the Washington Metropolitan Area Transit Zone (Zone). TheZone includes the following participating local jurisdictions: the District of Columbia; the cities of Alexandria,Falls Church, Fairfax, Manassas and Manassas Park; and the counties of Arlington, Fairfax, Loudoun andPrince William in Virginia, and Montgomery, Anne Arundel, Charles and Prince George's in Maryland.The Authority is governed by a Board of six Directors and six Alternates, <strong>com</strong>posed of two Directors and twoAlternates from each signatory to the Compact. The Directors and Alternates for Virginia are appointed by theNorthern Virginia Transportation Commission from among its members; for the District of Columbia, by theCity Council from among its members and mayoral nominees; and, for Maryland, by the WashingtonSuburban Transit Commission from among its members.The Board of Directors (Board) governs and sets policy for the Authority. Subject to policy direction anddelegations from the Board, the General Manager is responsible for all activities of the Authority. The staffcarries out these activities through the approved organizational structure of the Authority.Based upon the provisions of GAAP, as applicable to government entities in the United States of America,management of the Authority has determined that it is a joint venture of the participating local jurisdictions.(b) Financial Reporting EntityIn evaluating the Authority as a reporting entity, management has addressed all potential <strong>com</strong>ponent unitsthat may fall within the Authority's oversight and control and, as such, be included within the Authority's basicfinancial statements. As defined by GAAP, established by the Governmental Accounting Standards Board(GASB), a legally separate, tax-exempt organization should be reported as a <strong>com</strong>ponent unit of a reportingentity if all of the following criteria are met:1) The economic resources received or held by the separate organization are entirely or almost entirelyfor the direct benefit of the primary government, its <strong>com</strong>ponent units, or its constituents.2) The primary government, or its <strong>com</strong>ponent units, is entitled to, or has the ability to otherwise access,a majority of the economic resources received or held by the separate organization.3) The economic resources received or held by an individual organization that the specific primarygovernment, or its <strong>com</strong>ponent units, is entitled to, or has the ability to otherwise access, aresignificant to the primary government.26
Washington Metropolitan Area Transit AuthorityFY 20<strong>07</strong> Comprehensive Annual Financial ReportNotes to Basic Financial StatementsJune 30, 20<strong>07</strong> and 2006(1) Summary of Significant Accounting Policies (Continued)The relative importance of each criterion must be evaluated in light of specific circumstances. The decision toinclude or exclude a potential <strong>com</strong>ponent unit is left to the professional judgment of management. Includedwithin the Authority's financial reporting entity are the planning, development and operation of the transitfacilities serving the Washington, D.C. metropolitan area which are funded from the <strong>com</strong>bined resources ofthe U.S. Government, the State of Maryland, the Commonwealth of Virginia, the District of Columbia, theparticipating local jurisdictions, and the Authority's operations. The Authority does not report any <strong>com</strong>ponentunits within its financial reporting entity.(c) Basis of AccountingThe Authority prepares its basic financial statements using the accrual basis of accounting. The activities ofthe Authority are similar to those of proprietary funds of local jurisdictions and, therefore, are reported inconformity with governmental accounting and financial reporting principles issued by GASB. The Authorityhas elected to apply all applicable Financial Accounting Standards Board Statements and Interpretations,Accounting Principles Board Opinions and Accounting Research Bulletins, issued on or before November 30,1989 that do not conflict with or contradict GASB pronouncements.(d) Receivables and PayablesThe major <strong>com</strong>ponents of the accounts receivable balance are payments due from governmental agencies(81.7 percent), <strong>com</strong>panies (17.9 percent) and other receivables (.04 percent).The major <strong>com</strong>ponents of the accounts payable balance are payments due to vendors and contractors (78.5percent), governmental agencies (20.0 percent) and other payables (1.5 percent).(e) Revenues and ExpensesThe Authority distinguishes operating revenues and expenses from nonoperating items. Operating revenuesand expenses are those that result from providing services in connection with the Authority’s principal ongoingoperation. The principal operating revenues of the Authority are charges to customers for transportationwhich result in passenger revenues. Passenger revenues are recorded as revenue at the time services areperformed. Cash received for services that have not been performed are recorded as deferred revenue.Operating revenues and expenses also include all revenues and expenses not associated with capital andrelated financing, noncapital financing, or investing activities.Nonoperating revenues and expenses include investment in<strong>com</strong>e and expense from the Authority’s pensionassets that represents the excess or shortage of contributions over the annual required contributions.(f) InvestmentsInvestments are stated at fair value, which is based on quoted market prices. Investments consist primarily ofadvanced contributions and interest earned on such contributions. These advanced contributions arerestricted for specific future capital projects.27
Washington Metropolitan Area Transit AuthorityFY 20<strong>07</strong> Comprehensive Annual Financial ReportNotes to Basic Financial StatementsJune 30, 20<strong>07</strong> and 2006(1) Summary of Significant Accounting Policies (Continued)(g) Materials and Supplies InventoryMaterials and supplies inventory is stated at average cost, net of an allowance for obsolete and excessinventory.(h) Transit Facilities and EquipmentTransit facilities and equipment are stated at cost, less accumulated depreciation and amortization.Determinations of the cost of rapid rail assets placed in service are made with the assistance of theAuthority's consulting engineers. Such cost determinations are based upon the historical costs of the projectprovided by the Modular Input Output System (MIOS) reports. Interest expense related to construction andamounts expended in operating and testing each phase of the rail system prior to <strong>com</strong>mencement ofrevenue-producing operations are capitalized as intangible costs.Transit facilities and equipment in service are depreciated or amortized using the straight-line method overthe estimated useful lives of the assets. The useful lives employed in <strong>com</strong>puting depreciation andamortization on principal classes of transit facilities and equipment are as follows:Buildings and improvementsRail transit facilitiesRevenue vehiclesOther equipmentIntangible costs20-45 years10-75 years12-35 years2-20 years40 yearsCapital assets include repairable assets, which are replacement parts with a unit cost of $500 or more. Othercapital assets are defined as assets with an initial, individual cost of more than $5,000 and an estimateduseful life in excess of one year.Any donated capital assets are recognized at their fair value on the date of donation.The Authority's policy is to expense maintenance and repair costs as incurred.(i) GrantsCapital grants and operating grants, such as jurisdictional, operating and interest subsidies, are recognized asrevenue when all applicable eligibility requirements have been met.The determination of the Authority’s jurisdictional subsidies is based on its operating loss and nonoperatingrevenues, and does not include depreciation expense. As a result, the Authority’s change in net assetsrepresents revenues from capital grants and subsidies, less depreciation expense.28
Washington Metropolitan Area Transit AuthorityFY 20<strong>07</strong> Comprehensive Annual Financial ReportNotes to Basic Financial StatementsJune 30, 20<strong>07</strong> and 2006(1) Summary of Significant Accounting Policies (Continued)(j) Investment In<strong>com</strong>eInterest in<strong>com</strong>e is generated from the following sources: advanced contributions for capital and operatingneeds, construction grant funds and capital improvement grant funds. Interest from these sources isrecognized when earned and is included in the Statements of Revenues, Expenses and Changes in NetAssets. Interest earned on construction grant funds is classified as restricted net assets until used for thedesignated capital projects at which time it is transferred to “Invested in capital assets, net of related debt.”(k) Restricted Net AssetsThe Authority separates net assets that are subject to external restrictions based on individual agreements.The restrictions are established by the Authority’s governing jurisdictions. These restricted net assets includeadvance contributions for future construction programs, reimbursable projects and other targeted programs.(l) Fuel Price Swap ArrangementThe Authority enters into agreements to fix the price associated with the purchase of fuel for specified periodsof time. These agreements enable the Authority to plan its fuel costs for the year and to protect itself againstincreases in the market price of fuel. These agreements are disclosed at fair value and amounts due to theAuthority are included in “Accounts receivable and other assets” and amounts owed by the Authority areincluded in “Accounts payable and accrued expenses.”(m) Use of EstimatesThe preparation of the basic financial statements in conformity with GAAP requires management to makeestimates and assumptions that affect the reported amounts of assets and liabilities and disclosure ofcontingent assets and liabilities at the date of the basic financial statements and the reported amounts ofrevenues and expenses during the reporting period. Actual results could differ from those estimates.(n) Recent PronouncementsThe Authority, in fiscal year 20<strong>07</strong>, adopted the following GASB Statement:GASB Statement No. 43, Financial Reporting for Postemployment Benefit Plans Other Than Pension Plans,established accounting and financial reporting standards for plans that provided other postemploymentbenefits (OPEB) separately from the pension benefits. The Statement was effective for the Authority’s OPEBplans on July 1, 2006. The adoption of this GASB statement had no material effect on the basic financialstatements of the Authority.(o) Tax StatusThe Authority is not subject to federal, state, or local in<strong>com</strong>e taxes and accordingly, no provision for in<strong>com</strong>etaxes is recorded.29
Washington Metropolitan Area Transit AuthorityFY 20<strong>07</strong> Comprehensive Annual Financial ReportNotes to Basic Financial StatementsJune 30, 20<strong>07</strong> and 2006(2) Plans of FinancingThe planning, development and operation of the transit facilities serving the Washington, D.C. metropolitan areaare funded from the <strong>com</strong>bined resources of the U.S. Government, the State of Maryland, the Commonwealth ofVirginia, the District of Columbia, the participating local jurisdictions, and the Authority's operations.The original federal funding for construction of the metrorail system was provided by authority of the NationalCapital Transportation Act of 1969 (Public Law 91-143). This Act was subsequently amended on January 3, 1980by Public Law 96-184, "The National Capital Transportation Amendment of 1979" (also known as the Stark-HarrisAct) which authorized additional funding and on November 15, 1990 by Public Law 101-551, "The NationalCapital Transportation Amendments of 1990" which authorized funding for <strong>com</strong>pletion of a 103-mile metrorailsystem. The Authority has also obtained funding under certain agreements to <strong>cover</strong> debt service on its transitbond obligations as more fully explained in note 6.The Authority's operations are funded primarily by farebox revenues from passengers and operating subsidypayments from participating jurisdictions. In establishing its budget each year, the Authority makes an estimate ofthe revenues it expects to receive from operation of the system based on the current or projected fare scheduleand ridership. The majority of the balance of the Authority's operating budget is provided through operatingsubsidy payments from the participating jurisdictions.Funding of these subsidy payments is authorized by the participating jurisdictions through their budgetingprocesses. Any subsequent operations funding requirements in excess of the initially budgeted estimates are duetwo years thereafter and are included in the ac<strong>com</strong>panying basic financial statements as contributions receivable.Any excess funding is credited to individual jurisdictional accounts for refund or for use as payment on current orfuture obligations as determined by the funding jurisdiction.The Authority’s Capital Improvement Program (CIP) consisting of the Infrastructure Renewal Program (IRP),System Access/Capacity Program (SAP) and System Expansion Program (SEP) is based on the results of anextensive needs assessment and the requirement to align resources to rehabilitate the existing systemsadequately and to grow ridership. The contributing jurisdictions have approved the Metro Matters program, whichfunds the IRP, the security program, and adds bus and rail capacity. The Authority’s capital budget is funded bygrants that use federal funds and substantial local contributions provided by participating jurisdictions, in excessof federal match requirements.(3) Cash, Deposits and InvestmentsAs provided in the amended Compact, any monies of the Authority may, at the discretion of the Board and subjectto any agreement or covenant between the Authority and the holders of its obligations limiting or restrictingclasses of investments, be invested in the following:1) Direct obligation of, or obligations guaranteed by, the United States;2) Bonds, debentures, notes, or other evidences of indebtedness issued by agencies of the United States;3) Domestic and Eurodollar certificates of deposit;30
Washington Metropolitan Area Transit AuthorityFY 20<strong>07</strong> Comprehensive Annual Financial Report(3) Cash, Deposits and Investments (Continued)Notes to Basic Financial StatementsJune 30, 20<strong>07</strong> and 20064) Securities that qualify as lawful investments and may be accepted as security for fiduciary, trust and publicfunds under the control of the United States or any officer or officers thereof or securities eligible as collateralfor deposits of monies of the United States; or5) Bonds, debentures, notes or other evidences of indebtedness issued by a domestic corporation provided thatsuch obligations are nonconvertible and at the time of their purchase are rated in the highest rating categoriesby a nationally recognized bond rating agency.(a) Cash and DepositsThe Authority’s bank balances as of June 30, 20<strong>07</strong> and 2006 are grouped to give an indication of the level ofcustodial risk assumed by the Authority as follows (in thousands):20<strong>07</strong> 2006Carrying Bank Carrying BankCash and Deposits Amount Balance Amount BalanceDeposits insured or collateralized $ 604 $ 674 $ 385 $ 530Deposits uninsured or uncollateralized 2,656 3,138 735 764Total deposits 3,260 3,812 1,120 1,294Cash on hand 6,316 - 6,342 -Total cash and deposits $ 9,576 $ 3,812 $ 7,462 $ 1,29431
Washington Metropolitan Area Transit AuthorityFY 20<strong>07</strong> Comprehensive Annual Financial ReportNotes to Basic Financial StatementsJune 30, 20<strong>07</strong> and 2006(3) Cash, Deposits and Investments (Continued)(b) InvestmentsAs of June 30, 20<strong>07</strong>, the Authority had the following investments and maturities (in thousands):Investment MaturitiesFair Less than 7 Months - More thanInvestment Type Value 6 Months 1 Year 1-3 Years 3 YearsMoney market funds $ 8,506 $ 8,506 $ - $ - $ -Repurchase agreements 129,410 129,410 - - -United States treasuries 12,169 4,997 - 4,987 2,185United States agencies 129,352 39,294 37,847 26,521 25,690279,437 182,2<strong>07</strong> 37,847 31,508 27,875Accrued interest 1,435 1,435 - - -Total $ 280,872 $ 183,642 $ 37,847 $ 31,508 $ 27,875As of June 30, 2006, the Authority had the following investments and maturities (in thousands):Investment MaturitiesFair Less than 7 Months - More thanInvestment Type Value 6 Months 1 Year 1-3 Years 3 YearsMoney market funds $ 9,577 $ 9,577 $ - $ - $ -Repurchase agreements 68,802 68,802 - - -United States treasuries 53,781 24,879 21,808 4,928 2,166United States agencies 260,838 118,283 45,510 75,772 21,273392,998 221,541 67,318 80,700 23,439Accrued interest 2,128 2,128 - - -Total $ 395,126 $ 223,669 $ 67,318 $ 80,700 $ 23,439Interest Rate RiskAs a means of limiting its exposure to fair value losses caused by rising interest rates, the Authority’s practice is tostructure its investment portfolio maturities to meet cash flow requirements. This results in short term maturitiesfor investments for operations and medium/intermediate maturities for capital projects investments. On average,maturities are less than two years at June 30, 20<strong>07</strong> and 2006.32
Washington Metropolitan Area Transit AuthorityFY 20<strong>07</strong> Comprehensive Annual Financial ReportNotes to Basic Financial StatementsJune 30, 20<strong>07</strong> and 2006(3) Cash, Deposits and Investments (Continued)Credit RiskThe Authority’s investments in repurchase agreements and issues of governmental agencies, which have theimplicit guarantee of the United States government, were, at the time of purchase, awarded the highest rating byone or more of the nationally recognized rating organizations: Standard and Poor’s, Moody’s Investor Service orFitch Ratings.Custodial Credit RiskIn the event of failure of the counterparty, the Authority will be able to re<strong>cover</strong> the value of its investments orcollateral securities that are in the possession of an outside party. The Authority is not exposed to custodial riskbecause all securities are in the Authority’s name and held exclusively for the use of the Authority.(4) Contributions Receivable (including Jurisdictional Operating Subsidy)Since inception, the Authority has operated at a loss, which has been fully subsidized each year by theparticipating jurisdictions. For purposes of determining the current year’s operating loss to be funded by the localparticipating jurisdictions, the Authority calculates the results of transit operations on an agreed-upon basisdifferent from that reflected in the Statements of Revenues, Expenses and Changes in Net Assets, as follows atJune 30, 20<strong>07</strong> and 2006 (in thousands):20<strong>07</strong> 2006Jurisdictional operating subsidy per financialstatements $ 589,639$ 546,132Add (deduct) operating costs (not) requiringcurrent funding:Preventive maintenance subsidy (20,700) (20,700)Prepaid pension cost adjustment 16,392 (14,514)Unrealized (loss) gain from investments (1,663) (5,096)Agreed-upon funding of employee vacationsliability and related taxes (3,999) 3,735Agreed-upon funding of claims forinjuries and damages (14,982) (38,042)Rail repairable parts 252 395Increase in prior year obligationsand <strong>com</strong>mitments - 1,490Maximum fare assistance 4,870 4,695Operating expenses funded bycapital grants (88,883) (46,254)Jurisdictional operating subsidy -funding basis $ 480,926$ 431,84133
Washington Metropolitan Area Transit AuthorityFY 20<strong>07</strong> Comprehensive Annual Financial ReportNotes to Basic Financial StatementsJune 30, 20<strong>07</strong> and 2006(4) Contributions Receivable (including Jurisdictional Operating Subsidy) (Continued)The cumulative effects of the different agreed-upon basis, which result in long-term contributions receivable, areas follows at June 30, 20<strong>07</strong> and 2006 (in thousands):20<strong>07</strong> 2006Agreed-upon funding of employeevacation liability and related taxes $ 41,463$ 37,463Agreed-upon funding of claimsfor injuries and damages 97,264 82,282Total accumulated difference $ 138,727$ 119,745The current portion of contributions receivable at June 30, 20<strong>07</strong> and 2006 of $102,443,000 and $62,896,000,respectively are related primarily to federal grants.34
Washington Metropolitan Area Transit AuthorityFY 20<strong>07</strong> Comprehensive Annual Financial ReportNotes to Basic Financial StatementsJune 30, 20<strong>07</strong> and 2006(5) Capital AssetsCapital assets activity for the years ended June 30, 20<strong>07</strong> and 2006, was as follows (in thousands):June 30, 2006 Additions Reductions June 30, 20<strong>07</strong>Capital assets not being depreciated:Land $ 431,291 $ - $ - $ 431,291Construction in progress 1,033,335 345,984 (508,<strong>07</strong>4) 871,245Total capital assets not being depreciated 1,464,626 345,984 (508,<strong>07</strong>4) 1,302,536Capital assets being depreciated: -Buildings and improvements 448,921 4,712 - 453,633Transit facilities 7,126,154 305,143 - 7,431,297Revenue vehicles 1,745,241 217,130 (28,975) 1,933,396Other equipment 1,205,935 94,316 (3,961) 1,296,290Intangible costs:Bond interest capitalized 244,358 - - 244,358Construction supervision and consulting 480,765 - - 480,765Project and executive management 321,916 - - 321,916Pre-rail operations and testing 110,178 - - 110,178Total capital assets being depreciated 11,683,468 621,301 (32,936) 12,271,833Less accumulated depreciationand amortization for:Buildings and improvements 198,685 21,511 - 220,196Transit facilities 2,009,422 175,848 - 2,185,270Revenue vehicles 902,617 81,014 (28,975) 954,656Other equipment 965,969 66,757 (3,961) 1,028,765Intangible costs 934,9<strong>07</strong> 16,412 - 951,319Total accumulated depreciationand amortization of intangible costs 5,011,600 361,542 (32,936) 5,340,206Total capital assets being depreciated, net 6,671,868 259,759 - 6,931,627Total capital assets, net $ 8,136,494 $ 605,743 $ (508,<strong>07</strong>4) $ 8,234,16335
Washington Metropolitan Area Transit AuthorityFY 20<strong>07</strong> Comprehensive Annual Financial ReportNotes to Basic Financial StatementsJune 30, 20<strong>07</strong> and 2006(5) Capital Assets (continued)June 30, 2005 Additions Reductions June 30, 2006Capital assets not being depreciated:Land $ 431,291 $ - $ - $ 431,291Construction in progress 540,618 515,181 (22,464) 1,033,335Total capital assets not being depreciated 971,909 515,181 (22,464) 1,464,626Capital assets being depreciated:Buildings and improvements 436,820 12,101 - 448,921Transit facilities 7,211,193 - (85,039) 7,126,154Revenue vehicles 1,619,357 144,809 (18,925) 1,745,241Other equipment 1,131,154 79,997 (5,216) 1,205,935Intangible costs: -Bond interest capitalized 244,358 - - 244,358Construction supervision and consulting 480,765 - - 480,765Project and executive management 321,916 - - 321,916Pre-rail operations and testing 110,178 - - 110,178Total capital assets being depreciated 11,555,741 236,9<strong>07</strong> (109,180) 11,683,468Less accumulated depreciationand amortization for:Buildings and improvements 177,919 20,766 - 198,685Transit facilities 1,869,851 139,571 - 2,009,422Revenue vehicles 848,986 72,556 (18,925) 902,617Other equipment 912,211 58,918 (5,160) 965,969Intangible costs: 918,495 16,412 - 934,9<strong>07</strong>Total accumulated depreciationand amortization of intangible costs 4,727,462 308,223 (24,085) 5,011,600Total capital assets being depreciated, net 6,828,279 (71,316) (85,095) 6,671,868Total capital assets, net $ 7,800,188 $ 443,865 $ (1<strong>07</strong>,559) $ 8,136,49436
Washington Metropolitan Area Transit AuthorityFY 20<strong>07</strong> Comprehensive Annual Financial Report(6) Bonds Payable and Other Debt(a) Bonds PayableNotes to Basic Financial StatementsJune 30, 20<strong>07</strong> and 2006Pursuant to the Compact and the Bond Resolution of the Authority, the following bonds were outstanding atJune 30, 20<strong>07</strong> and 2006 (in thousands):PrincipalUnamortizedIssuance CostNet of Premium Net NetSeries 1993, 5.18% datedNovember 1, 1993, duesemi-annually throughJuly 1, 2010 $ 42,150 $ (696) $ 41,454 $ 41,246Series 2003, 4.60% datedOctober 23, 2003, duesemi-annually throughJuly 1, 2014 109,<strong>07</strong>5 5,795 114,870 134,515Series 2003B, 4.06% datedNovember 20, 2003, duesemi-annually throughJuly 1, 2010 21,265 1,313 22,578 27,72020<strong>07</strong>2006$ 172,490 $ 6,412 $ 178,902 $ 203,481The Authority is required to make semi-annual payments of principal and interest on each Series of Bonds. TheAuthority must <strong>com</strong>ply with certain covenants associated with these outstanding bonds; the more significant ofwhich are:• The Authority must punctually pay principal and interest according to provisions in the bond document.• Except for certain instances, the Authority cannot sell, mortgage, lease, or otherwise dispose of transit systemassets without filing a certification by the General Manager and Treasurer with the Trustee and Bond Insurersthat such action will not impede or restrict the operation of the transit system.• The Authority must at all times maintain certain insurance or self-insurance <strong>cover</strong>ing the assets andoperations of the transit system.The Authority is in full <strong>com</strong>pliance with all significant bond covenants.37
Washington Metropolitan Area Transit AuthorityFY 20<strong>07</strong> Comprehensive Annual Financial ReportNotes to Basic Financial StatementsJune 30, 20<strong>07</strong> and 2006(6) Bonds Payable and Other Debt (Continued)(b) Bonds Debt Service RequirementsDebt service requirements for the bonds payable are as follows (in thousands):Fiscal Year Principal Interest Total2008 $ 25,025 $ 8,325 $ 33,3502009 26,380 6,960 33,3402010 27,815 5,520 33,3352011 29,330 4,000 33,3302012 24,655 2,818 27,4732013-2015 39,285 2,429 41,714172,490 30,052 202,542Plus unamortized premiumnet of issuance cost 6,412 - 6,412$ 178,902 $ 30,052 $ 208,954(c) Refunding of DebtOn November 30, 1993, the Authority issued $334,015,000 of Series 1993 Gross Revenue Transit RefundingBonds, with an average interest rate of 5.18 percent, to refund $332,333,000 of outstanding A, B, C, D, and ESeries Transit Bonds. The federal government provided the Authority with the funds necessary to redeem theremaining $664,667,000 of such bonds. As a result, the outstanding A, B, C, D, and E Series Transit Bondswere retired.On October 23, 2003, the Authority issued $163,495,000 of Series 2003 Gross Revenue Transit RefundingBonds, with an average interest rate of 4.6 percent, to refund $168,490,000, the callable amount ofoutstanding Series 1993 Gross Revenue Transit Refunding Bonds.On November 20, 2003, the Authority issued $35,640,000 of Series 2003B Gross Revenue Transit Bonds,with an average interest rate of 4.06 percent, to accelerate the Authority’s Vertical TransportationModernization Program and other capital projects.The Authority refunded the A, B, C, D and E Series Transit Bonds to reduce its total debt service paymentsover the next 20 years by approximately $288,000,000 and to obtain an economic gain (difference betweenthe present value of the debt service payments on the old and new debt) of approximately $4,700,000. TheAuthority partially refunded the Series 1993 Gross Revenue Transit Refunding Bonds to reduce its total debtservice payments over the next 10 years by approximately $13,000,000 and to obtain an economic gain ofapproximately $1,697,000. As of June 30, 20<strong>07</strong> and 2006, the unamortized cost of refunding the bonds was$2,981,000 and $3,427,000, respectively. This unamortized cost relates primarily to the call premium on theSeries E Transit Bond, and the Series 1993 Gross Revenue Transit Refunding Bonds, which are beingamortized over the life of the outstanding bonds.38
Washington Metropolitan Area Transit AuthorityFY 20<strong>07</strong> Comprehensive Annual Financial Report(6) Bonds Payable and Other Debt (Continued)(d) Commercial Paper Notes Payable, Series ANotes to Basic Financial StatementsJune 30, 20<strong>07</strong> and 2006Pursuant to the Compact and the Note resolution of the Authority, Commercial Paper Notes, (Series A) wereissued during Fiscal Year 20<strong>07</strong>. The Series A Notes activity for the year ended June 30, 20<strong>07</strong> was as follows(amounts in thousands):BeginningEndingBalance Issued Redeemed BalanceCommercial Paper Notes,Series A $ - $740,000 $525,000 $215,000The Series A Notes are authorized to be issued and reissued from time to time in denominations of anyintegral multiple of $5,000 equal to, or, in excess of $100,000 and to mature no later than 270 days from therespective dates of issuance. The maximum principal amount of Series A Notes currently authorized to beoutstanding at any time is $330,000,000. The principal and redemption price of and interest on the Series ANotes are special obligations of the Authority payable solely from and secured solely by the funds pledgedpursuant to the Note Resolution including the proceeds of sale of Series A Notes and Gross Revenues of theAuthority. Such pledge of Gross Revenues is subject and subordinate to pledges securing certainoutstanding and future indebtedness of the Authority. The Series A Notes are further secured by anirrevocable direct pay letter of credit issued by a major national bank. The issuance of Series A Notes doesnot constitute a debt or legal obligation and will not create a lien upon the revenues of the participatingjurisdictions or the Federal Government or Federal Government agencies.(e) Interest ExpenseInterest expense on bonds for the years ended June 30, 20<strong>07</strong> and 2006 was $8,983,000 and $9,978,000.Interest expense on the Series A Notes for the year ended June 30, 20<strong>07</strong> was $2,855,000.(7) Termination BenefitsThe General Manager may authorize a general reduction, in the work force, which is ac<strong>com</strong>plished by areduction in positions and may result in the termination of personnel. This course of action is approved by theAuthority’s Board of Directors and outlined in the Authority’s Personnel Policies and Procedures Manualwhich details the basis for severance pay to be made to employees subject to a reduction-in-force. On June30, 20<strong>07</strong>, the financial statements of the Authority contained a liability and expense of $2,500,000representing benefits to be paid to employees affected by a reduction-in-force implemented in the fiscal yearended June 30, 20<strong>07</strong>.39
Washington Metropolitan Area Transit AuthorityFY 20<strong>07</strong> Comprehensive Annual Financial ReportNotes to Basic Financial StatementsJune 30, 20<strong>07</strong> and 2006(8) Pension PlansThe Authority is the administrator of five defined benefit, single-employer retirement plans <strong>cover</strong>ingsubstantially all of its employees: Salaried Personnel, Transit Police, Union Local 689, Union Local 922 andUnion Local 2. Each plan issues an available financial report which may be obtained by writing or calling theplan administrator.<strong>WMATA</strong> Retirement Plan<strong>WMATA</strong> Transit Employees’ Retirement Planc/o <strong>WMATA</strong>, HRMP, Benefits Branchc/o <strong>WMATA</strong>, HRMP, Benefits Branch600 Fifth Street, N.W. 600 Fifth Street, N.W.Washington, D.C. 20001 Washington, D.C. 20001(202) 962-1<strong>07</strong>6 (202) 962-1<strong>07</strong>6<strong>WMATA</strong> Transit Police Retirement Plan <strong>WMATA</strong> Local 922 Retirement Planc/o <strong>WMATA</strong>, HRMP, Benefits Branchc/o <strong>WMATA</strong>, HRMP, Benefit Branch600 Fifth Street, N.W. 600 Fifth Street, N.W.Washington, D.C. 20001 Washington, D.C. 20001(202) 962-1<strong>07</strong>6 (202) 962-1<strong>07</strong>6<strong>WMATA</strong> Local 2 Retirement Planc/o <strong>WMATA</strong>, HRMP, Benefit Branch600 Fifth Street, N.W.Washington, D.C. 20001(202) 962-1<strong>07</strong>6(a) Plan Descriptions(i) Salaried Personnel PlanAll full-time regular management and non-union employees hired prior to January 1, 1999, certain TransitPolice Officials and Special Police Officers represented by Teamsters Union Local 639 are eligible toparticipate in the Salaried Personnel Plan. The plan is governed by the Authority’s Board of Directorswith consideration of both the applicable union agreements and Authority personnel practices. Thenormal retirement age is 65, and such retirees are entitled to annual retirement benefits equal to 1.6percent of final average <strong>com</strong>pensation multiplied by years of credited services, plus 0.9 percent of finalaverage <strong>com</strong>pensation in excess of the Social Security breakpoint multiplied by years of credited servicenot in excess of 20 years. Unreduced retirement benefits are available upon reaching age 55 andmeeting the “Rule of 83" with years of service and age. The maximum normal retirement benefit is not toexceed 80 percent of final average <strong>com</strong>pensation. The plan provides retired participants annual cost-oflivingincreases, permits both early and later retirement, and provides for benefits in the event of death,disability and terminated employment. The Authority contributes the total cost of the plan. The vestingrequirement is five years.(ii) Transit Police PlanTransit Police Officers and Transit Police Officials of the Authority are eligible to participate in the TransitPolice Plan. The plan is governed by the terms of the employees’ collective bargaining agreement. Thenormal retirement age is upon <strong>com</strong>pleting 25 years of credited service, but in no event later than theattainment of age 65. The normal retirement benefit is 2.56 percent of final average earnings multiplied byyears of credited service. The pension plan also provides death and40
Washington Metropolitan Area Transit AuthorityFY 20<strong>07</strong> Comprehensive Annual Financial ReportNotes to Basic Financial StatementsJune 30, 20<strong>07</strong> and 2006(8) Pension Plans (Continued)(ii) Transit Police Plan (Continued)disability benefits. Employees are required to contribute 7.27 percent of <strong>com</strong>pensation beginning October1, 2003. The Authority is responsible for contributions required in excess of the employee contributionlevel. The Authority may limit the amount of contribution to 17.05 percent of gross earnings in any planyear and defer any balance. This deferral can be for no more than three consecutive plan years or for nomore than four plan years out of any consecutive seven years. The benefit provisions and employeecontribution obligations are established pursuant to a collective bargaining agreement between theAuthority and the Fraternal Order of Police. The vesting requirement is 10 years.(iii) Union Local 689 PlanAny regular full-time or part-time Authority employee, who is a member of Union Local 689 of theAmalgamated Transit Union (Local 689), after a 90-day probationary period is eligible to participate in theUnion Local 689 Plan. The plan is governed by the terms of the employees’ collective bargainingagreement. Employees are eligible for the normal retirement allowance upon either attainment of age 70;attainment of age 65 and the <strong>com</strong>pletion of 10 years of continuous service; upon <strong>com</strong>pletion of 27 yearsof continuous service regardless of age; or after the sum of years of service plus attained age is 83 ormore. The normal retirement monthly pension is 1.85 percent of the highest 4-year average monthly total<strong>com</strong>pensation times the number of years of continuous service up to 27 years. Additionally, forparticipants whose benefits <strong>com</strong>mence on or after July 1, 2006, the normal retirement monthly pension is1.95 percent of average <strong>com</strong>pensation times the number of years of continuous service in excess of 27years. The minimum benefit is $600 monthly. Employees participating in the plan are not required tocontribute to the plan. For each fiscal year, the Authority shall contribute that percentage of total <strong>cover</strong>edpayroll determined necessary to pay the normal cost of the plan as determined by the plan actuary. Thepension plan also provides pre-retirement death and disability benefits. The vesting requirement is 10years.(iv) Union Local 922 PlanAll regular full-time and part-time employees, who are members of Union Local 922, after a 90-dayprobationary period, are eligible to participate in the Union Local 922 Plan. The plan is governed by theterms of the employees’ collective bargaining agreement. Employees are eligible for the normal pensionbenefits after attaining age 65 and 10 years of service; upon <strong>com</strong>pletion of 27 years of service regardlessof age; or after the sum of years of service plus attained age is not less than 83. The normal retirementmonthly pension is the sum of 1.0 percent for years of service prior to May 1, 1973 plus 1.85 percent foryears of service after May 1, 1973 of the highest 4-year average earnings with a minimum benefit of $175monthly. The pension plan also provides death and disability benefits. The Authority contributes thatamount required to fund the normal cost of the plan plus an additional amount necessary to amortize theunfunded actuarial accrued liability as required by the collective bargaining agreement between theAuthority and Union Local 922. The vesting requirement is 10 years.41
Washington Metropolitan Area Transit AuthorityFY 20<strong>07</strong> Comprehensive Annual Financial ReportNotes to Basic Financial StatementsJune 30, 20<strong>07</strong> and 2006(8) Pension Plans (Continued)(v) Union Local 2 PlanAll full-time employees <strong>cover</strong>ed by the Local 2 bargaining agreement hired prior to January 1, 1999 areeligible to participate in the Local 2 Plan. The plan is governed by the Authority’s Board of Directors withconsideration of both the applicable union agreements and Authority personnel practices. The normalretirement age is 65, and such retirees are entitled to annual retirement benefits equal to 1.6 percent offinal average <strong>com</strong>pensation multiplied by years of credited services, plus 0.9 percent of final average<strong>com</strong>pensation in excess of the Social Security breakpoint multiplied by years of credited service not inexcess of 20 years. Unreduced retirement benefits are available upon reaching age 55 and meeting the“Rule of 83" with years of service and age. The maximum normal retirement benefit is not to exceed 80percent of final average <strong>com</strong>pensation. The plan provides retired participants annual cost-of-livingincreases, permits both early and later retirement, and provides for benefits in the event of death,disability, and terminated employment. The Authority contributes the total cost of the plan. The vestingrequirement is 5 years.(b) Funding Status and Annual Pension Cost(i) Salaried Personnel PlanThe Salaried Personnel Plan’s funding policy, as approved by the Board of Directors, provides forperiodic employer contributions at actuarially determined rates that, expressed as percentages of annual<strong>cover</strong>ed payroll, are sufficient to accumulate assets to pay benefits when due. The actuarial cost methodis the individual entry age normal cost method. The surplus at July 1, 2003 is amortized over 15 years.Subsequent gains or losses will also be amortized over 15 years.(ii) Transit Police PlanThe Transit Police Plan’s funding policy, as set forth in the collective bargaining agreement, provides forperiodic employer contributions at actuarially determined rates that, expressed as percentages of annual<strong>cover</strong>ed payroll, are sufficient to fund the current year's normal cost. The percentage of payroll that theAuthority contributes is actuarially determined using the aggregate cost funding method.(iii) Union Local 689 PlanThe Union Local 689 Plan’s funding policy, as set forth in the collective bargaining agreement, providesfor periodic employer contributions at actuarially determined rates that, expressed as percentages ofannual <strong>cover</strong>ed payroll, are sufficient to fund the normal cost of the plan. The actuarial funding methodused to <strong>com</strong>pute the contribution requirements is the aggregate cost method.(iv) Union Local 922 Plan(The Union Local 922 Plan’s funding policy, as set forth in the collective bargaining agreement, providesfor periodic contributions, expressed both in dollar amounts and as a percentage of <strong>cover</strong>ed payroll,sufficient to <strong>cover</strong> normal costs and amortize any unfunded actuarial accrued liability over the 30-yearperiod that began on the valuation date. The actuarial method used to <strong>com</strong>pute the contributionrequirements is the entry age normal cost method.42
Washington Metropolitan Area Transit AuthorityFY 20<strong>07</strong> Comprehensive Annual Financial ReportNotes to Basic Financial StatementsJune 30, 20<strong>07</strong> and 20068) Pension Plans (Continued)(v) Union Local 2 PlanThe Union Local 2 Plan’s funding policy, as approved by the Board of Directors, provides for periodicemployer contributions at actuarially determined rates that, expressed as percentages of annual <strong>cover</strong>edpayroll, are sufficient to accumulate assets to pay benefits when due. The actuarial cost method is theindividual entry age normal cost method. The surplus at July 1, 2003 is amortized over 15 years. Futuregains or losses will also be amortized over 15 years.(vi) The Authority’s annual pension cost (APC) and related assumptions for the current year follows (dollars inthousands):SalariedPersonnelPlanTransitPolicePlanUnionLocal 689PlanUnionLocal 922PlanUnionLocal 2PlanContribution rates:*Authority 27.5% 22.0% 3.9% 15.1% 17.2%Employees (Plan Members) 0.0% 7.3% 0.0% 0.0% 0.0%Annual pension cost $ 10,456 $ 5,098 $ (8,684) $ 3,394 $ 3,048Contributions made:Authority $ 9,358 $ 5,098 $ 6,001 $ 3,275 $ 3,044Actuarial valuation date 7/1/2006 1/1/2006 1/1/2006 1/1/2006 7/1/2006Actuarial cost methodIndividualentry ageAggregatecostAggregatecostEntry ageIndividualentry ageAmortization method Level dollar N/A N/A Level dollar Level dollarAmortization period 15 years N/A N/A 30 years 15 yearsRemaining amortization period Open N/A N/A Open OpenAsset valuation methodSmoothedmarketvalueSmoothedmarketvalue3-yrassumedyieldSmoothedmarketvalueSmoothedmarketvalueActuarial assumptions:Investment rate of return 8.0% 8.0% 8.0% 7.0% 8.0%Projected salary increases 3.5-8% 4.75-9% 3.5% 4.5% 3.5-8%Post-retirement benefit 3.5% up to 6% 3.0% 4.0% 3.5%Inflation rate 2.5% 2.5% 3.0% 3.0% 2.5%43
Washington Metropolitan Area Transit AuthorityFY 20<strong>07</strong> Comprehensive Annual Financial ReportNotes to Basic Financial StatementsJune 30, 20<strong>07</strong> and 2006(8) Pension Plans (Continued)The Salaried Personnel Plan and the Union Local 2 Plan had a change in the mortality assumption for healthyparticipants from the RP-2000 mortality table projected to 2005 to the RP-2000 mortality table projected to 20<strong>07</strong>.The effect of this change in the mortality assumption was an increase in the re<strong>com</strong>mended contributions to theSalaried Personnel Plan and Union Local 2 Plan of $170,000 and $43,000, respectively.There were no significant assumption changes from prior year valuation for the Transit Police Plan, Union Local 689Plan and Local 922 Plan.The significant <strong>com</strong>ponents of the APC and changes in the net pension obligation (asset) are as follows (inthousands):SalariedPersonnelPlanTransitPolicePlanUnionLocal 689PlanUnionLocal 922PlanUnionLocal 2Plan7/1/2006 1/1/2006 1/1/2006 1/1/2006 7/1/2006Net pension assets beginning of year $ - $ - $ (183,564) $ (2,833) $ -Annual required contribution 10,373 5,098 6,001 3,377 3,035Interest on net pension assets (179) - (14,685) (220) (30)Adjustment to annual requiredcontribution 262 - - 237 43Annual pension cost 10,456 5,098 (8,684) 3,394 3,048Net pension obligations (assets)before contributions 10,456 5,098 (192,248) 561 3,048Adjustments to beginning balance (2,243) - - (315) (370)Contributions made (9,358) (5,098) (6,001) (3,275) (3,044)Net pension assets end of year $ (1,145) $ - $ (198,249) $ (3,029) $ (366)7/1/2005 1/1/2005 1/1/2005 1/1/2005 7/1/2005Net pension assets beginning of year $ - $ - $ (198,047) $ (2,864) $ -Annual required contribution 9,156 5,427 - 3,213 3,065Interest on net pension assets - - (15,844) (201) -Adjustment to annual requiredcontribution - - 30,327 216 -Annual pension cost (in<strong>com</strong>e) 9,156 5,427 14,483 3,228 3,065Net pension obligations (assets)before contributions 9,156 5,427 (183,564) 364 3,065Contributions made (9,156) (5,427) - (3,197) (3,065)Net pension assets end of year $ - $ - $ (183,564) $ (2,833) $ -44
Washington Metropolitan Area Transit AuthorityFY 20<strong>07</strong> Comprehensive Annual Financial ReportNotes to Basic Financial StatementsJune 30, 20<strong>07</strong> and 2006(8) Pension Plans (Continued)(c)Trend InformationA summary of trend information for each plan follows (dollars in thousands):YearEndingAnnualPensionCostPercentage ofAPCContributionNet PensionAssetSalaried Personnel Plan 7/01/06 $ 10,45689.5% $ (1,145)7/01/05 $ 9,156100.0% -7/01/04 $ 8,385100.0% -Transit Police Plan 1/01/06 $ 5,098100.0% -1/01/05 $ 5,427100.0% -1/01/04 $ 3,900100.0% -Union Local 689 1/01/06 $ (8,684)N/A $ (198,249)1/01/05 $ 14,483N/A $ (183,564)1/01/04 $ (17,209)N/A $ (198,047)Union Local 922 1/01/06 $ 3,39496.5% $ (3,029)1/01/05 $ 3,22899.0% $ (2,833)1/01/04 $ 3,24695.3% $ (2,864)Union Local 2 7/01/06 $ 3,048100.0% $ (366)7/01/05 $ 3,065100.0% $ -7/01/04 $ 3,098100.0% $ -(d)Defined Contribution Retirement PlanThe Authority offers a defined contribution retirement plan, Washington Metropolitan Area Transit AuthorityDefined Contribution Retirement Plan and Trust, for salaried employees under the terms of the InternalRevenue Code 401(a). The 401(a) plan, adopted on December 10, 1998 for employees hired on or afterJanuary 1, 1999, provides for the Authority to contribute an amount equivalent to 4 percent of the employee’sbase salary into a trust. The employee is not required to make contributions into the 401(a) plan; however, ifthe employee contributes up to 3 percent of base salary to the 457 Deferred Compensation plan, the Authoritywill contribute an additional amount of up to 3 percent to the 401(a) plan to equal the employee’s contributionto the 457 plan. Employees are 100 percent vested after three years of service. A year of vesting is 1,000hours of service in a calendar year. There is no interim vesting. Accrued 401(a) benefits will be paid to theemployee (or rolled over) upon leaving Authority employment any time after full vesting. The provisions of theplan can be amended by the Board of Directors. This right to amend the plan is subject to the condition thatall of the plan assets be used exclusively for the benefit of the participants, retired participants and theirbeneficiaries under the plan.The Authority contributed $3,209,600 and $2,698,000 for the years ended June 30, 20<strong>07</strong> and 2006,respectively.45
Washington Metropolitan Area Transit AuthorityFY 20<strong>07</strong> Comprehensive Annual Financial ReportNotes to Basic Financial StatementsJune 30, 20<strong>07</strong> and 2006(8) Pension Plans (Continued)(e)Deferred CompensationThe Authority offers a deferred <strong>com</strong>pensation plan for salaried employees under the terms of the InternalRevenue Section 457(g). Under the 457 plan, employees are permitted to defer up to 100 percent of salarynot to exceed $15,500 annually on a pre-tax basis. Deferred <strong>com</strong>pensation is not available to employees untiltermination, retirement, death, or an unforeseeable emergency. The Authority does not match employees’contributions to the 457 plan.(9) Post-Retirement BenefitsIn addition to providing pension benefits, the Authority provides certain health care and life insurance benefits forretired employees, in accordance with labor agreements and Board of Directors’ approved policy. Substantially allof the Authority's employees may be<strong>com</strong>e eligible for these benefits if they reach retirement age while working forthe Authority. These and similar benefits for active employees are provided through insurance <strong>com</strong>panies whosepremiums are based on the benefits provided during the year.The Authority recognizes the cost of providing these benefits by expensing the annual insurance premiums, whichwere approximately $125,638,000 and $118,695,000 for June 30, 20<strong>07</strong> and 2006, respectively. The cost ofproviding benefits for approximately 3,900 retirees and beneficiaries is not separable from the cost of providingbenefits for approximately 10,000 active participating employees and cannot be reasonably estimated.(10) Commitments and Contingencies(a) Litigation and ClaimsThe Authority is exposed to various risks of loss related to torts; theft of, damage to and destruction of assets;and natural disasters. The Authority has a self-insurance program for third-party public liability and propertydamage up to $5,000,000 per occurrence. The Authority purchases <strong>com</strong>mercial insurance for liabilitiesexceeding the self-insurance limits up to a maximum of $100,000,000 per occurrence. Additionally, theAuthority has a wholly self-insured program for workers’ <strong>com</strong>pensation. Settled claims have not exceededthis <strong>com</strong>mercial <strong>cover</strong>age during any of the past three fiscal years.Liabilities are reported when it is probable that a loss has occurred and the amount of the loss can bereasonably estimated. When a claim is either made against the Authority or when there is a sufficient reasonto believe an incident has resulted in bodily injury or property damage for which the Authority may be liable, adollar amount is reserved for that claim. Management calculates the “potential worth” of each claim andadjusts the reserves as the claim develops. Liabilities include an amount for losses that have been incurredbut not reported.Liabilities are reported in the self-insurance funds when it is probable that losses have occurred and theamounts of the losses can be reasonably estimated. Liabilities include an amount for claims that have beenincurred but not reported to date. Because actual claims liabilities depend on such <strong>com</strong>plex factors asinflation, changes in governing laws and standards, and court awards, the process used in <strong>com</strong>puting claimsliabilities is reevaluated periodically, to include an annual actuarial study, to take into consideration thehistory, frequency and severity of recent claims and other economic and social46
Washington Metropolitan Area Transit AuthorityFY 20<strong>07</strong> Comprehensive Annual Financial Report(10) Commitments and Contingencies (Continued)(a) Litigation and Claims (Continued)Notes to Basic Financial StatementsJune 30, 20<strong>07</strong> and 2006factors. These liabilities are <strong>com</strong>puted using a <strong>com</strong>bination of actual claims experience and actuariallydetermined amounts and include any specific, incremental claim adjustment expenses and estimatedre<strong>cover</strong>ies. The liabilities do not include nonincremental claim adjustment expenses. The claims liabilities inthe self-insurance funds are discounted at 4.0 percent at June 30, 20<strong>07</strong> and 2006, respectively, to reflectanticipated investment in<strong>com</strong>e.Changes in the estimated liability for the years ended June 30, 20<strong>07</strong> and 2006 are as follows (in thousands):20<strong>07</strong> 2006Estimated liability for injury anddamage claims, beginning of year $ 85,172$ 64,959Incurred new claims 42,383 30,710Changes in estimate for claims of prior periods (10,637) 16,685Payments on claims (19,654) (27,182)Estimated liability for injury anddamage claims, end of year $ 97,264$ 85,172Due within one year $34,394 $29,995The Authority is a party to a number of claims arising from the construction of the transit system. Thesematters principally relate to contractor claims for additional <strong>com</strong>pensation in excess of the original contractprice. In the opinion of management, including its General Counsel, the ultimate resolution of these matterswill not have a material effect on the Authority's financial position and results of operations.The Authority is a party in various legal actions and claims brought by or against it. At June 30, 20<strong>07</strong>, theAuthority had claims totaling approximately $5,650,000, which were reasonably possible that a loss may beincurred.The Tax Increase Prevention and Reconciliation Act of 2005 established a new excise tax to be imposed ontax-exempt and governmental entities that engage in various transactions classified by the Internal RevenueService as “listed transactions”. <strong>WMATA</strong> is uncertain whether the tax will apply to it for various reasons,including the absence of implementing regulations from the Internal Revenue Service.Therefore, the financial impact is not determinable at this time.(b) Leasing CommitmentIn September 1999, the Authority entered into a 10-year operating lease for office space. The terms of thelease set forth scheduled rent increases to occur annually. Lease payments for years ended June 30, 20<strong>07</strong>and 2006 are $706,000 and $686,000, respectively.47
Washington Metropolitan Area Transit AuthorityFY 20<strong>07</strong> Comprehensive Annual Financial Report(10) Commitments and Contingencies (Continued)(b) Leasing Commitment (Continued)Notes to Basic Financial StatementsJune 30, 20<strong>07</strong> and 2006The Authority’s minimum lease payments as of June 30, 20<strong>07</strong> are as follows (in thousands):Fiscal Year Total2008 $ 7272009 7492010 189$ 1,665(c) Fuel Price Swap AgreementObjective of the swap: The Authority entered into fuel price swap agreements to plan its fuel costs for theyear and to protect itself against increases in the market price of fuel.Terms: The Authority entered into <strong>com</strong>modity swap agreements for NYMEX No.2 heating oil as shown below(in thousands):Notionalquantitypercalculationperiod(gallons)Totalnotionalquantity(gallons)EffectiveDateMaturityDateMarketValue7/1/20<strong>07</strong> 12/1/20<strong>07</strong> 84 504 $ 667/1/20<strong>07</strong> 6/30/2008 84 1,008 1617/1/20<strong>07</strong> 6/30/2008 84 1,008 1697/1/20<strong>07</strong> 6/30/2008 210 2,520 5397/1/20<strong>07</strong> 6/30/2008 126 1,512 4047/1/20<strong>07</strong> 6/30/2008 84 1,008 315$1,654Payment between the swap parties is the price per gallon equal to the unweighted arithmetic mean of each ofthe closing settlement prices quoted by the NYMEX on each NYMEX trading day during the settlement periodfor the No.2 heating oil futures.Fair value: As of June 30, 20<strong>07</strong>, the swap agreement had a positive fair value of $1,654,000 estimated byusing a mathematical approximation of market value derived from both proprietary models as of a given datebased on certain assumptions regarding past, present and future market conditions and certain financialinformation from other sources.Credit value: The Authority is exposed to credit risk in the amount of its fair value. The long-term depositratings for the swap counterparty were AA per Standard & Poor’s and AA per Fitch.48
Washington Metropolitan Area Transit AuthorityFY 20<strong>07</strong> Comprehensive Annual Financial Report(10) Commitments and Contingencies (Continued)(c) Fuel Price Swap Agreement (Continued)Notes to Basic Financial StatementsJune 30, 20<strong>07</strong> and 2006Termination risk: The Authority or the counterparty may terminate the swap if the other party fails to performunder the terms of the contract. Also, if at the time of the termination the swap has a negative fair value, theAuthority would be liable to the counterparty for a payment equal to the swap’s fair value.(d) OtherConstruction and capital improvement costs are funded by federal grants, local matching funds, and thirdparty agreements. As of June 30, 20<strong>07</strong>, the Authority is <strong>com</strong>mitted to expend approximately $142,529,000(unaudited) on future construction, capital improvement and other miscellaneous projects. The federalfunding is subject to audit by the U.S. Government, in the opinion of management, disallowed costs if any, willnot have a material effect on the financial position of the Authority.(11) Leasing TransactionsDuring fiscal year 1999, the Authority entered into 13 transactions to lease 680 rail cars to 13 equity investors (the“headlease”) and simultaneously subleased the rail cars back (the “sublease”). Trusts were created coincident tothese transactions to serve as the lessee/sublessor. Under the headlease agreements, the Authority retains theright to use the rail cars and is also responsible for their continued maintenance and insurance.During fiscal year 2003, the Authority entered into two additional transactions to lease 78 rail cars. Thesetransactions resulted in a net payment to the Authority in fiscal year 2003 of approximately $8,700,000, which willbe amortized over the life of the lease. Subsequent to the execution of the fiscal year 2003 leases, $1,000,000 ofthe proceeds was reserved to <strong>cover</strong> any potential liabilities, in the event that the Authority is required to obtain anew lender.In August 2003, the Authority entered into a lease transaction for 48 rail cars. This transaction resulted in a netpayment to the Authority of approximately $10,000,000, which was recorded as deferred lease revenue and willbe amortized over the life of the lease. Of this amount, $500,000 was reserved for any contingencies.The Authority’s sublease arrangements have been recorded similar to a capital lease arrangement in that thepresent value of the future lease payments have been recognized on the Statements of Net Assets as obligationsunder lease agreements.At closing, the rail cars for fiscal year 1999 leases had a fair value of approximately $1,200,000,000 and a netbook value of approximately $226,301,000. The rail cars for fiscal year 2003 leases had a fair value ofapproximately $194,100,000 and a net book value of approximately $66,834,000. The rail cars for the fiscal year2004 lease had a fair value of $130,780,000 and a net book value of approximately $78,800,000.As part of the headlease agreements, the Authority received prepayments equivalent to the net present value ofthe headlease obligations. The Authority transferred a portion of these proceeds to third party49
Washington Metropolitan Area Transit AuthorityFY 20<strong>07</strong> Comprehensive Annual Financial Report(11) Leasing Transactions (Continued)Notes to Basic Financial StatementsJune 30, 20<strong>07</strong> and 2006lenders/undertakers in accordance with the terms of debt and equity payment undertaking agreements. Theseagreements constitute <strong>com</strong>mitments by the debt and equity payment undertakers to pay the Authority’s subleaseand buy-out options under the terms of the subleases. The debt and equity payment undertakers’ performanceunder the agreement is guaranteed by their parent <strong>com</strong>pany. As the debt and equity payment undertakingagreements have been structured to meet all future obligations under the sublease, the Authority has recordedthe amounts held by the payment undertakers as a prefunded lease <strong>com</strong>mitment on the Statements of NetAssets.The obligation under lease agreements and the prefunded lease <strong>com</strong>mitment are adjusted annually to reflect thechange in the net present value of the related sublease and buy-out options.The excess of the prepayments received over the prepayment paid to the lease payment undertakers wasrecorded as deferred lease revenue and will be recognized by the Authority over the life of the lease.The following table sets forth the aggregate amounts due under the sublease agreements (in thousands):Future minimum payments due:2008 $ 132,2642009 162,9252010 127,9172011 152,7782012 146,7332013-2017 790,6312018-2022 454,7252023-2027 130,5852028-2031 97,124Total future minimum payments 2,195,682Less imputed interest 768,610Present value of minimum lease payments $ 1,427,<strong>07</strong>250
Washington Metropolitan Area Transit AuthorityFY 20<strong>07</strong> Comprehensive Annual Financial Report(12) Changes in Long-Term LiabilitiesNotes to Basic Financial StatementsJune 30, 20<strong>07</strong> and 2006Long-term liabilities activity for the years ended June 30, 20<strong>07</strong> and 2006, was as follows (in thousands):Injury &DamageClaimsBeginning balance, July 1, 2005 64,959RetainageonContractsDeferredLeaseBondsRevenue Payable$ 227,900ObligationsUnder LeaseAgreements$$ $ 25,223 67,591 $ 1,479,140Additions 47,395 13,225 - - 84Reductions (27,182) (10,003) (5,701) (24,419) -Balance, June 30, 2006 85,172 28,445 61,890 203,481 1,479,224Additions 42,383 17,414 - (24,579) -Reductions (30,291) (11,622) (5,701) - (52,152)Ending balance, June 30, 20<strong>07</strong> $ 97,264 $ 34,237 $ 56,189 $ 178,902 $ 1,427,<strong>07</strong>2Due w ithin one year $ 34,394 $ 4,508 $ 5,469 $ 25,776 $ 132,264Noncurrent portion $ 62,870 $ 29,729 $ 50,720 $ 153,126 $ 1,294,80851
Washington Metropolitan Area Transit Authority FY 20<strong>07</strong> Comprehensive Annual Financial ReportRequired Supplementary InformationHistorical Trend Information – Pension PlansSchedules of Funding Progress(dollars in thousands)(unaudited)ActuarialValue ofAssetsActuarialAccruedLiability (AAL)UnfundedActuarial AccruedLiability (UAAL)(Funding Excess)UAAL as aPercentage ofCovered Payroll(Funding Excess)ActuarialValuation DateFundedRat ioCoveredPayrollSalaried Personnel Plan 7/1/2006 $ 349,796 $ 412,855 $ 63,059 84.7% $ 37,769 167.0%7/1/2005 $ 343,657 $ 395,416 $ 51,759 86.9% $ 40,750 127.0%7/1/2004 $ 330,582 $ 376,905 $ 46,323 87.7% $ 42,756 108.3%Union Local 689 Plan 1/1/2006 $ 2,068,831 $ 2,068,831 $ - 100.0% $ 465,458 0.0%1/1/2005 $ 1,977,425 $ 1,710,543 $ (266,882) 115.6% $ 437,399 (61.0)%1/1/2004 $ 1,877,321 $ 1,596,968 $ (280,353) 117.6% $ 425,147 (65.9)%Union Local 922 Plan 1/1/2006 $ 99,332 $ 113,544 $ 14,212 87.5% $ 22,267 63.8%1/1/2005 $ 91,191 $ 103,395 $ 12,204 88.2% $ 21,085 57.9%1/1/2004 $ 86,317 $ 95,233 $ 8,916 90.6% $ 19,176 46.5%Local 2 7/1/2006 $ 109,041 $ 116,915 $ 7,874 93.3% $ 17,628 44.7%7/1/2005 $ 104,006 $ 112,051 $ 8,045 92.8% $ 18,754 42.9%7/1/2004 $ 96,727 $ 105,016 $ 8,289 92.1% $ 20,384 40.7%Notes:The Transit Police Plan w as not included in this schedule, because it used the aggregate actuarial cost method.52
Washington Metropolitan Area Transit AuthorityFY 20<strong>07</strong> Comprehensive Annual Financial ReportSECTION THREE – STATISTICAL (Unaudited)This part of the Authority’s <strong>com</strong>prehensive annual financial report presents detailed information as acontext for understanding what the information in the financial statements, note disclosures, and requiredsupplementary information says about the Authority’s overall financial health.ContentsPageFinancial TrendsThese schedules contain trend information to help the reader understand how the Authority’s financialperformance and well-being have changed over time. 53Revenue CapacityThese schedules contain information to help the reader assess the Authority’s most significant localrevenue source, passenger revenue. 55Debt CapacityThese schedules present information to help the reader assess the affordability of the Authority’s currentlevels of outstanding debt and the Authority’s ability to issue additional debt in the future. 57Demographic and Economic InformationThese schedules offer demographic and economic indicators to help the reader to understand theenvironment within which the Authority’s financial activities take place. 58Operating InformationThese schedules contain service and infrastructure data to help the reader understand how theinformation in the Authority’s financial report relates to the services the Authority provides and theactivities it performs. 60Sources: Unless otherwise noted, the information in these schedules is derived from the <strong>com</strong>prehensive annual financial reports forthe relevant year.
Washington Metropolitan Area Transit Authority FY 20<strong>07</strong> Comprehensive Annual Financial ReportNet Assets by ComponentFor Fiscal Year 2002 to Fiscal Year 20<strong>07</strong>(amounts expressed in thousands)Fiscal Year2002 2003 2004 2005 2006 20<strong>07</strong>Invested in capital assets, net of related debt $7,148,786 $7,368,413 $7,414,886 $7,547,065 $7,904,568 $7,880,168Restricted 810,257 830,017 7<strong>07</strong>,353 572,675 379,254 265,884Total Net Assets $7,959,043 $8,198,430 $8,122,239 $8,119,740 $8,283,822 $8,146,052Source: The Authority's Audited Financial Statements.Note: The Authority implemented GASB Statement 34 in FY 2002.53
Washington Metropolitan Area Transit Authority FY 20<strong>07</strong> Comprehensive Annual Financial ReportChanges in Net AssetsFor Fiscal Year 2002 to Fiscal Year 20<strong>07</strong>(amounts expressed in thousands)Fiscal Year2002 2003 2004 2005 2006 20<strong>07</strong>Operating RevenuesPassenger revenue $ 394,153 $ 404,211 $ 453,043 $ 522,475 $ 555,262 $ 563,356Charter and contract revenue 7,746 9,597 3,806 3,395 3,909 6,767Advertising revenue 20,001 23,001 26,002 29,000 30,000 33,000Rental revenue 12,536 13,101 15,786 16,466 17,108 20,777Other revenue 2,563 1,195 1,348 1,206 1,199 1,192Total operating revenues 436,999 451,105 499,985 572,542 6<strong>07</strong>,478 625,092Nonoperating revenuesInvestment in<strong>com</strong>e 19,830 26,975 1,450 5,011 3,981 3,288Interest in<strong>com</strong>e from leasing transactions 78,181 80,560 88,562 91,924 88,548 87,874In<strong>com</strong>e from pension plans 53,702 17,610 - 16,687 - 16,392Other 1,924 3,544 3,277 3,790 9,413 12,281Total nonoperating revenues 153,637 128,689 93,289 117,412 101,942 119,835Total Revenues 590,636 579,794 593,274 689,954 709,420 744,927Operating expensesLabor 437,380 460,435 485,124 498,865 536,439 573,514Fringe benefits 201,061 215,878 250,784 272,756 271,577 302,416Services 64,140 62,192 67,696 77,063 102,081 117,867Materials and supplies 76,721 87,418 89,586 105,560 123,439 144,584Utilities 46,843 49,758 52,681 61,517 67,010 72,286Casualty and liability costs 4,842 4,871 12,467 16,869 44,688 28,223Leases and rentals 3,042 3,067 1,913 4,096 3,999 2,925Miscellaneous 5,364 3,749 2,778 3,253 5,205 3,452Depreciation and amortization 275,896 294,300 296,485 299,7<strong>07</strong> 306,955 361,141Total operating expenses 1,115,289 1,181,668 1,259,514 1,339,686 1,461,393 1,606,408Nonoperating expensesInterest expense from leasing transactions 78,181 80,560 88,562 91,924 88,548 87,874Interest expense 12,411 11,706 12,517 10,611 9,978 11,838Pension plans expense - - 23,808 - 14,514 -Total nonoperating expenses 90,592 92,266 124,887 102,535 113,040 99,712Total Expenses 1,205,881 1,273,934 1,384,401 1,442,221 1,574,433 1,706,120Jurisdictional subsidies, capital grants and 1,<strong>07</strong>7,138 933,527 714,936 749,768 1,029,095 823,423capital subsidiesIncrease in Net Assets $ 461,893 $ 239,387 $ (76,191) $ (2,499) $ 164,082 $ (137,770)Source: The Authority's Audited Financial Statements.Note: The Authority implemented GASB Statement 34 in FY 2002.54
Washington Metropolitan Area Transit AuthorityFY 20<strong>07</strong> Comprehensive Annual Financial ReportPrincipal Revenue Pay CategoriesFor Fiscal Year 1998 and Fiscal Year 20<strong>07</strong>Fiscal 1998Private18%Offsite35%Federal Agency25%Sales Office22%Private26%Fiscal 20<strong>07</strong>Offsite9%Sales Office4%Federal Agency61%Federal Agency pay category consists of federal agencies in the Washington Metropolitan area.Offsite pay category consists of private and county retail sales outlets.Private pay category consists of private sector employers.Sales Office pay category consists of Authority owned and operated sales outlets.Source: The Authority’s Office of Customer and Media55
Washington Metropolitan Area Transit Authority FY 20<strong>07</strong> Comprehensive Annual Financial ReportPassenger Fare StructureFor Fiscal Year 1998 to Fiscal Year 20<strong>07</strong>FiscalYearMetrobusMetrorailPeak/Off Peak Peak Off PeakDC MD VA Boarding Each Additional Boarding Each AdditionalBase Base Base Charge Composite Mile Charge Composite Mile1998 $1.10 $1.10 $1.10 $1.10 $.19 (3-6miles) $1.10 (0-7miles) n/a$.165 (6+miles) $1.60 (7-10miles) n/a$3.25 (Max.fare) $2.10 (10 miles) n/a1999 $1.10 $1.10 $1.10 $1.10 $.19 (3-6miles) $1.10 (0-7miles) n/a$.165 (6+miles) $1.60 (7-10miles) n/a$3.25 (Max.fare) $2.10 (10 miles) n/a2000 $1.10 $1.10 $1.10 $1.10 $.19 (3-6miles) $1.10 (0-7miles) n/a$.165 (6+miles) $1.60 (7-10miles) n/a$3.25 (Max.fare) $2.10 (10 miles) n/a2001 $1.10 $1.10 $1.10 $1.10 $.19 (3-6miles) $1.10 (0-7miles) n/a$.165 (6+miles) $1.60 (7-10miles) n/a$3.25 (Max.fare) $2.10 (10 miles) n/a2002 $1.10 $1.10 $1.10 $1.10 $.19 (3-6miles) $1.10 (0-7miles) n/a$.165 (6+miles) $1.60 (7-10miles) n/a$3.25 (Max.fare) $2.10 (10 miles) n/a2003 $1.20 $1.20 $1.20 $1.20 $.21 (3-6miles) $1.20 (0-7miles) n/a$.185 (6+miles) $1.70 (7-10miles) n/a$3.60 (Max. fare) $2.20 (10+ miles) n/a2004 $1.25 $1.25 $1.25 $1.35 $.22 (3-6miles) $1.35 (0-7miles) n/a$.195 (6+miles) $1.85 (7-10miles) n/a$3.90 (Max. fare) $2.35 (10+ miles) n/a2005 $1.25 $1.25 $1.25 $1.35 $.22 (3-6miles) $1.35 (0-7miles) n/a$.195 (6+miles) $1.85 (7-10miles) n/a$3.90 (Max. fare) $2.35 (10+ miles) n/a2006 $1.25 $1.25 $1.25 $1.35 $.22 (3-6miles) $1.35 (0-7miles) n/a$.195 (6+miles) $1.85 (7-10miles) n/a$3.90 (Max. fare) $2.35 (10+ miles) n/a20<strong>07</strong> $1.25 $1.25 $1.25 $1.35 $.22 (3-6miles) $1.35 (0-7miles) n/a$.195 (6+miles) $1.85 (7-10miles) n/a$3.90 (Max. fare) $2.35 (10+ miles) n/a*The paratransit (MetroAccess) fare, per Tariff number 23, is $2.50 or double the regular base fare, if less.Source: Tariff of The Washington Metropolitan Area Transit Authority56
Washington Metropolitan Area Transit AuthorityFY 20<strong>07</strong> Comprehensive Annual Financial ReportPledged-Revenue CoverageFor Fiscal Year 1998 to Fiscal Year 20<strong>07</strong>( amounts expressed in thousands)Less: NetFiscal Operating Available Debt ServiceYear Revenue Expenses Revenue Principal Interest Total Coverage1998 $ 680,065 652,833 $ 27,232 $ 12,215 15,017 $ 27,232 100%1999 $ 702,269 675,115 $ 27,154 $ 12,780 14,374 $ 27,154 100%2000 $ 754,423 727,296 $ 27,127 $ 13,440 13,687 $ 27,127 100%2001 $ 838,899 811,734 $ 27,165 $ 14,095 13,<strong>07</strong>0 $ 27,165 100%2002 $ 866,539 839,393 $ 27,146 $ 14,735 12,411 $ 27,146 100%2003 $ 914,489 887,368 $ 27,121 $ 15,415 11,706 $ 27,121 100%2004 $ 1,175,871 986,837 $ 189,034 $ 176,470 12,517 $ 188,987 100%2005 $ 1,<strong>07</strong>2,480 1,039,979 $ 32,501 $ 21,890 10,611 $ 32,501 100%2006 $ 1,201,970 1,168,952 $ 33,018 $ 23,040 9,978 $ 33,018 100%20<strong>07</strong> $ 1,280,970 1,245,267 $ 35,703 $ 23,865 11,838 $ 35,703 100%Revenues consists of operating revenues, non-operating revenues, jurisdictional subsidiesand principal paid on revenue bonds. In<strong>com</strong>e from leasing tranactions is excluded.Operating expenses excludes depreciation and amortization, and non-operating expenses,except expenses from pension plans.Source: The Authority's Audited Financial Statements.57
Washington Metropolitan Area Transit Authority FY 20<strong>07</strong> Comprehensive Annual Financial ReportMajor Private EmployersFor Fiscal Year 20<strong>07</strong>AreaEmployer Rank Employees IndustryMcDonald's Corp. 1 32,000 FoodNorthrop Grumman Corp. 2 20,220 Aerospace/defenseVerizon Communications Inc. 3 18,200 Tele<strong>com</strong>municationsScience Applications International Corp. 4 16,630 Information TechnologyWal-Mart Stores Inc. 5 14,900 RetailAhold USA 6 14,206 RetailSafeway Inc. 7 11,000 RetailComputer Sciences Corp. 8 10,416 Information TechnologyFederated Department Stores Inc. 9 8,000 RetailInternational Business Machines Corp. 10 7,600 Information TechnologyInternational BusinessMachines Corp.5%Federated DepartmentStores Inc.5%Computer SciencesCorp.7%McDonald's Corp21%Safeway Inc.7%Ahold USA9%Northrop GrummanCorp13%Wal-Mart Stores Inc.10%Science ApplicationsInternational Corp.11%VerizonCommunications Inc.12%Source: Washingtonpost.<strong>com</strong> - Post 200/20<strong>07</strong>/ Major Employers58
Washington Metropolitan Area Transit Authority FY 20<strong>07</strong> Comprehensive Annual Financial ReportAuthorized Employee PositionsFor Fiscal Year 1998 to Fiscal Year 20<strong>07</strong>1998 1999 2000 2001 2002 2003 2004 2005 2006 20<strong>07</strong>Non-Union 1,230 1,266 1,313 1,511 1,525 1,586 1,457 1,540 1,640 1,673AFL-CIO/OPIEU Local - 2 640 639 601 622 662 689 739 785 794 818FOP Transit Police 252 252 257 271 305 305 319 321 336 356Teamsters Local - 639 65 65 65 65 70 75 90 89 89 89AFL-CIO ATU Local - 689 5,990 6,<strong>07</strong>1 6,310 6,580 7,064 7,133 7,042 7,2<strong>07</strong> 7,237 7,809Teamsters Local - 922 317 317 321 370 339 368 368 352 355 357Total Authority Positions 8,494 8,610 8,867 9,419 9,965 10,156 10,015 10,294 10,451 11,102Source: The Authority's Approved Annual Budgets.59
Washington Metropolitan Area Transit AuthorityFY 20<strong>07</strong> Comprehensive Annual Financial ReportOperating IndicatorsFor Fiscal Year 1998 to Fiscal Year 20<strong>07</strong>Fiscal Annual Vehicle Annual Vehicle Annual Annual PassengerYear Revenue Miles Revenue Hours Unlinked Trips Trips1998Metrobus 33,240,586 2,975,646 125,967,257 402,675,692Metrorail 44,788,104 2,109,821 213,044,900 1,<strong>07</strong>7,145,702Metro Access 2,394,185 152,414 200,844 1,981,3051999Metrobus 33,168,939 2,979,136 143,240,114 474,556,951Metrorail 46,166,860 2,165,262 212,620,976 1,044,703,469Metro Access 2,528,931 173,872 210,<strong>07</strong>8 2,018,9762000Metrobus 34,192,726 3,065,946 129,524,241 452,855,175Metrorail 48,243,553 2,260,586 218,273,257 1,190,448,841Metro Access 3,643,119 238,648 246,<strong>07</strong>1 2,498,6292001Metrobus 36,447,570 3,247,015 142,647,640 457,028,244Metrorail 51,553,445 2,316,049 235,731,726 1,362,866,338Metro Access 5,569,594 357,000 556,982 5,419,5982002Metrobus 37,934,187 3,349,152 147,771,191 450,768,806Metrorail 52,192,185 2,269,529 242,794,<strong>07</strong>8 1,438,336,161Metro Access 8,021,812 505,105 738,284 8,021,8122003Metrobus 38,897,499 3,433,521 147,831,547 447,551,132Metrorail 56,470,216 2,241,771 243,188,066 1,451,856,563Metro Access 9,786,953 631,341 972,425 9,786,9532004Metrobus 38,901,318 3,458,658 146,010,344 436,436,653Metrorail 58,205,365 2,312,490 250,659,980 1,5<strong>07</strong>,<strong>07</strong>2,928Metro Access 11,030,419 698,401 1,112,358 12,269,3082005Metrobus 38,458,955 3,422,983 153,392,000 453,290,328Metrorail 62,152,936 2,460,432 259,430,086 1,401,105,158Metro Access 12,179,777 765,719 1,253,948 13,686,2932006Metrobus 38,364,771 3,557,212 131,339,808 419,809,944Metrorail 63,577,383 2,513,934 274,767,272 1,577,789,264Metro Access 12,135,331 1,015,815 1,340,201 14,318,20420<strong>07</strong>Metrobus 38,421,414 3,398,732 131,489,651 410,761,850Metrorail 67,029,516 2,636,654 276,440,693 1,590,316,851Metro Access 14,861,434 1,270,731 1,276,870 17,422,600Source: National Transit Database60
The Circulator and Extra buses are part of the <strong>WMATA</strong> family.Enjoy Your Ride.Washington Metropolitan Area Transit Authority600 Fifth Street NW ❚ Washington, D.C. 20001