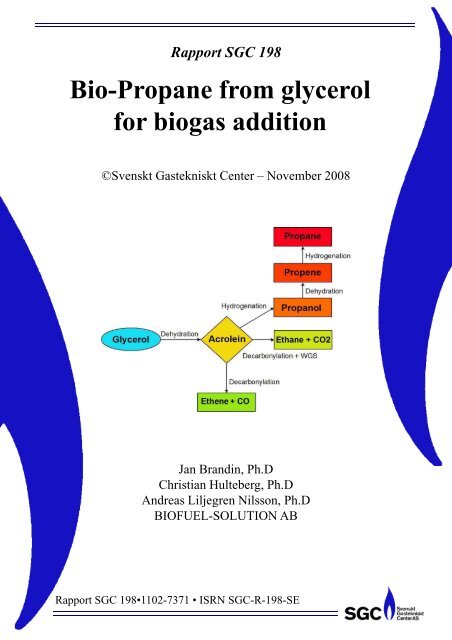
Rapport SGC 198 Bio-Propane from glycerol for biogas addition
Rapport SGC 198 Bio-Propane from glycerol for biogas addition
Rapport SGC 198 Bio-Propane from glycerol for biogas addition
- No tags were found...

Create successful ePaper yourself
Turn your PDF publications into a flip-book with our unique Google optimized e-Paper software.
1 Introduction ....................................................................................................................... 11.1 Background .................................................................................................................. 11.2 Project Outline ............................................................................................................. 22 Experimental Work ........................................................................................................... 42.1 Results .......................................................................................................................... 62.1.1 Glycerol to Acrolein ........................................................................................... 62.1.2 Acrolein to Propanol ........................................................................................... 62.1.3 Glycerol to Propanol ........................................................................................... 72.1.4 Propanol to Propene ............................................................................................ 82.1.5 Propanol to <strong>Propane</strong> ............................................................................................ 82.1.6 Glycerol to Propene ............................................................................................ 92.1.7 Glycerol to <strong>Propane</strong> .......................................................................................... 102.1.8 Acrolein to Ethene ............................................................................................ 102.1.9 Acrolein to Ethane ............................................................................................ 112.1.10 Glycerol to Ethane ............................................................................................ 122.2 Conclusions of Experimental Work ........................................................................... 133 Cost Estimate .................................................................................................................. 143.1 Unit Configurations .................................................................................................... 143.2 Production Cost Estimates ......................................................................................... 174 Conclusions ..................................................................................................................... 235 References ....................................................................................................................... 24iii
1 IntroductionIn Sweden today there are large quantities of bio-methane produced via fermentation of differentwaste products e.g. manure, municipal waste, stover, etc. In Sweden 330 GWh wasused <strong>for</strong> heating purposes and 40 GWh <strong>for</strong> electricity production in 2005 (1), while 0.23 TWhwas used in the transport sector in 2006 (2). The produced bio-methane is in many casescleaned, upgraded and transferred to the natural gas grid. However, the bio-methane produceddoes not, even after upgrading, have the same heating value and wobbe index as the naturalgas. The first causes problems concerning metering and billing and the latter is a potentialproblem to certain groups of equipment. To circumvent this problem in the Swedish context,where Danish gas <strong>from</strong> the North Sea is mainly used, propane is added to the <strong>biogas</strong> be<strong>for</strong>e itenters the natural gas grid. Currently the added propane is of fossil origin (3) and shouldthere<strong>for</strong>e be replaced by propane or another gaseous, higher hydrocarbon <strong>from</strong> a renewablesource.As an alternative source of propane this report aims at investigating the possibilities of producingbio-propane <strong>from</strong> bio-<strong>glycerol</strong>. During the production of biodiesel via transestrification<strong>from</strong> triglycerides, large quantities of <strong>glycerol</strong> are produced as by-product. Forevery 10 kg of biodiesel produced, 1 kg of <strong>glycerol</strong> is <strong>for</strong>med. The significant worldwide increasein biodiesel production has resulted in a glut on the <strong>glycerol</strong> market, with decreasing<strong>glycerol</strong> prices as a result. Glycerol has traditionally been a high-value chemical used in thefood and cosmetic industry, but has over the last few years decreased in price <strong>from</strong> about7 SEK/kg to less than 0.3 SEK/kg (4). This, in combination with increased feedstock cost, hasbasically undermined the profitability of any biodiesel operation. It has however created anentirely new research area, <strong>glycerol</strong> upgrading to high value chemicals.Besides <strong>biogas</strong> the produced propane, or propane equivalent, can be envisioned to fulfil otherpurposes than the <strong>biogas</strong> application intended. One such alternative use would be as a “green”component in LPG, making it possible to substitute parts of the LPG used to a low carbonfootprint LPG.<strong>Bio</strong>Fuel-Solution i Malmö AB have since the beginning of 2007 per<strong>for</strong>med research withinthe field of <strong>glycerol</strong> conversion, mainly focused towards other alcohols. This research has todate resulted in 2 US patent applications, in association with an American biodiesel producer,and another 2 patent drafts within the field.1.1 BackgroundThe area of <strong>glycerol</strong> research has dramatically developed over the last 5-10 years, <strong>from</strong> thesynthesis of <strong>glycerol</strong> to the use of <strong>glycerol</strong> as a starting point <strong>for</strong> different synthesis. It is generallyaccepted that the primary source of renewable organic fuels, chemicals and materialswill be plant derived biomass (5) (6) (7) (8). But only 3% of the chemicals produced in theUS was biomass derived in 2004 (9). However, the US department of Energy (US DoE) aimat increasing the fraction of renewable chemicals to 17% by 2020 and 47% by 2050. Toachieve this, the US DoE has identified 12 chemicals to be used as building blocks <strong>for</strong> highvalue chemicals (10); <strong>glycerol</strong> is one of these and is readily available due to its productionwithin the biodiesel industry (11).The end-products most often mentioned in the <strong>glycerol</strong> context are ethylene- and1,2-propylene glycol and lactic acid. The first two chemicals are industrially important <strong>for</strong> themanufacturing of polymers, cooling fluids, food and cosmetics. Lactic acid is an importantfood industry chemical and the basis <strong>for</strong> producing poly-lactic acid (PLA). The demand of1
these chemicals is 500 ktons per annum (tpa) <strong>for</strong> lactic acid (12), 1 500 ktpa <strong>for</strong> propyleneglycol (13) and 2 500 ktpa <strong>for</strong> ethylene glycol (14). The commercialization of production ofthese products <strong>from</strong> <strong>glycerol</strong> using catalytic methods is projected to the very near future.Another interesting area of research is the utilization of <strong>glycerol</strong> as a substrate <strong>for</strong> microbialfermentation of different chemicals (15) (16) (17). However, in the case of fermentation theresulting products end up in a dilute aqueous solution and need some <strong>for</strong>m of separation, usuallyenergy intense, be<strong>for</strong>e sale or use. But the selectivity of these processes is generally exceptionallygood. The product spectra found in the literature is larger <strong>for</strong> microbial conversionof <strong>glycerol</strong> than <strong>for</strong> catalytic and includes: 1,3-propylene glycol, butanol, ethanol, methanol,hydrogen, propionic acid etc. (18).Reacting <strong>glycerol</strong> to useful chemicals can be per<strong>for</strong>med either in the gas phase or in the liquidphase, with both methods having advantages. In the gas phase the <strong>glycerol</strong> has to be vaporizedand then reacted, which potentially lead to heat losses. In the liquid phase, the selectivity isusually lower and more advanced catalysts have to be used to achieve a reasonable productdistribution.1.2 Project OutlineWithin the scope of the per<strong>for</strong>med project, the possibility to produce fuel additives to <strong>biogas</strong><strong>from</strong> bio-<strong>glycerol</strong> has been investigated. The investigated fuel additives have been propane,which is normally used in <strong>biogas</strong> carburetion, and ethane as an alternative. The need <strong>for</strong> anadditive is determined by the high Wobbe-index of the natural gas used in Sweden, requiringany <strong>biogas</strong> entering the natural gas grid to have the same Wobbe-index. <strong>Bio</strong>gas (containingmainly methane) is situated in the outskirts of the allowed area <strong>for</strong> natural gas, figure 1; howeverthe <strong>biogas</strong> produced and entered into the gas grid, also have to match more specific criterias.In that the exported, upgraded <strong>biogas</strong> has to match the existing natural gas <strong>for</strong> meteringpurposes as well.2
The feed usually consists of a water solution with either 10-20 w% of <strong>glycerol</strong>, acrolein orpropanol. The solution is stored in a pressurized vessel and the inlet flow rate is controlled bya mass-flopoint, nitrogen or hydrogen gas could be introducedd into the stream to facilitate the vaporiza-tion. Depending onthe actualexperiment, one (1) or more of the three reactors in series wascontroller. The inlet liquid flow is heated and vaporized in thepre-heater. At thisused, normally withdifferent catalysts and space velocities. After leaving the final reactor, thegas wascooled down and condensed in a water-cooled condenser. The individual reactors aredepictedd in figure 4.Pre-HeaterReactor 1Reactor 2Reactor 3Figure 4 Individual drawings of the pre-heater and the three reactors used.At this point a liquid sample was collected <strong>for</strong> analysis. The un-condensable gas was meas-liquidured bya digital gas flow meter and a gas sample was collected in a sample bag. Theanalysiss were per<strong>for</strong>med using a Varian CP-3800 gas chromatograph equipped witha 1177split/split-less injector, a CP-wax 58/FFAP column and a flame ionizationn detector. The per-manent gas analysis was per<strong>for</strong>med using a CP-4900 gas chromatograph, using botha mol-sieve 5APLOT column and a PoraPlot column with two TCD detectors.5
2.1 ResultsIn this section the results <strong>from</strong> the various experiments per<strong>for</strong>med will be reviewed, startingwith the individual reactions and advancing towards more complex reaction systems.2.1.1 Glycerol to AcroleinThe first reaction, independent of desired end-product is to convert the <strong>glycerol</strong> feedstock intoacrolein. Acrolein is an unsaturated aldehyde, meaning that it is an activated molecule thatcan be further processed:HOCH 2 -CH 2 OH-CH 2 OH CH 2 =CH-CHO +2 H 2 OTwo water molecules are removed <strong>from</strong> the <strong>glycerol</strong> molecule (dehydration) on an acidic catalyst.In this case the reaction is per<strong>for</strong>med in the gas phase, at a temperature of approximately250-300°C. Glycerol solution (20 w% in water) at a rate of 18 g/h was used in this experiment.In the pre-heater the liquid is heated and gasified be<strong>for</strong>e entering the dehydrogenationreactor, with 25 g of catalyst (Z-1152 10-20 mesh). A small carrier-gas stream of 50 ml/minof N 2 was added to the gas stream be<strong>for</strong>e entering the reactor. The reactor 1 inlet temperaturewas 265°C and the run was per<strong>for</strong>med atmospheric. The result of a 60 h run is shown in figure5.100 %80 %Yield %60 %40 %Acrolein yieldHydroxyacetone yield20 %0 %0 10 20 30 40 50 60Time (h)Figure 5 Conversion of <strong>glycerol</strong> to acrolein, normalized carbon balance.The experiment was per<strong>for</strong>med over a range of 7 days, operated approximately 8h per day.Full conversion of the <strong>glycerol</strong> was obtained and the yield of acrolein was high, in the rangeof 90%. The only condensable by-product obtained was hydroxyacetone, in the range of 10%yield.2.1.2 Acrolein to PropanolThe next step in obtaining propane <strong>from</strong> <strong>glycerol</strong>, is the reaction of the acrolein <strong>for</strong>med topropanol. In this experiment, the production of 1-propanol is demonstrated using acrolein as astarting point. In reactor 1, 14 g of hydrogenation catalyst was used (BF-1015). A feed of18 g/h of 10 w% of acrolein in water was used. 400 ml/min of hydrogen was added to the6
inlet stream in the pre-heater. Inlet temperature to the reactor was 230°C and a total pressureof 5 bar(a) was used, figure 6.Figure 6 Conversion of acrolein to 1-propanol, normalized carbon balance.Full conversion of the acrolein was obtained and in figure 6 it can be seen that a yield of 70-80% was obtained. As a by-product, a 20% yield of propionaldehyde was obtained at the specificreaction conditions.2.1.3 Glycerol to PropanolIn this experimental section the process <strong>from</strong> <strong>glycerol</strong> to propanol was demonstrated, thatmeans that the dehydration and hydrogenation steps demonstrated above was integrated. Inthe experimental setup, in figure 5 above, reactor 1 was loaded with 30 g dehydrogenationcatalyst (Z-1152 10-20 mesh) and reactor 2 was loaded with 12 g of a commercial hydrogenationcatalyst. The inlet feed rate was 18 g/h of 20 w% <strong>glycerol</strong> solved in water. Inlet temperatureswere 290°C <strong>for</strong> reactor 1 and 260°C <strong>for</strong> reactor 2 and the reaction was per<strong>for</strong>med at 5bar(a) pressure. The results are shown in figure 7.100Conversion of Glycerol to PropanolYield or balance %908070605040302010Carbon balance2-Propanol Yield1-Propanol YieldPropionaldehyde Yield00 2 4 6 8 10 12 14 16Time on stream (h)Figure 7 Conversion of <strong>glycerol</strong> to propanol using two reactors.7
The reaction was initialized during a period of 6 hours and then reached a more stable state.The main products are 1-propanol (50% yield) and 2-propanol (5% yield). Both propanols canbe dehydrated into propene. The major by-product is propionaldehyde with a yield of 10%.The propionaldehyde is an intermediate in the hydrogenation of acrolein into propanol andcan be fully hydrogenated with longer residence time in the reactor, higher temperature or amore active catalyst. In figure 7, it can be seen that a decrease of the propionaldehyde contentcauses an increase in the propanol content. This means that there is an overall yield in thisexperiment of 65-70%, with a carbon balance of 80%.2.1.4 Propanol to PropeneIn this experiment the dehydration of propanol into propene was demonstrated. In this case,only reactor 1 in the experimental set-up in figure 3 was loaded with 30 g catalyst (Z-1104 10-20 mesh). The inlet feed to the system was 18 g/h consisting of 10 w% propanol in water. Acarrier-gas flow of 50 ml/min of N 2 was added be<strong>for</strong>e the pre-heater and used to transport the<strong>for</strong>med gas-phase components, since the major system component (water) was condensedafter the reaction. The inlet temperature of reactor 1 was 255°C and the reaction was per<strong>for</strong>medat atmospheric pressure. The results are shown in figure 8.Dehydration of 1-propanol100 %90 %80 %Yield and Balance %70 %60 %50 %40 %30 %20 %10 %CarbonbalancePropene YieldCO + CO Yield2Ethane +Eten YieldMethane Yield0 %0 1 2 3 4 5 6 7 8Time (h)Figure 8 Conversion of propanol to propene.In figure 8 the major product is propene with a yield of 70-75%. The major by-products arecarbon dioxide and carbon monoxide. A small amount of methane is <strong>for</strong>med (1-2% yield) andtraces of ethene and ethane.2.1.5 Propanol to <strong>Propane</strong>In this experiment, the conversion of propanol to propane was demonstrated. Reactor 1 wasloaded with 30 g of the dehydration catalyst (Z-1152 10-20 mesh) and reactor 2 was loadedwith 14 g of the purposely developed <strong>Bio</strong>fuel #1014 catalyst (10-20 mesh). 18 g/h of 10 w%propanol in water solution was fed to the unit and 400 ml/min of hydrogen was added in thepre-heater. The inlet temperature was 280°C in reactor 1 and 270°C in reactor 2 and the experimentwas run at 5 bar(a) pressure. In figure 9 the result of a 30 h run is shown. The yield ofpropane increases during the first 6-8 hours and is then stabilized around 85%. After 14 hoursthe inlet temperature of reactor 1 (dehydration) is decreased <strong>from</strong> 280°C to 230°C. This resultsin a sharp decrease in the propane production.8
Dehydration and hydrogenation of 1-PropanolYield and balance%110 %100 %90 %80 %70 %60 %50 %40 %30 %20 %10 %Carbonbalance<strong>Propane</strong>yieldPropeneyieldEthaneyieldMethaneyield0 %0 2 4 6 8 10 12 14 16 18 20 22 24 26 28 30 32Time (h)Figure 9 Conversion of propanol to propane.As the temperature of the dehydration reactor (reactor 1) is decreased the dehydration of propanoldecreases and the yield tales off However, after 22 hours the inlet temperature of reactor1 is returned to 280°C and the propane yield returns to approximately 85%.2.1.6 Glycerol to PropeneIn this experiment the integrated process <strong>for</strong> production of propene <strong>from</strong> <strong>glycerol</strong> is demonstrated.This means that it includes the <strong>glycerol</strong> to acrolein step, acrolein to propanol step andthe propanol to propene step. In the experimental set-up (figure 3) reactor 1 was loaded with30 g of dehydrogenation catalyst (Z-1152 10-20 mesh), reactor 2 with 12 g of commercialhydrogenation catalyst and reactor 3 with 30 g of dehydrogenation catalyst (Z-1104 10-20mesh). The inlet temperature was 280°C, 270°C and 280°C <strong>for</strong> reactor 1, 2 and 3 respectively.The feed was 18 g/h of 20 w% <strong>glycerol</strong> in water and the operation pressure was 5 bar(a).400 ml of hydrogen was added to the inlet stream in the pre-heater. In figure 10, the result of a30 h run is shown.100 %Conversion of <strong>glycerol</strong> to propene+ propane80 %Yield and balance %60 %40 %20 %CarbonbalancePropeneyield<strong>Propane</strong>yield0 %0 2 4 6 8 10 12 14 16 18 20 22Time (h)Figure 10 Conversion of <strong>glycerol</strong> to propene with H 2 present.9
In this run, a propene yield of 40% is obtained. There is also a small production of propane,approx. 10% yield. The major by-product, not shown in the figure, is carbon monoxide andcarbon dioxide. The propane present is probably a result of the hydrocarbon braking downinto CO and CO 2 by reaction with water, releasing hydrogen. This free hydrogen then causesthe hydrogenation of the <strong>for</strong>med propene into propane.2.1.7 Glycerol to <strong>Propane</strong>In this experiment, the production of predominately propane was demonstrated. The same setupwas used as in the experiment described above (Glycerol to Propene) but one further hydrogenationstep with 14 g <strong>Bio</strong>fuel #1014 catalyst was added. The inlet temperature was280°C, 270°C and 280°C <strong>for</strong> reactor 1, 2 and 3 respectively. The feed was 18 g/h of 20% <strong>glycerol</strong>in water and the operation pressure was 5 bar(a). 400 ml of hydrogen was added to theinlet stream in the pre-heater. The result of an 8 h run is shown in figure 11.100 %80 %<strong>Propane</strong> yieldEthane yieldEthene yieldMethane yieldCO 2yield60 %Yield %40 %20 %0 %2 3 4 5 6 7 8Time (h)Figure 11 Conversion of <strong>glycerol</strong> to propane with H 2 present in the reaction mix; the results are shown using anormalized carbon balance.The yield of propane is approximately 55% but there is also a 20% yield of ethane. This ishowever a sub-optimized experiment and by tweaking operation parameters and catalystcompositions, the yield of propane is expected to be significantly increased.2.1.8 Acrolein to EtheneAnother possible way to produce a saturated alkane <strong>from</strong> <strong>glycerol</strong> is by decarbonylation of theterminal aldehyde group. In this experiment the production of ethene <strong>from</strong> acrolein was demonstrated,the unsaturated hydrocarbon is <strong>for</strong>med since there is a lack of hydrogen productionfunctionality of the catalyst. 14 g of the <strong>Bio</strong>fuel #1013 catalyst was loaded in reactor 1. A 10w% of acrolein in water solution was fed into the reactor at a rate of 18 g/h. A carrier-gasflow of 100 ml/min of N 2 was added to the stream in the pre-heater. The reactor 1 inlet temperaturewas close to 300°C and the total pressure was 5 bar(a). In figure 12 the result of a10 h run is shown.10
Figure 12 Conversion of acrolein to ethene.In figure 12 it is possible to see that ethane is <strong>for</strong>med on a fresh non-reduced catalyst, but the<strong>for</strong>mation decreases and ethene is <strong>for</strong>med instead. This catalyst is however not optimal <strong>for</strong> theproduction of ethane. For this purpose a catalyst with improved hydrogen production functionalityhave to be developed.2.1.9 Acrolein to EthaneIn this experiment the production of ethane <strong>from</strong> acrolein by decarbonylation followed by thewater-gas shift reaction was demonstrated. 14 g of the <strong>Bio</strong>fuel #1011 catalyst was loaded inreactor 1. A 20 w% of acrolein in water solution was fed into the reactor at a rate of 18 g/h.100 ml/min of hydrogen was added to the stream in the pre-heater. The reactor 1 inlet temperaturewas 270°C and the total pressure was 5 bar(a). In figure 13, the result of a 4 h run isshown.100Yield of Ethane, CO+CO2 and PropanolYield %9080706050403020100PropanolEthaneCO+CO21.0 1.5 2.0 2.5 3.0 3.5 4.0 4.5Time on stream (h)Figure 13 Conversion of acrolein to ethane with H 2 present.11
In the reaction either a CO or a CO 2 is <strong>for</strong>med <strong>for</strong> each decarbonylated acrolein molecule.This means that the <strong>for</strong>med amount CO+CO 2 and ethane should be equal, if no other byreactionoccurs. The slight surplus of CO+CO 2 shows that a minor part of the acrolein is re<strong>for</strong>medover the catalyst. Another by-product is 1-propanol <strong>for</strong>med by hydrogenation of theacrolein, due to the high hydrogen pressure.100908070Yield (%)605040302010EthaneCO2COPropanoic acid00.0 0.2 0.4 0.6 0.8 1.0 1.2 1.4 1.6 1.8 2.0Time on stream (h)Figure 14 Conversion of acrolein to ethane without H 2 present.In figure 14, a result is shown of a run with the same conditions but without hydrogen present.Expected products were ethene and carbon dioxide:CH 2 =CH-CHO CH 2 =CH 2 + COHowever, rather unexpectedly, the products were ethane and carbon dioxide. This means thatthe catalyst shifts the <strong>for</strong>med carbon monoxide to carbon dioxide and hydrogen by reactionwith water:CO + H 2 O ↔ CO 2 + H 2The <strong>for</strong>med hydrogen is then consumed by hydrogenation of the <strong>for</strong>med ethene:CH 2 =CH 2 + H 2 CH 3 -CH 3This means that the ethane production <strong>from</strong> acrolein (and the total pathway <strong>from</strong> <strong>glycerol</strong>)does not require any external hydrogen supply. The gas mixture with ethane, carbon dioxide,water and a small amount of propanoic acid should be rather simple to separate. This meansthat the <strong>Bio</strong>fuel #1011 catalyst not only decarbonylates, it also has water-gas shift functionality.2.1.10 Glycerol to EthaneIn this experiment the complete route <strong>from</strong> <strong>glycerol</strong> to ethane was demonstrated using severalreactors. Reactor 1 contained 30 g of Z-1152 dehydration catalyst and reactor 2 contained 14g<strong>Bio</strong>fuel #1011. The feed consisted of 18 g/h of 20 w% <strong>glycerol</strong> in water and 50 ml/min of N 2was used as a carrier gas. The inlet temperature of reactor 1 was 270°C and <strong>for</strong> reactor 2 the12
inlet temperature was 230°C, the total pressure was 5 bar(a). In figure 15, the result <strong>from</strong> a20 h run is shown.Figure 15 Conversion of <strong>glycerol</strong> to ethane without hydrogen, normalized carbon balance.In figure 15 it can be seen that at least two parallel reaction paths takes place. The first one isthe expected:Glycerol → Acrolein → Ethane + CO 2The second one produces carbon monoxide <strong>from</strong> either <strong>glycerol</strong> or acrolein, <strong>for</strong> instance:<strong>glycerol</strong> → 3 COHowever, during the first 6 hours this carbon monoxide is oxidized into carbon dioxide, maybeduring reduction of the catalyst. After 6 hours the amount of carbon dioxide starts to falldown to the same yield as the ethane, indicating an equimolar reaction (one mole acrolein<strong>for</strong>ms one mole ethane and one mole carbon dioxide). While the carbon dioxide starts to decrease,carbon monoxide appears and displays a mirror image. This indicates that the carbonmonoxide is <strong>for</strong>med <strong>from</strong> a side reaction, competing with the main reaction.2.2 Conclusions of Experimental WorkIt have been shown that <strong>glycerol</strong> in water solutions (10-20 w%) can be converted to variousgas phase components. Intermediate steps, as well as total integrated processes have beendemonstrated in the per<strong>for</strong>med experiments <strong>for</strong> both the production of propane and ethane.Conversions to useful products in the range of 55% and above have been achieved in the laboratoryscale, without any particular ef<strong>for</strong>ts to optimizing the processes. It is expected thatthere can be significant improvements in the yield by optimization of catalyst compositions,operating conditions etc.The durability of the catalytic processes has also been demonstrated in medium term runs(10-60 h). This means there is a substantial chance to success with a pilot unit, even thoughthere is a need <strong>for</strong> <strong>addition</strong>al catalyst and process optimization as well as catalyst life timeinvestigations.Production of propene or propane can be done in three and four steps respectively with supplyof external hydrogen. However, ethane and ethene can be produced in two steps without anysupply of hydrogen, a simpler and more cost effective pathway <strong>for</strong> <strong>glycerol</strong> utilization thanthe propane path.13
3 Cost EstimateThe production volumes of biodiesel has increased the production of bio-<strong>glycerol</strong>, as the relationbetween produced diesel and by-product <strong>glycerol</strong> is 10:1 on a mass basis. During 2007,the production of biodiesel in the EU 27 was 5 713 000 ton (20). The majority of this productionwas done in Germany (2 890 000 ton), France (872 000 ton) and Italy (363 000 ton). TheSwedish production in the same year was 63 000 ton. The capacity in Europe in 2008 (calculatedbased on 330 working days per year and plant) is 16 000 000 ton of maximum biodieselproduction. This indicates that during 2007, 571 300 ton of <strong>glycerol</strong> was produced. During thesame time frame (2006) the <strong>biogas</strong> production was 1.3 TWh and at present there are 227 productionfacilities in Sweden, of which 34 facilities upgrade the <strong>biogas</strong> to transport fuel quality(21). Out of the 1.3 TWh produced some 0.23 TWh was upgraded and used <strong>for</strong> transportationpurposes in 2006 (2).In the economic evaluation, three alternatives have been compared. The alternatives are:1. <strong>Propane</strong> production <strong>from</strong> <strong>glycerol</strong> with internal hydrogen supply.2. <strong>Propane</strong> production <strong>from</strong> <strong>glycerol</strong> with external hydrogen supply.3. Ethane production <strong>from</strong> <strong>glycerol</strong>.Each of these units has been sized to match a <strong>biogas</strong> production capacity of 24 GWh <strong>biogas</strong>/year,comparable to the <strong>biogas</strong> facility in Vrams Gunnarstorp. The reaction set-ups arestill preliminary and only to be viewed as a basis <strong>for</strong> the economic evaluation. However, initialcalculations have shown that the heat balance closes, to some extent, in most cases dependingon the possible inlet <strong>glycerol</strong> mixture concentration.3.1 Unit ConfigurationsIn the first process suggestion the hydrogen to support the hydrogenation of the double bonds,the result of the dehydration, is produced by steam re<strong>for</strong>ming of <strong>glycerol</strong>. The hydrogen isrecycled to improve the overall hydrogen balance using an internal PSA (pressure swing adsorption)technology, figure 16. Glycerol and water are pumped <strong>from</strong> two vessels and mixed.The mixed stream is sent to the <strong>glycerol</strong> conversion process (stream 6), where it is mixed withhydrogen (stream 14), and to the hydrogen generation process (stream 15). The mixture of<strong>glycerol</strong>/water and hydrogen is vaporized and passed through a first dehydration/hydrogenationstep. The temperature is then adjusted and the gases are past through asecond dehydration/hydrogenation reactor where the product propane is produced. The gasesare condensed, heating the feed, and is mixed with the product <strong>from</strong> the hydrogen production.The gases are separated in the PSA, where the product propane and a small amount of CO 2and hydrogen are rejected as PSA off-gas (stream 23). The hydrogen content of the off-gas isburnt selectively using a catalyst and air (stream 24) and the heat is used to preheat the steamre<strong>for</strong>mer feed. The resulting mixture of CO 2 and propane is sent into the <strong>biogas</strong> plant(stream 27), where the CO 2 is removed with the CO 2 produced in the <strong>biogas</strong> fermentation.14
8 7 6 5 4 3 2 1H21HGlycerolG15543WaterG6F14F79 10 11 12 13PSAEDehydration/HydrogenationDehydration/HydrogenationE82722D17 1819 20 21DSteam Re<strong>for</strong>mingWater-Gas Shift1623C2625CV-5PSA Offgas Hydrogen CombustionB24BDRAWNNAMECHDATE2008-07-29<strong>Bio</strong>fuel-Solution ABACHECKEDTHIS DOCUMENT CONTAINS PROPRIETARY ENG. APPRINFORMATION OF BIOFUEL-SOLUTION I MALMÖAB AND IS SUBJECT TO BEING RETURNED Q.A.UPON REQUEST. IT SHALL NOT BEREPRODUCED IN WHOLE OR IN PART WITHOUTPRIOR WRITTEN PERMISSION OF BIOFUEL- MFG. APPRSOLUTION I MALMÖ AB ANY AUTHORIZEDREPRODUCTIONS MUST BEAR THIS ENTIRELEGEND.COMMENTS:Process Flow Diagram<strong>Propane</strong> With Internal Hydrogen ProductionFILENAMESIZEFSCM NOBVISIODOCUMENTSCALE NONE SHEET 1OF1A8 7 6 5 4 3 2 1Figure 16 The Process Flow Diagram of the propane process with internal hydrogen production.To avoid the cost of the hydrogen generation, an alternative set-up with external hydrogensupply has been considered, figure 17. In this case, the hydrogen production via steam re<strong>for</strong>minghas been replaced by an external hydrogen supply (stream 13). The basic process remainsthe same as in the first case, with internal hydrogen recycle and clean-up.15
8 7 6 5 4 3 2 1H21HGlycerolG43G5Water14 13FF8 9 1061112PSAH2 Gas CylinderEDehydration/HydrogenationDehydration/HydrogenationE715DD1718 19PSA Hydrogen CombustionC16CBBDRAWNNAMECHDATE2008-07-29<strong>Bio</strong>fuel-Solution ABACHECKEDTHIS DOCUMENT CONTAINS PROPRIETARY ENG. APPRINFORMATION OF BIOFUEL-SOLUTION I MALMÖAB AND IS SUBJECT TO BEING RETURNED Q.A.UPON REQUEST. IT SHALL NOT BEREPRODUCED IN WHOLE OR IN PART WITHOUTPRIOR WRITTEN PERMISSION OF BIOFUEL- MFG. APPRSOLUTION I MALMÖ AB ANY AUTHORIZEDREPRODUCTIONS MUST BEAR THIS ENTIRELEGEND.COMMENTS:Process Flow Diagram<strong>Propane</strong> With External Hydrogen SupplySIZEFSCM NO FILENAMEBVISIODOCUMENTSCALE NONE SHEET 1OF1A8 7 6 5 4 3 2 1Figure 17 The Process Flow Diagram of the propane process with external hydrogen supply.In the third case considered, the final product is ethane, figure 18. The <strong>glycerol</strong> (stream 1) ismixed with water (stream 3) and is vaporized and heated. The mixture is passed through areactor and the resulting product, ethane and CO 2 (stream 8), is sent to the <strong>biogas</strong> process gasupgrading <strong>for</strong> CO 2 removal. The process is simpler than the ones suggested above, but a largeramount (40% excess) is needed to get the correct Wobbe-index of the <strong>biogas</strong>.16
8 7 6 5 4 3 2 1HHGG21FGlycerolF43E5WaterE8D6D7Combined ReactorCCBBDRAWNNAMECHDATE2008-07-29<strong>Bio</strong>fuel-Solution ABATHIS DOCUMENT CONTAINS PROPRIETARY ENG. APPRINFORMATION OF BIOFUEL-SOLUTION I MALMÖAB AND IS SUBJECT TO BEING RETURNED Q.A.UPON REQUEST. IT SHALL NOT BEREPRODUCED IN WHOLE OR IN PART WITHOUTPRIOR WRITTEN PERMISSION OF BIOFUEL- MFG. APPRSOLUTION I MALMÖ AB ANY AUTHORIZEDREPRODUCTIONS MUST BEAR THIS ENTIRELEGEND.COMMENTS:Process Flow DiagramEthane ProductionSIZEFSCM NO FILENAMEBVISIODOCUMENTSCALE NONE SHEET 1OF18 7 6 5 4 3 2 1CHECKEDAFigure 18 The Process Flow Diagram of the ethane production process.3.2 Production Cost EstimatesTo give a first approximation on the cost of production with the three different alternatives,the production costs have been estimated. In all cases the operating costs has been taken intoaccount. The largest expense is the bio-<strong>glycerol</strong> used as feedstock, but also cost of electricityand water has been taken into account. The parameters of the three processes used in the costestimates are summarized in table 1.Table 1 Parameters used <strong>for</strong> the production cost estimates.<strong>Propane</strong> Internal H 2 <strong>Propane</strong> External H 2 Ethane ProductionGlycerol (kr/kg) 0.9 0.9 0.9Water (kr/ton) 20 20 20Hydrogen (kr/kg) 0 33 0Electricity 10% of <strong>glycerol</strong> cost 10% of <strong>glycerol</strong> cost 10% of <strong>glycerol</strong> costInvestment cost 2 100 000 1 500 000 900 000Interest rate 7% 7% 7%Depreciation time 5 years 5 years 5 yearsTime On-Line 8 000 8 000 8 000Process efficiency 60% 60% 70%The cost of the feedstock has been derived using actual crude <strong>glycerol</strong> costs, with a cost penalty<strong>for</strong> the actual clean-up of the <strong>glycerol</strong>. The investment cost has been decided by estimateson the type of equipment needed and the complexity of each system. The process efficienciesare based on the experimental investigation but the estimate should be consideredpreliminary, due to the exploratory nature and limited time and scope of the study.17
Using the parameters in table 1 the production cost per kWh is 1.82 kr in the case of externalhydrogen supply, 1.6 kr/kWh in the case of internal hydrogen production and 0.78 kr/kWh inthe ethane case. The production cost of the two first cases doesn’t differ very much, but in thecase of ethane the production cost is significantly lower.However, if the annual cost of adding propane to a 24 GWh <strong>biogas</strong> plant is taken into account,the costs are more level. In the case of internal hydrogen supply, the annual cost would be~787 000 kr. Which should be compared to ~895 000 kr <strong>for</strong> the externally supplied hydrogenprocess and ~534 000 kr <strong>for</strong> the ethane process. The reason <strong>for</strong> the relatively high annual cost<strong>for</strong> the ethane process (compared to the differences in kWh cost) is due to the higher ethanerequired compared to propane (40% surplus). A cost breakdown <strong>for</strong> the base case can beviewed in table 2.Table 2 Result of the base case cost estimates.<strong>Propane</strong> Intern. H 2 <strong>Propane</strong> Ext. H 2 Ethane ProductionGlycerol (kg/h) 32 21 36Water (kg/h) 126 83 144Hydrogen (kg/h) N/A 1.3 N/AOperating CostGlycerol (kr/y) 231 570 152 924 265 137Electricity (kr/y) 23 157 15 292 26 514Water (kr/y) 20 165 13 316 23 088H 2 (kr/y) N/A 347 347 N/ATotal (kr/y) 274 892 528 879 314 739Equipment cost (kr/y) 512 170 365 836 219 502Annual cost (kr/y) 787 063 894 715 534 240kWh Cost (kr/kWh) 1.60 1.82 0.78Using the base cases to investigate the supply of the feedstock, approximately 10 times theamounts processed in this fictive plant, is required <strong>for</strong> all the upgraded <strong>biogas</strong> in Sweden.This indicates that 2 560 tpa, 1 680 tpa and 2 880 tpa of <strong>glycerol</strong> (<strong>for</strong> the propane Int. H 2 , the<strong>Propane</strong> Ext. H 2 and the Ethane case respectively) would be enough to supply the Swedishupgraded <strong>biogas</strong> production with higher alkanes. This indicates that the <strong>glycerol</strong> produced asa by-product <strong>from</strong> the biodiesel industry would be feasible as feedstock <strong>for</strong> this application.To investigate how the production cost varies with the feedstock cost, a Monte Carlo simulationwas per<strong>for</strong>med. The feedstock was set at a lowest available value of 0.6 kr/kg, a maximumvalue of 2.4 kr/kg and a most likely value of 1.2 kr/kg. Within this range 10 000 valueswere generated using a normal distribution based on the minimum, maximum and most likelyvalue; a triangulation simulation. In figure 19 the distribution of production costs are shown.18
Figure 20The distribution of the cost of production (kr/kWh) <strong>for</strong> the three different cases.It is obvious that the cost of the feedstockdoes influence the cost of production; the costs vary<strong>from</strong> 1.43 to 2.40 kr/kWh in the propane case with internal hydrogen generation, 1.711 to 2.35in the external hydrogen case and 0.64 to1.43 in the ethane case. It is however apparent thatthe ethane configuration will give a lower cost independent of feedstock cost with a 50% per-of thecentile of 0.92 kr/kWh (50% of the 10 000 cases are below 0.92 kr/kWh) ). In the caseannual cases, the difference is somewhat narrowerr and the ethane case is less favorable athigher <strong>glycerol</strong> feedstock costdue to the higher consumption, figure 21.Figure 21The annual production costs in kkr at different feedstock costs.When annual cost is investigated, the unit using the least <strong>glycerol</strong> feedstock (the propane withexternalsupply) is the one with the smallest standard deviationof the three units, ~60000 kr.In the case of the propane withinternal generation the standard deviation is ~90 000 kr and in19
the ethane case 104000 kr. The ethane case is hence the most sensitive process to feedstockcost variations but the simulation show that it is alsothe lowestcost option, 50% of the simuwasper-lations are below ~650 000 kr in annual cost.To investigate the effect of the depreciation time, a similar Monte Carlo Simulation<strong>for</strong>med.Using the base case parameters <strong>from</strong> table 1 with theexception of the depreciationtime which was setto a minimum of 3 years, a mostlikely 5 years and maximum of 10 yearsand 10 000 values were generated using triangulation, figure 22.Figure 222 The annual cost distribution of the three processes incurred by a variation of thedepreciationtime.The variation of the depreciation time will in general have a big influencee on a process withlow operation costs and high capital costs. In this case this is true <strong>for</strong> the two processes prostandardducing propane, where the investment cost is higherthan <strong>for</strong> the ethane process. Thedeviation of the ethane process is ~42 000 kr, to be compared to~69 000 kr (external H 2 ) and~97 0000 kr (internal H 2 ).Anotherparameterr influencingthe production and annual costss is the investment cost. To in-using ±30% of the estimate asminimum and maximum values and the original estimate as thevestigate the impact of the investment cost, the estimated investment costss where triangulatedmost likely value. The other parameters used the settings of the base case, Figure 23.20
Figure 23The effect of variations ininvestment cost.As can be seen <strong>from</strong> figure 23 there are no major effects of the investment cost variation inthe ethane case. The standard deviation is0.04 kr/kWh, but in the propane cases the variationsare higher. In the propane production case with internal H 2 production thestandard deviationis 0.12 kr/kWh andin the external H 2 case it is 0.08kr/kWh. To get an understanding of theoverall variance ofthe processes, all of the parameters varied individually above have beenvaried simultaneously betweenthe same levels as be<strong>for</strong>e, figure24.Figure 24The variations in kWh cost when varying multiple parameters simultaneously.The variation in production cost per kWhis small <strong>for</strong> the ethane process compared to the oth-belower processes. The mean value is 0.94 kr/kWh and 65% of the 10 00 00 cases are1 kr/kWh. For the other two processes the corresponding numbers are 1.78 kr/kWh (internalH 2 ) and1.94 kr/kWh (external H 2 ) mean values and 65% of the10 000 simulations are below21
1.89 kr/ /kWh (internal H 2 ) and2.01kr/kWh (externalH 2 ). Again, the ethane production cost issubstantially lowerthan the other two alternatives. If the annual cost is considered, there arelarger variations, figure 25.Figure 25The variations in annual cost when varying multiple parameters simultaneously.Especially the ethane processs display larger variations than the other processes. The meanannual cost of the ethane process is ~647000 kr, to be compared to ~876 000 kr (internal H 2 )and ~952 000 kr (external H 2 ). The ranges however varies <strong>from</strong>364 kkr to 1 030 kkr (ethane),483 kkrto 1 453 kkr (internal H 2 ) and 675kkr to 1 342 kr (external H 2 ).However, if the cost per kWh is compared to that of fossil propane (LPG), there are some costadvantages to the fossil fuel. The US Midcontinent spot-price average over the last year (July07 to July 08) was 149.5 cents/gallon, to be compared to the Mont Belvieuspot-price averageover thesame timeperiod 151.6 cents/gallon (22). With these spot prices and a dollar rate of7 kr/USD the kWhcost is 0.42-0.43 kr/kWh, whichh is lower than that ofthe produced prois187.6pane bya factor of 3 to 5. However, the actual spot price inthe time of writingcents/gallon, corresponding to0.54 kr/kWh (23). This cost is not that far of the cost per kWhof the ethane production process (mean of 0.94 kr/kWh in the Monte Carlosimulationvaryingall parameters), which is promising. Compared to <strong>biogas</strong> produced by fermentationand up-pos-graded, costing between 0.64 to 0.74 kr/kWh in largescale (24), the ethanee process couldsibly becompetitive in a low to medium feedstock-cost situation.In Sweden the LPGis traded at 0.43 kr/kWh at the time of writing (25), to that pricethere isan <strong>addition</strong>al cost <strong>for</strong> transport and taxes. At the moment the CO 2 tax is 0.24 kr/kWhand theenergy tax is 0.01 kr/kWh in the LPG case. With this taken into account, the cost ofLPG inthe Swedish context would be0.68 kr/kWh. As the<strong>glycerol</strong> can be considered a renewablefuel, it is exempt of taxation. This exemption will make the suggested technology even moreattractive <strong>from</strong> a cost angle. In the case of the Swedish market, <strong>glycerol</strong> can be usedto pro-production, the cost differencee is even smaller due tothe green certificate duce anLPG alternative with a small cost premium.If this is combined with green electricityrevenue.22
4 ConclusionsThe aim of this study was to confirm the technical feasibility of producing bio-propane <strong>from</strong> arenewable <strong>glycerol</strong> feedstock. In the experimental work, it has been shown that production ofpropane with 55-60% yield <strong>from</strong> <strong>glycerol</strong> and ethane with 65-75% yield is possible. It shouldhowever be noted that the experiments have been per<strong>for</strong>med without extensive optimization;it is there<strong>for</strong>e expected that there are possibilities of improvements in the yields of both productsby optimizing the catalyst compositions and process conditions.From a technical aspect, both end-products considered are feasible to produce. There arehowever <strong>addition</strong>al benefits to producing ethane <strong>from</strong> a simplicity standpoint. This routewould omit the need <strong>for</strong> external or internal hydrogen supply. There is also a possibility tomake the process run auto-thermally, by managing to increase the inlet <strong>glycerol</strong> concentration<strong>from</strong> 20% to 30% in water. Due to the simplicity and promise of higher yields in the ethaneprocess, it is believed that the <strong>glycerol</strong> consumption can be approximately the same producingethane and propane. Even though the produced, end-product kWh is higher in the ethane case.From an economical standpoint, the production of ethane is more favorable than the productionof propane, albeit just as feasible. The production cost of the ethane produced is in thesame order of magnitude as the fossil propane used in the <strong>biogas</strong> industry today. Using ethaneas a component in LPG will however be limited by the allowed maximum of 2% ethane. Thislimitation can however be disregarded at the moment, as the 2% is still a very large market inSweden and abroad.The supply side of the <strong>glycerol</strong> does not seem to be a limiting factor at the moment. The productionof upgraded <strong>biogas</strong> in Sweden today will require about 20% of the byproduct <strong>glycerol</strong>produced by Perstorp bio-chemicals in Stenungsund. This indicates that the purpose of using<strong>glycerol</strong> <strong>for</strong> supplying <strong>addition</strong>al heating value to upgraded <strong>biogas</strong> is feasible not only today,but <strong>for</strong> a <strong>for</strong>eseeable future. However, the economic feasibility is limited by the feedstockcost. There<strong>for</strong>e it would be suitable to use a lower grade, crude <strong>glycerol</strong>, than the one generatedin Stenungsund. Another advantage of using <strong>glycerol</strong> is that a non-poisonous, non-volatileliquid could be transported and converted on-site, instead of the liquefied gas used today.23
5 References1. Energiläget 2007. u.o. : Statens energimyndighet, 2007. 1403-1892.2. Energiläget i siffror 2007. u.o. : Statens energimyndighet, 2007.3. Kristensson, I., Pettersson,A., Johansson, K. <strong>Bio</strong>gas på gasnätet utan propantilsats.Malmö : Svensk Gastekniskt Center AB, 2007. <strong>SGC</strong> rapport 176 1102-7371.4. ICIS. Glycerol Prise Development. 2002-2007.5. Lynd, L R, Wyman, C E och Gerngross, T U. <strong>Bio</strong>technology Progress. 1999, Vol. 15, s. 777.6. Dale, B E. J. of Chem. Technl. <strong>Bio</strong>technol. 2003, Vol. 15, s. 1093.7. Kamm, B och Kamm, M. Appl. Microbiol. <strong>Bio</strong>technol. 2004, Vol. 64, s. 137.8. Raguskas, A J, o.a. Science. 2006, Vol. 311, s. 484.9. Miller, D J. NFS workshop report on Catalysis <strong>for</strong> <strong>Bio</strong>renewables Conversion. u.o. : NFS, 2004.10. Werpy, T och Petersen, G. Top value added chemicals <strong>from</strong> biomass vol. 1, results <strong>from</strong>screening <strong>for</strong> potential candidates <strong>from</strong> sugars and synthesis gas. u.o. : US DoE, 2004.11. Chiu, C. Ind. Eng. Chem. Res. 2006, Vol. 45, s. 266.12. Altaf, M, o.a. J. Apl. Microbiol. 2007, Vol. early article on-line.13. Sim, P H. Chem. Week. . 1, 2004, Vol. 24.14. Kirschner, M. Chem. Market Reporter. 1, 2004, Vol. 35.15. Booth, I. Escherichia coli and Salmonella: cellular and molecular biology (web edition) . 2005.16. Shuller, H J. Current Genetics. 2003, Vol. 43.17. Bouvet, O M, o.a. Res. Microbiol. 1995, Vol. 146.18. Yazdani, S S och Gonzalez, R. Current Opinion in <strong>Bio</strong>technology. 2007, Vol. 18.19. DVGW Technische Regel, Arbeitsblatt G 262. u.o. : DVGW, 2004.20. European <strong>Bio</strong>diesel Board. http://www.ebb-eu.org/stats.php. [Online] den 28 07 2008.21. Bigas ur gödsel, avfall och restprodukter - goda svenska exempel. u.o. : Svenska gasföreningen,208.22. Energy In<strong>for</strong>mation Administration. http://tonto.eia.doe.gov/oog/info/hopu/hopu.asp. [Online]den 29 07 2008.23. http://tonto.eia.doe.gov/oog/info/twip/twip.asp. [Online]24. Benjaminsson, J. Linné, M. <strong>Bio</strong>gasanläggningar med 300 GWh årsproduktion - system,teknik och ekonomi. u.o. : Svenskt Gastekniskt Center, 2007. <strong>Rapport</strong> <strong>SGC</strong> 178 1102-7371ISRN <strong>SGC</strong>-R-178-SE.25. Svenska Gasföreningen, Personal Communication, Erik Wasell, 2008-10-14.24
Scheelegatan 3, 212 28 Malmö ● Tel 040-680 07 60 ● Fax 040-680 07 69www.sgc.se ● info@sgc.se