Rapport SGC 198 Bio-Propane from glycerol for biogas addition
Rapport SGC 198 Bio-Propane from glycerol for biogas addition
Rapport SGC 198 Bio-Propane from glycerol for biogas addition
- No tags were found...

Create successful ePaper yourself
Turn your PDF publications into a flip-book with our unique Google optimized e-Paper software.
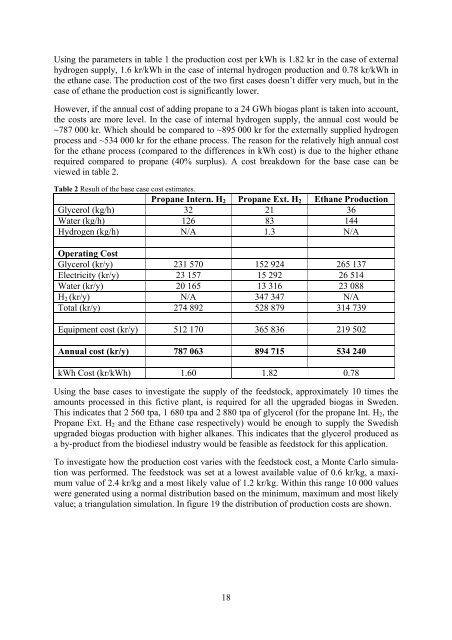
Using the parameters in table 1 the production cost per kWh is 1.82 kr in the case of externalhydrogen supply, 1.6 kr/kWh in the case of internal hydrogen production and 0.78 kr/kWh inthe ethane case. The production cost of the two first cases doesn’t differ very much, but in thecase of ethane the production cost is significantly lower.However, if the annual cost of adding propane to a 24 GWh <strong>biogas</strong> plant is taken into account,the costs are more level. In the case of internal hydrogen supply, the annual cost would be~787 000 kr. Which should be compared to ~895 000 kr <strong>for</strong> the externally supplied hydrogenprocess and ~534 000 kr <strong>for</strong> the ethane process. The reason <strong>for</strong> the relatively high annual cost<strong>for</strong> the ethane process (compared to the differences in kWh cost) is due to the higher ethanerequired compared to propane (40% surplus). A cost breakdown <strong>for</strong> the base case can beviewed in table 2.Table 2 Result of the base case cost estimates.<strong>Propane</strong> Intern. H 2 <strong>Propane</strong> Ext. H 2 Ethane ProductionGlycerol (kg/h) 32 21 36Water (kg/h) 126 83 144Hydrogen (kg/h) N/A 1.3 N/AOperating CostGlycerol (kr/y) 231 570 152 924 265 137Electricity (kr/y) 23 157 15 292 26 514Water (kr/y) 20 165 13 316 23 088H 2 (kr/y) N/A 347 347 N/ATotal (kr/y) 274 892 528 879 314 739Equipment cost (kr/y) 512 170 365 836 219 502Annual cost (kr/y) 787 063 894 715 534 240kWh Cost (kr/kWh) 1.60 1.82 0.78Using the base cases to investigate the supply of the feedstock, approximately 10 times theamounts processed in this fictive plant, is required <strong>for</strong> all the upgraded <strong>biogas</strong> in Sweden.This indicates that 2 560 tpa, 1 680 tpa and 2 880 tpa of <strong>glycerol</strong> (<strong>for</strong> the propane Int. H 2 , the<strong>Propane</strong> Ext. H 2 and the Ethane case respectively) would be enough to supply the Swedishupgraded <strong>biogas</strong> production with higher alkanes. This indicates that the <strong>glycerol</strong> produced asa by-product <strong>from</strong> the biodiesel industry would be feasible as feedstock <strong>for</strong> this application.To investigate how the production cost varies with the feedstock cost, a Monte Carlo simulationwas per<strong>for</strong>med. The feedstock was set at a lowest available value of 0.6 kr/kg, a maximumvalue of 2.4 kr/kg and a most likely value of 1.2 kr/kg. Within this range 10 000 valueswere generated using a normal distribution based on the minimum, maximum and most likelyvalue; a triangulation simulation. In figure 19 the distribution of production costs are shown.18