Adding gas from biomass to the gas grid - SGC
Adding gas from biomass to the gas grid - SGC
Adding gas from biomass to the gas grid - SGC
- No tags were found...

You also want an ePaper? Increase the reach of your titles
YUMPU automatically turns print PDFs into web optimized ePapers that Google loves.
Report <strong>SGC</strong> 118<strong>Adding</strong> <strong>gas</strong> <strong>from</strong> <strong>biomass</strong> <strong>to</strong> <strong>the</strong><strong>gas</strong> <strong>grid</strong>©Swedish Gas Center - July 2001GASTEC NVMartin HagenErik PolmanDanish Gas Technology Center a/sJan K JensenAsger MykenSwedish Gas CenterOwe JönssonAnders DahlReport <strong>SGC</strong> 118 ISSN 1102-7371 ISRN <strong>SGC</strong>-R-118-SE
FOREWORDRD&D-projects performed by <strong>the</strong> Swedish Gas Center, are usuallypresented in reports, available <strong>to</strong> each and everyone who wants <strong>to</strong> share <strong>the</strong>results of a project.<strong>SGC</strong> prints and publishes <strong>the</strong> reports but <strong>the</strong> authors of each report areresponsible for <strong>the</strong> accuracy of <strong>the</strong> content. Everyone making use of anydescription, results etc, will do this on his own responsibility. Excerpts <strong>from</strong>a report may be used if <strong>the</strong> source is indicatedSwedish Gas Centre (<strong>SGC</strong>) is a joint venture of energy <strong>gas</strong> businessorganisations. <strong>SGC</strong>’s primary mission is <strong>to</strong> co-ordinate <strong>the</strong> joint Research,Development and Demonstration (RD&D) efforts that are performed within<strong>the</strong> Swedish <strong>gas</strong> industry. The shareholders of <strong>SGC</strong> are: The Swedish GasAssociation, Syd<strong>gas</strong> AB, Sydkraft AB, Go<strong>the</strong>nburg Energy, Lund Energyand Helsingborg Energy.This project has been funded by:The European CommissionThe Swedish National Energy AdministrationGastec N.V., HollandDanish Gas Technology Center, DenmarkNSR, SwedenSyd<strong>gas</strong>Vattenfall Natur<strong>gas</strong> ABGöteborg Energi ABBirka Energi ABÖresundskraft ABRVF - The Swedish Association of Waste ManagementLunds Energi ABSYSAV ABSWEDISH GAS CENTREJohan RietzPresident
CONTENTS1 INTRODUCTION 32 IMPORTANCE OF ADDING GAS FROM BIOMASS TO THE GAS GRID 42.1 Biomass for energy 42.2 Utilisation of energy <strong>from</strong> <strong>biomass</strong> 72.3 Economical aspects 133 PRODUCING GAS FROM BIOMASS 153.1 Bio<strong>gas</strong> <strong>from</strong> anaerobic digestion 153.2 Syn<strong>gas</strong> <strong>from</strong> <strong>biomass</strong> pyrolysis and <strong>gas</strong>ification 204 PIPELINE QUALITY GAS FROM BIOGAS 264.1 Introduction 264.2 Cleaning 274.3 Upgrading 334.4 Addition of propane 464.5 Adaption <strong>to</strong> non natural <strong>gas</strong> <strong>grid</strong>s 474.6 Odorisation 485 PIPELINE QUALITY GAS FROM SYNGAS 495.1 Process layout 495.2 Cleaning 515.3 Conversion and upgrading 525.4 Process integration 546 SUPPLYING GAS FROM BIOMASS TO THE GAS GRID 566.1 Gas quality aspects 566.2 Legislation 606.3 Control and measurement 716.4 Prospects 767 INTERNATIONAL PERSPECTIVE 797.1 Availability of <strong>biomass</strong> 797.2 Examples of pipeline quality <strong>gas</strong> <strong>from</strong> <strong>biomass</strong> by country 917.3 Policy 958 CONCLUSIONS AND RECOMMENDATIONS 1169 REFERENCES 117Appendix 1: Abbreviations, terminology and units 122Appendix 2: Thermal <strong>gas</strong> production processes 123Pagepage: 2
1 INTRODUCTIONNowadays <strong>the</strong>re are only a few <strong>biomass</strong> <strong>gas</strong>ification plants operative worldwide delivering <strong>gas</strong> <strong>to</strong><strong>the</strong> <strong>grid</strong>. One of <strong>the</strong> main reasons for this is that <strong>gas</strong> <strong>from</strong> <strong>biomass</strong> is hardly competitive with natural<strong>gas</strong> or o<strong>the</strong>r sources of energy. Useful application of <strong>the</strong> produced heat is in most cases restricted<strong>to</strong> local utilisation, since large distance transport of heat is economically unattractive.A way <strong>to</strong> improve <strong>the</strong> economics is <strong>to</strong> use bio<strong>gas</strong> via <strong>the</strong> <strong>gas</strong> <strong>grid</strong> at locations where all bio<strong>gas</strong> canbe used efficiently at any time. This use may involve for example <strong>the</strong> conversion <strong>to</strong> heat orelectricity, or use as a vehicle fuel. One way <strong>to</strong> accomplish this is adding <strong>the</strong> bio<strong>gas</strong> <strong>to</strong> <strong>the</strong> natural<strong>gas</strong> <strong>grid</strong>. The o<strong>the</strong>r way is <strong>to</strong> utilise a dedicated <strong>gas</strong> distribution <strong>grid</strong> with end-user applications fit for<strong>the</strong> local <strong>gas</strong> quality.The aim of this project carried out in <strong>the</strong> framework of <strong>the</strong> Altener programme is <strong>to</strong> provide anoverview of technologies for cleaning and upgrading of bio<strong>gas</strong> for remote use. A fur<strong>the</strong>r aim is <strong>to</strong>determine <strong>to</strong> what extent <strong>gas</strong>es produced <strong>from</strong> <strong>biomass</strong> (digestion or <strong>gas</strong>ification) can be added <strong>to</strong><strong>the</strong> <strong>gas</strong> <strong>grid</strong> and what additional safety regulations are necessary. Finally, existing Europeanstandards and national legislation have been studied in order <strong>to</strong> determine <strong>the</strong> possibility ofconflicting and/or missing regulations with <strong>the</strong> intended approach. The information collected in thisproject can be used <strong>to</strong> select promising technologies and may serve as background information fordeveloping harmonised standards.This report describes <strong>the</strong> various production and cleaning techniques and <strong>the</strong> present requirementsfor <strong>the</strong> use of bio<strong>gas</strong>.The technology for adding <strong>gas</strong> <strong>from</strong> <strong>biomass</strong> <strong>to</strong> <strong>the</strong> <strong>gas</strong> <strong>grid</strong> on a larger scale can contribute <strong>to</strong> ahigher share of <strong>biomass</strong> in <strong>the</strong> energy supply and will also allow a highly efficient use of <strong>the</strong> energycontained in <strong>the</strong> <strong>biomass</strong>. Moderate tax incentives will make <strong>the</strong> use of <strong>gas</strong> <strong>from</strong> <strong>biomass</strong>economically attractive for large groups of end-users.This project was financed by:• European Commision in <strong>the</strong> Alterner program and in:• <strong>the</strong> Ne<strong>the</strong>rlands by: EnergieNed and NOVEM,• Denmark by: DONG, Hoverstadsregion Natur<strong>gas</strong> I/S, Natur<strong>gas</strong> Sjælland I/S, Natur<strong>gas</strong> Fyn I/S,Natur<strong>gas</strong> Midt-Nord I/S, Københavns Energi, The Danisch Energy Agency and• Sweden by: funds provided by <strong>the</strong> Swedish natural <strong>gas</strong> distribution companies and <strong>the</strong> SwedishEnergy Authority.Erik Polman (Gastec) provided <strong>the</strong> project management. The production of <strong>the</strong> final report wasprovided by Marijke Jansen en Rosalien Kiestra.page: 3
2 IMPORTANCE OF ADDING GAS FROM BIOMASS TO THE GAS GRID2.1 BIOMASS FOR ENERGYBiomass is one of <strong>the</strong> most important sources of renewable energy. The European Commissiondepicts in its 1997 White Paper ‘Energy for <strong>the</strong> Future: renewable sources of energy’ [lit.1] astrategy and action plan for <strong>the</strong> enhanced use of renewable energy sources. Table 1 summarisessome data <strong>from</strong> this White Paper. This paper distinguishes two energy products <strong>from</strong> <strong>biomass</strong>: heatand electricity. The paper assumes that all heat released <strong>from</strong> <strong>biomass</strong> is generated with anefficiency of 100%. The efficiency for <strong>the</strong> production of electricity is assumed <strong>to</strong> increase <strong>from</strong> 29%in 1995 <strong>to</strong> 33% in 2010. The heat generated in <strong>the</strong> production of electricity is not considered <strong>to</strong> beused. In practice a large part of <strong>the</strong> heat will find a useful application.Aspect 1995 2010Total utilised renewable energy sources PJ 3100 7600<strong>biomass</strong> for energy PJ 1870 5650contribution of <strong>biomass</strong> in <strong>the</strong> <strong>to</strong>tal of renewable energy sources % 60 74heat <strong>from</strong> <strong>biomass</strong> PJ 1590 3140<strong>biomass</strong> for electricity production PJ 280 2510electricity <strong>from</strong> <strong>biomass</strong> PJ 83 830conversion efficiency % 29 33Table 1: EC’s White Paper data on <strong>the</strong> growth of utilisation of <strong>the</strong> energy <strong>from</strong> <strong>biomass</strong>Biomass is <strong>the</strong> most important contribu<strong>to</strong>r <strong>to</strong> <strong>the</strong> growth in renewable energy sources. Between1995 and 2010 3780 PJ 1 of <strong>biomass</strong> capacity will be installed. The cost effectivity for using energy<strong>from</strong> <strong>biomass</strong> equals that of hydro and wind power but is better compared <strong>to</strong> o<strong>the</strong>r sources ofrenewable energy as pho<strong>to</strong>voltaic or geo<strong>the</strong>rmal by a fac<strong>to</strong>r three <strong>to</strong> ten.Biomass for energy use can be found everywhere in nature. Biomass can also be generated forenergy use in <strong>the</strong> rehabilitation of regenerated lands, agroforestry, urban and community forestry.Energy plantations, when managed properly, can be successful, as already demonstrated in, forexample, Ethiopia and Brazil [lit.2]. Biomass is also a by-product in <strong>the</strong> production of food andtimber. These by-products, often more than 50% of <strong>the</strong> <strong>to</strong>tal input, constitute an important source ofsustainable energy.The technology of <strong>the</strong> conversion of <strong>biomass</strong> <strong>to</strong> energy can also be used <strong>to</strong> produce energy <strong>from</strong>o<strong>the</strong>r organic waste (manure, plastics, tires, industrial wastes). Conversion of <strong>the</strong>se organic wastesnot only contributes <strong>to</strong> <strong>the</strong> energy supply, but also reduces <strong>the</strong>ir adverse impact on <strong>the</strong> environment.The worldwide production of <strong>biomass</strong> on <strong>the</strong> land surface exceeds <strong>the</strong> energy consumption by afac<strong>to</strong>r 100 [lit.3]. Only a part of this <strong>biomass</strong> is, by its remote location and dispersed nature,available for energy production. Even <strong>from</strong> <strong>the</strong> <strong>biomass</strong> available for energy production currently1Recalculated <strong>from</strong> M<strong>to</strong>e: million <strong>to</strong>nnes of oil equivalent: 1 M<strong>to</strong>e = 42 PJ; 1 PJ = 10 15 Joulepage: 4
only a small part is utilised. In case of utilisation <strong>the</strong> efficiency, in which <strong>the</strong> energy in <strong>the</strong> <strong>biomass</strong> isconverted <strong>to</strong> useful energy, is below a readily achievable level. Notwithstanding this sub-optimalutilisation, <strong>biomass</strong> already in 1990 contributed <strong>to</strong> 13% of all primary energy [lit.4]. It is estimatedthat in 2050 nearly 40% of <strong>the</strong> direct fuel use and 17% of <strong>the</strong> power production will be provided <strong>from</strong><strong>biomass</strong>.Fuel <strong>gas</strong> <strong>from</strong> bio<strong>gas</strong>The concept of <strong>the</strong> production of distribution quality <strong>gas</strong> <strong>from</strong> <strong>biomass</strong> is not incorporated in <strong>the</strong>White Paper on renewable energy. This concept however can substantially improve <strong>the</strong> utilisation ofenergy <strong>from</strong> <strong>biomass</strong>. In this concept <strong>biomass</strong> is converted <strong>to</strong> a <strong>gas</strong> fit for supplication <strong>to</strong> a <strong>gas</strong> <strong>grid</strong>,<strong>the</strong> pipeline quality <strong>gas</strong>.Addition <strong>to</strong> <strong>the</strong> local low-pressure <strong>gas</strong> <strong>grid</strong> allows a highly efficient application of <strong>the</strong> energy in<strong>biomass</strong>. On <strong>the</strong> expense of compression and upgrading <strong>to</strong> transport <strong>grid</strong> pressure and qualitybio<strong>gas</strong> can be fed <strong>to</strong> <strong>the</strong> pan-European <strong>gas</strong> <strong>grid</strong> allowing a virtually unrestricted production ofenergy <strong>from</strong> <strong>biomass</strong>.This means that pipeline quality <strong>gas</strong> <strong>from</strong> <strong>biomass</strong> allows:Accommodation of virtually any production at any time at any place near <strong>the</strong> <strong>gas</strong> <strong>grid</strong>As long as a connection with a sufficient capacity <strong>to</strong> <strong>the</strong> natural <strong>gas</strong> <strong>grid</strong> exists, all pipeline quality<strong>gas</strong> can be accommodated. If <strong>the</strong> production is <strong>to</strong>o high for <strong>the</strong> actual local use, <strong>the</strong> <strong>gas</strong> istransported <strong>to</strong> users fur<strong>the</strong>r away.Highly efficient applicationExisting installed natural <strong>gas</strong> appliances will use <strong>the</strong> bio<strong>gas</strong>. This means that <strong>the</strong> already existingstandards for <strong>the</strong> efficient use of natural <strong>gas</strong> hold for all bio<strong>gas</strong> added <strong>to</strong> <strong>the</strong> <strong>grid</strong>.Security of supply for users of <strong>biomass</strong>If <strong>the</strong> production is <strong>to</strong>o low, local users will be supplied with natural <strong>gas</strong> <strong>from</strong> <strong>the</strong> <strong>grid</strong>. This allows foroptimal dimensioning and load for <strong>the</strong> conversion plant. Interruptions in <strong>the</strong> production, e.g. formaintenance or by a temporary lack of <strong>biomass</strong>, do not effect <strong>the</strong> users.Utilisation of <strong>biomass</strong> for heating, power production, combined heat and power production, coolingand refrigeration and as a transport fuelNatural <strong>gas</strong> has a wide, and still growing, range of highly energy efficient applications. Therefore allproduced bio<strong>gas</strong> will find an application with high energy efficiency. Not only for highly efficien<strong>the</strong>ating (utilising condensing appliances), but also for <strong>the</strong> combined heat and power production oras a clean and efficient transport fuel.page: 5
Incentives by eco-labelingBy adding <strong>gas</strong> <strong>from</strong> <strong>biomass</strong> <strong>to</strong> <strong>the</strong> natural <strong>gas</strong> <strong>grid</strong> <strong>the</strong> consumption of natural <strong>gas</strong> is for thatamount replaced with <strong>the</strong> carbon dioxide neutral <strong>gas</strong> <strong>from</strong> <strong>biomass</strong>. This means that this <strong>gas</strong> <strong>from</strong><strong>biomass</strong> can be sold as ‘green’ electricity on <strong>the</strong> ‘green’ market. Just like ‘green’ electricity <strong>the</strong>bio<strong>gas</strong> production and utilisation are only virtually connected.Peak shavingA connection of a bio<strong>gas</strong> plant with <strong>the</strong> natural <strong>gas</strong> <strong>grid</strong> will provide a possibility for peak shaving byusing <strong>the</strong> natural <strong>gas</strong> <strong>grid</strong> as a s<strong>to</strong>rage facility. The flaring of <strong>gas</strong> can be avoided during low demandperiods and 100% of <strong>the</strong> bio<strong>gas</strong> can be used.High value applicationsBy injecting bio<strong>gas</strong> in<strong>to</strong> <strong>the</strong> natural <strong>gas</strong> <strong>grid</strong>, <strong>the</strong> <strong>gas</strong> can be transferred <strong>to</strong> a location where it has ahigher value than it has at <strong>the</strong> production plant. Bio<strong>gas</strong> is currently often used in ‘low tech’applications. By injection in<strong>to</strong> <strong>the</strong> natural <strong>gas</strong> <strong>grid</strong>, <strong>the</strong> <strong>gas</strong> can be sold as vehicle fuel for a higherprice at locations that are more easily accessible for cus<strong>to</strong>mers, e.g. NGV filling stations in urbanareas. Pipeline quality <strong>gas</strong> <strong>from</strong> <strong>biomass</strong> has a market value equal <strong>to</strong> natural <strong>gas</strong>. In some countriesit may be free <strong>from</strong> eco-tax. This relief <strong>from</strong> eco-tax can be essential <strong>to</strong> provide a sufficientprofitability margin <strong>to</strong> make upgrading of <strong>the</strong> bio<strong>gas</strong> economically viable.Compared <strong>to</strong> <strong>the</strong> current practice for <strong>the</strong> production of energy <strong>from</strong> <strong>biomass</strong> <strong>the</strong> main assets foradding <strong>gas</strong> <strong>from</strong> <strong>biomass</strong> <strong>to</strong> <strong>the</strong> <strong>grid</strong> are:• higher energy efficiency• low investment costs• nearly unlimited distribution and transport facilities• daily and seasonal buffering already provided in <strong>the</strong> actual <strong>gas</strong> <strong>grid</strong>• unconditioned utilisation as a transport fuel• unconditioned utilisation in distributed power productionThe main reason for connecting bio<strong>gas</strong> plants <strong>to</strong> <strong>the</strong> natural <strong>gas</strong> network is <strong>to</strong> make <strong>gas</strong> <strong>from</strong><strong>biomass</strong> available where it can be sold for a higher price than if it is used locally. The environmentalaspect must also be considered if <strong>gas</strong> <strong>from</strong> <strong>biomass</strong>, instead of being combusted in a local boiler, isused as a transportation fuel, in for example cars, city buses or trucks.An interconnection can also provide <strong>the</strong> producer of pipeline quality <strong>gas</strong> with possibilities ofexpanding his market without <strong>the</strong> need for investment in an expansion of a local distribution <strong>grid</strong>. Amajor problem in this respect is that increased production or purification capacity in a bio<strong>gas</strong>production plant often requires large investments and <strong>the</strong>se investments cannot be made before <strong>the</strong>page: 6
market for <strong>the</strong> <strong>gas</strong> is established. By connecting <strong>the</strong> bio<strong>gas</strong> plant <strong>to</strong> <strong>the</strong> natural <strong>gas</strong> <strong>grid</strong>, marketdevelopment may be done without increasing <strong>the</strong> own production capacity (using <strong>gas</strong> <strong>from</strong> <strong>the</strong> <strong>grid</strong>)and investments may be postponed until <strong>the</strong> market for <strong>gas</strong> is established.2.2 UTILISATION OF ENERGY FROM BIOMASSThere are different routes <strong>to</strong> utilise energy <strong>from</strong> <strong>biomass</strong>. These routes can be categorised by <strong>the</strong>secondary products involved. These secondary products are:• heat : produced by combustion• bio<strong>gas</strong> : produced by anaerobic digestion• syn<strong>gas</strong> : produced by <strong>the</strong>rmal processes (<strong>gas</strong>ification and/or pyrolysis)The heat <strong>from</strong> combustion can be used for:• heating (residential, commercial and industrial)• power production• combined heat and power productionThe bio<strong>gas</strong> <strong>from</strong> anaerobic digestion can be used for:• production of pipeline quality <strong>gas</strong>• power production• combined heat and power productionThe syn<strong>gas</strong> <strong>from</strong> <strong>the</strong>rmal processes can be used for:• production of pipeline quality <strong>gas</strong>• power production• combined heat and power production• production of chemicals (e.g. methanol or hydrogen)CombustionThe most widespread application of <strong>biomass</strong> is combustion for heating. The combustion of <strong>biomass</strong>is in many rural locations <strong>the</strong> main source of heat. Only 5 <strong>to</strong> 15% of <strong>the</strong> energy in <strong>the</strong> <strong>biomass</strong> isconverted <strong>to</strong> useful heat [lit.3]. The remaining 85 - 95% is spilled <strong>to</strong> <strong>the</strong> environment.Some <strong>biomass</strong> is fed <strong>to</strong> a boiler that provides steam <strong>to</strong> drive turbines for power production.About 10 - 20% of <strong>the</strong> energy is converted <strong>to</strong> power.Co-firing is a more efficient way <strong>to</strong> utilise <strong>biomass</strong> (and wastes) for energy. In this process <strong>biomass</strong>page: 7
is mixed with coal in a combus<strong>to</strong>r providing heat <strong>to</strong> a genera<strong>to</strong>r. Typical efficiency for <strong>the</strong> productionof power ranges <strong>from</strong> 25 - 42% [lit.5].Large amounts of municipal and industrial waste are combusted in special installations in order <strong>to</strong>reduce <strong>the</strong> amount of waste. Addition of <strong>biomass</strong>, ei<strong>the</strong>r <strong>to</strong> improve <strong>the</strong> combustion properties of <strong>the</strong>waste, or <strong>to</strong> achieve a kind of co-firing, is common practice. The efficiency of <strong>the</strong> <strong>biomass</strong> herein <strong>to</strong>electricity conversion has efficiency between 23 and 30% [lit.6]. In some cases a part of <strong>the</strong> wasteheat is used for district heating.Anaerobic digestionAnaerobic digestion is <strong>the</strong> common denomina<strong>to</strong>r for a wide range of microbiological processeswhere <strong>biomass</strong> is converted <strong>to</strong> bio<strong>gas</strong>. These processes are described in chapter 3 of this reportand involve bio<strong>gas</strong> production <strong>from</strong> manure, landfills, sewage plants, industrial waste streams andsolid organic wastes.In some applications <strong>the</strong> bio<strong>gas</strong> is converted <strong>to</strong> heat. This is mainly done for landfill <strong>gas</strong>es whereabundant, low cost, bio<strong>gas</strong> is used <strong>to</strong> provide heat in local industrial applications.A long existing application is <strong>the</strong> anaerobic digestion of manure, followed by <strong>the</strong> generation ofelectricity. This application provides heat and electricity in millions of Chinese and Indian housesand communities [lit.3].Also in <strong>the</strong> Western societies bio<strong>gas</strong> is converted by a genera<strong>to</strong>r <strong>to</strong> produce electricity. Thisconversion has, due <strong>to</strong> its small scale, a modest efficiency between 20 - 35%. In some cases thatwaste heat <strong>from</strong> <strong>the</strong> genera<strong>to</strong>r finds a useful application. In Denmark most bio<strong>gas</strong> is used forcogeneration, reaching a <strong>to</strong>tal heat and power efficiency between 80 and 90%.Grid applicationsBio<strong>gas</strong> can be <strong>the</strong> feeds<strong>to</strong>ck <strong>to</strong> produce pipeline quality <strong>gas</strong>. After cleaning <strong>the</strong> bio<strong>gas</strong> can bedistributed in a medium calorific <strong>gas</strong> <strong>grid</strong>. After cleaning and treatment <strong>the</strong> bio<strong>gas</strong> can be fed <strong>to</strong> anatural <strong>gas</strong> <strong>grid</strong>.Transport applicationsAll pipeline quality <strong>gas</strong>es <strong>from</strong> <strong>biomass</strong> can be used as a transport fuel. Successful examples existfor cleaned bio<strong>gas</strong>es as well for <strong>the</strong> bio<strong>gas</strong>es converted <strong>to</strong> a pipeline quality <strong>gas</strong>.Thermal <strong>gas</strong>ificationThermal <strong>gas</strong>ification is <strong>the</strong> common denomina<strong>to</strong>r for all processes that <strong>the</strong>rmally convert organicmaterials in<strong>to</strong> a <strong>gas</strong>. The most widespread application is <strong>the</strong> <strong>gas</strong>ification of coal. The <strong>gas</strong>ification ofheavy residuals of oil refineries is becoming more and more important. Also <strong>the</strong>rmal processes canreadily <strong>gas</strong>ify <strong>biomass</strong>. In all <strong>the</strong>se processes <strong>biomass</strong> is mixed with water, air (or oxygen) and putpage: 8
<strong>to</strong> a reac<strong>to</strong>r at an elevated temperature. The resulting <strong>gas</strong> contains, after cleaning, a mixture ofcarbon monoxide, hydrogen and some methane. When air is used as <strong>gas</strong>ifying agent <strong>the</strong> product<strong>gas</strong> contains nitrogen.Some advanced processes will also use hydrogen as a <strong>gas</strong>ifying agent for <strong>biomass</strong>. This reportuses <strong>the</strong> term ‘syn<strong>gas</strong>’ for all product <strong>gas</strong>es obtained by <strong>the</strong>rmal <strong>gas</strong>ification.Experience learns that <strong>the</strong> <strong>the</strong>rmal conversion of organic materials <strong>to</strong> <strong>biomass</strong> is very efficient. Astudy in Finland mentions an efficiency range between 85 - 90%, even for ra<strong>the</strong>r small-scaleinstallations [lit.4]. A recent report by <strong>the</strong> IGU mentions an efficiency of over 95% for large-scalemodern <strong>gas</strong>ification systems [lit.7].Conversion of syn<strong>gas</strong> <strong>to</strong> electricitySyn<strong>gas</strong> can be burned <strong>to</strong> produce steam, driving a steam turbine for <strong>the</strong> production of electricity. Inthis case <strong>the</strong> overall efficiency <strong>from</strong> <strong>biomass</strong> <strong>to</strong> electricity is about 30%.Modern ‘Integrated Gasification Combine Cycle’ (IGCC) installations combine <strong>the</strong> merits of<strong>gas</strong>ification with <strong>the</strong> combined cycle electricity production. The syn<strong>gas</strong> is used in a <strong>to</strong>p cycle using a<strong>gas</strong> turbine using <strong>the</strong> remaining heat <strong>to</strong> power a steam turbine. Natural <strong>gas</strong> driven combined cyclesreach efficiencies of 60%. The overall efficiency <strong>from</strong> <strong>biomass</strong> <strong>to</strong> electricity with IGCC is currentlyabout 45%, having 50% as a reachable target within <strong>the</strong> next decade. IGCC is a valuable concept,reaching however its best performance at some larger scale (at least 20 - 100 MWe).Conversion of syn<strong>gas</strong> <strong>to</strong> syn<strong>the</strong>tic natural <strong>gas</strong>As its name already reveals, syn<strong>gas</strong> is a basis for <strong>the</strong> syn<strong>the</strong>sis of o<strong>the</strong>r products. There is a widerange of experience of producing methanol and car fuels <strong>from</strong> syn<strong>gas</strong>. The conversion of syn<strong>gas</strong><strong>from</strong> coal or oil residues <strong>to</strong> methane makes it possible <strong>to</strong> produce a pipeline quality <strong>gas</strong>. Thisprocess has been subject of many experiments and studies. Due <strong>to</strong> <strong>the</strong> low price of natural <strong>gas</strong>itself, large-scale implementation in practice is suspended until <strong>the</strong> low cost natural <strong>gas</strong> sources aredepleted.Also syn<strong>gas</strong> <strong>from</strong> <strong>biomass</strong> can be processed <strong>to</strong> give pipeline quality <strong>gas</strong>. Currently this processroute is not demonstrated. Competing, proven technologies for using <strong>biomass</strong> are currently moreattractive. In later chapters this report will describe this process route and its merits in more detail.Efficiency considerationsAll efficiency considerations start at <strong>the</strong> availability of <strong>biomass</strong> and end with <strong>the</strong> utilisation by <strong>the</strong>final user. The <strong>to</strong>tal efficiency is given in <strong>the</strong> ratio energy flow of <strong>the</strong> <strong>biomass</strong> input and <strong>the</strong> delivereduseful energy flow. Cases <strong>to</strong> be distinguished are <strong>the</strong> production of heat, <strong>the</strong> production of power,<strong>the</strong> combined production of heat and power (cogeneration) and <strong>the</strong> production of vehicle fuel.page: 9
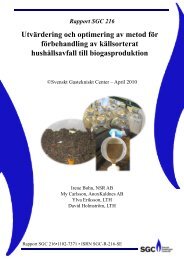
Comparing efficiency data is a difficult task. The availability of data is poor and often <strong>the</strong>se data lackin a clear definition of <strong>the</strong> system border. The most important efficiency is <strong>the</strong> <strong>to</strong>tal efficiency of <strong>the</strong>whole chain between <strong>the</strong> input of renewable primary energy and <strong>the</strong> end-use by <strong>the</strong> consumer. Anydissipation of energy <strong>to</strong> <strong>the</strong> environment reduces <strong>the</strong> energy efficiency. By narrowing <strong>the</strong> systemborders essential parts of <strong>the</strong> chain are omitted and <strong>to</strong>o high or low efficiency data are reported.Figure 1 gives a survey of <strong>the</strong> process <strong>from</strong> <strong>the</strong> input of solar radiation <strong>to</strong> <strong>the</strong> end-use of energy.This process follows <strong>the</strong> flow of materials and also <strong>the</strong> flow of energy. An important aspect is <strong>the</strong>‘balance of plant’ indicating <strong>the</strong> exchange of energy (and often also mass) between partialprocesses. The ‘balance of plant’ is an important <strong>to</strong>ol <strong>to</strong> improve <strong>the</strong> <strong>to</strong>tal process efficiency. Theintegrated <strong>gas</strong>ification combined cycle (IGCC) <strong>biomass</strong> power plant is an example with anelaborated balance of plant approach. This figure indicates also <strong>the</strong> partial processes: <strong>biomass</strong>production, <strong>biomass</strong> treatment, production of <strong>gas</strong>, conversion, distribution and finally <strong>the</strong> end-use.For each step a partial efficiency can be defined, in which care should be taken for <strong>the</strong> effects of <strong>the</strong>balance of plant <strong>the</strong> input of energy <strong>from</strong> outside and losses <strong>to</strong> <strong>the</strong> environment. Often usedefficiency definitions are: <strong>to</strong>tal efficiency, <strong>gas</strong>ification efficiency, efficiency heat production, efficiencypower production and distribution efficiency. The efficiency is always given by <strong>the</strong> ratio of <strong>to</strong>taluseful energy output divided by <strong>the</strong> <strong>to</strong>tal energy input, expressed as a percentage. The <strong>to</strong>talefficiency of <strong>the</strong> process is built <strong>from</strong> partial efficiencies in <strong>the</strong> chain <strong>from</strong> input <strong>to</strong> product.Subsystem: <strong>biomass</strong> production, collection and transportRadiation energy <strong>from</strong> <strong>the</strong> sun is collected and s<strong>to</strong>red in <strong>biomass</strong>. All human activity later in <strong>the</strong>chain introduces losses. The addition of fertilisers, energy use in <strong>the</strong> collection and transport of<strong>biomass</strong> can do this. The balance of plant may be improved by using <strong>the</strong> ash <strong>from</strong> <strong>the</strong> <strong>gas</strong>ificationprocess as fertiliser and by <strong>the</strong> use of bio fuel in <strong>the</strong> collection and transport apparatus.A practical limit is <strong>the</strong> diameter of <strong>the</strong> collection area. A 30 - 50 km diameter area seems <strong>to</strong> be <strong>the</strong>maximum.When organic waste, ei<strong>the</strong>r liquid or solid, is used as <strong>the</strong> source of energy this subsystem is of no,or minor, importance.Subsystem: <strong>biomass</strong> pre-treatmentSome <strong>biomass</strong> conversion processes require some energy using facilities before <strong>the</strong> <strong>biomass</strong> canbe used. The facilities often include drying and grinding facilities. The energy needed by <strong>the</strong>sefacilities should be accounted for in <strong>the</strong> amount of primary energy.In <strong>the</strong> balance of plant <strong>the</strong> heat <strong>from</strong> <strong>the</strong> conversion subsystem can be used for drying.Subsystem: <strong>gas</strong> productionpage: 10
In <strong>the</strong> <strong>gas</strong> production process <strong>the</strong> input and output is <strong>to</strong> be compared. Care should be taken for <strong>the</strong>addition of energy <strong>to</strong> maintain <strong>the</strong> <strong>gas</strong>ification. The cleaning of <strong>the</strong> <strong>gas</strong> also requires energy and isoften included in <strong>the</strong> <strong>gas</strong> production subsystem. The potential for <strong>the</strong> balance of plant depends on<strong>the</strong> <strong>gas</strong> production process. Some <strong>gas</strong>ification processes produce heat, o<strong>the</strong>rs use heat.Subsystem: upgrading and conversionThis subsystem can include completely different technologies, including boilers, genera<strong>to</strong>rs and <strong>gas</strong>conversion units. Also here input and output are <strong>to</strong> be compared. Some conversion processesproduce waste heat, which can be used in <strong>the</strong> balance of plant. The production of heat should beconsidered as lost energy unless useful application within or outside <strong>the</strong> process is found.Subsystem: distributionEnergy is not utilised at <strong>the</strong> location. Care should be taken for <strong>the</strong> often considerable losses indistribution networks. The distribution of <strong>gas</strong> requires compression, electricity has ohmic losses andheat transport suffers considerable heat losses. Due <strong>to</strong> relatively high losses, heat can only beefficiently distributed over short distances. Electricity and <strong>gas</strong> can be distributed over largerdistances with small losses of energy. On short distances all energy carriers are acceptable, onmedium distances electricity and <strong>gas</strong> perform well and at <strong>the</strong> long distance <strong>gas</strong> is <strong>the</strong> only efficientand affordable mean of energy distribution. Long distance transport of <strong>gas</strong> requires compression <strong>to</strong>high pressure or liquefaction.Subsystem: utilisationThe utilisation of energy is an important item in selection of <strong>the</strong> preferred energy carrier. Electricityis perfect since it can perform all user functions as <strong>the</strong> provision of power, heating and coolingefficiently. Transport by electrical vehicles is possible but suffers <strong>to</strong> capacity limitations. The onlydrawback is <strong>the</strong> lack of buffering potential. Electricity is <strong>to</strong> be used when produced. Gas is secondbest. Utilisation for all purposes is possible with high efficiency, but <strong>the</strong> utilisation equipment is oftenmore complex than <strong>the</strong> electrical counter part. S<strong>to</strong>rage of <strong>gas</strong> is very well possible, enabling fullutilisation of all energy produced <strong>from</strong> <strong>biomass</strong>. Heat is a restricted energy carrier. It can be used forheating and with a low efficiency also for cooling. Conversion of low-grade heat <strong>to</strong> electricity has avery low efficiency. S<strong>to</strong>rage of heat for a couple of days is feasible, but heat produced in summerwill be nearly without use.page: 11
Figure 1: Energy flow diagram and indication of system border in <strong>biomass</strong> utilisation options.The dotted lines indicate subsystem borders.page: 12
Improving <strong>the</strong> energy efficiency in <strong>the</strong> utilisation of <strong>biomass</strong> in <strong>the</strong> fuel supply is a major asset <strong>to</strong>enlarge <strong>the</strong> contribution of <strong>biomass</strong> <strong>to</strong> <strong>the</strong> world sustainable energy supply. The efficiency data arera<strong>the</strong>r scarce in literature but remarkably consistent. The <strong>gas</strong>ification subsystem efficiency is up <strong>to</strong>95%. This efficiency is independent of <strong>the</strong> used feeds<strong>to</strong>ck or technology. The efficiency of <strong>the</strong>conversion subsystem for <strong>the</strong> power production is about 30% using single cycle genera<strong>to</strong>rs, orabout 55% using combined cycle equipment.The efficiency of <strong>the</strong> conversion of <strong>gas</strong> <strong>from</strong> <strong>biomass</strong> <strong>to</strong> heat, or <strong>the</strong> conversion <strong>to</strong> heat and power isabout 80 - 90%.2.3 ECONOMICAL ASPECTSPotential economic profit is one of <strong>the</strong> most important drives and critical success fac<strong>to</strong>rs <strong>to</strong> realise<strong>the</strong> addition of <strong>gas</strong>es <strong>from</strong> <strong>biomass</strong> <strong>to</strong> a <strong>gas</strong> <strong>grid</strong>. The most relevant perspective is that of <strong>the</strong>(potential) producer. At that position <strong>the</strong> economical reality demonstrates <strong>the</strong> impacts on <strong>the</strong> profits.The main items are:• cost <strong>biomass</strong> or organic waste (availability, quality, competing applications)• investment costs• operation and maintenance costs• product revenuesCost <strong>biomass</strong> and/or organic wasteBiomass for energy is by nature a scarce product. Cost of collection and transport limit <strong>the</strong> sourcearea by a distance of 30 - 50 km <strong>to</strong> <strong>the</strong> conversion plant. Within this area existing or new competingusers can readily result in rising <strong>biomass</strong> costs. Important competi<strong>to</strong>rs are for example <strong>the</strong> agroindustry, <strong>the</strong> production of building materials, and <strong>the</strong> producers of electricity. Organic wastes arereduced at <strong>the</strong> source or recycled in higher value applications. Experience learns that prices for <strong>the</strong><strong>biomass</strong> (or organic wastes) sharply rise when <strong>the</strong> plant operation starts.Investment costsBiomass conversion plant hardware investments are ra<strong>the</strong>r well-known. A full-scale commercialIGCC plant will typically cost 1000 €/kWe [lit.7]. Full-scale bio<strong>gas</strong> treatment plants will cost typically500 €/kWg. The estimated cost for a <strong>biomass</strong> <strong>to</strong> pipeline quality <strong>gas</strong> plant will be 1200 €/kWg.Currently many governments give substantial subsidies for new <strong>biomass</strong> plants, often going up <strong>to</strong>50% of <strong>the</strong> investment costs.Operation and maintenance costsOperation and production costs are ra<strong>the</strong>r well predictable. From <strong>the</strong> IGU study [lit.7]. It can bederived that <strong>the</strong>se yearly costs will be about 15% of <strong>the</strong> unsubsidised investment costs.Product revenuespage: 13
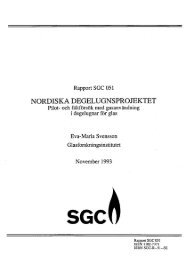
The product revenues are <strong>the</strong> most uncertain fac<strong>to</strong>r in <strong>the</strong> economic evaluation process. The lowerlimit is given by <strong>the</strong> prices for electricity <strong>from</strong> heavily subsidised coal and nuclear power stations(currently about 1 c€/kWh). The upper limit is given by <strong>the</strong> prices for green electricity (currentlyabout 10 c€/kWh). Prices for natural <strong>gas</strong> are at this moment more stable. On fur<strong>the</strong>r implementationof <strong>the</strong> liberalised market also <strong>the</strong> prices of <strong>gas</strong>es for <strong>the</strong> <strong>grid</strong> will show larger fluctuations.The producer cannot influence <strong>the</strong> product revenue and <strong>the</strong> feeds<strong>to</strong>ck cost, important fac<strong>to</strong>rs for <strong>the</strong>economic viability of a plant. These uncertainties make it very troublesome <strong>to</strong> start a commercialplant for <strong>the</strong> production of <strong>gas</strong> <strong>from</strong> <strong>biomass</strong> for <strong>the</strong> <strong>gas</strong> <strong>grid</strong>.Värnamo (Sweden), a plant for biofuel-fired combined heat and power generation based onpressurized <strong>gas</strong>ificationpage: 14
3 PRODUCING GAS FROM BIOMASS3.1 BIOGAS FROM ANAEROBIC DIGESTION3.1.1 Anaerobic digestion of <strong>biomass</strong> and organic wasteIn <strong>the</strong> anaerobic conversion of <strong>biomass</strong> and waste, organic materials are microbiologicallyconverted <strong>to</strong> methane, carbon dioxide and water. This process occurs in nature on all places whereair is excluded <strong>from</strong> <strong>the</strong> organic materials. The exclusion can be caused by submersion in water.The methane rich swamp <strong>gas</strong>es are produced by anaerobic digestion. Depletion of oxygen isano<strong>the</strong>r trigger for <strong>the</strong> anaerobic digestion. The production of methane <strong>from</strong> landfill starts as soonas all environmental oxygen is used by <strong>the</strong> aerobic conversion of <strong>the</strong> organic content. In <strong>the</strong>anaerobic conversion <strong>the</strong> sulphurous components are converted <strong>to</strong> hydrogen sulphide and <strong>the</strong>nitrogenous components are converted <strong>to</strong> ammonia. Also some traces of hydrogen cyanide can beproduced. The rate of <strong>the</strong> anaerobic digestion is determined by <strong>the</strong> composition of <strong>the</strong> reactionmixture and <strong>the</strong> temperature. The rate of reaction increases with higher temperatures. This increaseof <strong>the</strong> reaction rate is limited by <strong>the</strong> stability of <strong>the</strong> microbiological agents in this process.Temperatures <strong>to</strong> about 55 °C are however feasible.Examples of anaerobic conversion processes for <strong>the</strong> production of bio<strong>gas</strong> are:• sewage treatment plants: Sewage treatment plants produce methane rich <strong>gas</strong>es. Utilisation ofmethane <strong>from</strong> sewage plants is used on a large scale in many countries. Optimised processconditions can enhance <strong>the</strong> production and collection of <strong>the</strong>se <strong>gas</strong>es.• landfills: All landfills produce methane rich <strong>gas</strong>es. Collection and utilisation of <strong>the</strong> <strong>gas</strong>es is quitewell possible. Improved collection, processing and utilisation of landfill <strong>gas</strong>es will be animportant <strong>to</strong>ol <strong>to</strong> increase <strong>the</strong> importance of landfill <strong>gas</strong>.• cleaning of organic industrial waste streams: Anaerobic digestion processes are oftensuccessfully applied <strong>to</strong> clean <strong>the</strong> waste streams of agricultural processing industry. Themethane rich <strong>gas</strong>es are mainly utilised <strong>to</strong> produce electricity.• mesofil and <strong>the</strong>rmophil digestion of organic waste: Compact installations convert at highertemperatures municipal organic waste <strong>to</strong> methane rich <strong>gas</strong>es.Bio<strong>gas</strong> plants utilising anaerobic digestion make a valuable contribution <strong>to</strong> <strong>the</strong> solution of a range ofproblems concerning agricultural, environmental and energy interests. It is <strong>the</strong>refore relevant <strong>to</strong>regard bio<strong>gas</strong> technology as a promising element in <strong>the</strong> chain of organic waste recycling.The bio<strong>gas</strong> concept offers a <strong>to</strong>tal appropriate system for treatment, sanitation, redistribution andnutrient utilisation <strong>from</strong> lives<strong>to</strong>ck slurry and organic waste [lit.8].page: 15
3.1.2 Survey of technologiesThis paragraph gives details on centralised bio<strong>gas</strong> plants, farm bio<strong>gas</strong> plants, sewage plants andlandfills.Centralised bio<strong>gas</strong> plantsDenmark has a large experience with centralised bio<strong>gas</strong> plants. The major <strong>biomass</strong> resource foranaerobic digestion in Denmark is animal manure. Approximately 75% of <strong>the</strong> <strong>biomass</strong> treated inDanish plants is manure, and around 25% of <strong>the</strong> <strong>biomass</strong> is waste that mainly originates <strong>from</strong> <strong>the</strong>food industries. A few plants treat sewage sludge as a supplement <strong>to</strong> animal manure. A few plantsare capable of treating source separated household waste.Animal manure, mostly slurry, is transported <strong>from</strong> farms <strong>to</strong> <strong>the</strong> bio<strong>gas</strong> plant in vehicles owned by <strong>the</strong>bio<strong>gas</strong> plant. The normal situation is that food processing industries and municipalities take care of<strong>the</strong> transportation of waste <strong>to</strong> <strong>the</strong> bio<strong>gas</strong> plant.In <strong>the</strong> bio<strong>gas</strong> plant manure and organic waste are mixed and digested in anaerobic tanks for 12 <strong>to</strong>25 days. During this period effective sanitation takes place and weeds and pathogens are killed ona satisfac<strong>to</strong>ry scale.From <strong>the</strong> digestion process bio<strong>gas</strong> emerges which is cleaned and normally utilised in combinedheat and power production plants. Heat is usually distributed in district heating systems, andelectricity sold <strong>to</strong> <strong>the</strong> power <strong>grid</strong>.The <strong>biomass</strong> leaving <strong>the</strong> digestion tanks is called digested manure. It is returned by vehicle <strong>to</strong> slurrys<strong>to</strong>rage tanks, until it is end-used as fertiliser.The bio<strong>gas</strong> plant technology is simple, but many practical details have <strong>to</strong> be considered in order <strong>to</strong>avoid interruptions and optimise production. Manure and organic waste are mixed in mixing tanksand <strong>from</strong> here pumped in<strong>to</strong> <strong>the</strong> closed and stirred reac<strong>to</strong>r tanks were it is heated and anaerobicallydigested. The digestion culture is self-sustaining after a start-up phase. The process is continuous,as a daily fractional extraction is replaced by new feed. The reac<strong>to</strong>r productivity is significantlyimproved by <strong>the</strong> addition of organic waste.The average residence time is between 12 and 25 days depending on temperature, shortest at hightemperature. Thermofil digestion takes place at 50 - 55 °C and mesofil at 30 - 40 °C.In order <strong>to</strong> increase production stability and capacity and <strong>to</strong> minimise power consumption, <strong>the</strong>following technical details have been studied and fur<strong>the</strong>r developed based on practical experience:• Preference of <strong>the</strong>rmofil digestion depending on manure composition• Addition of organic waste• Buffer tanks for extracted slurry contributing <strong>to</strong> <strong>gas</strong> production• Mixing and stirring equipment• Pump design• Heat exchangers between incoming and extracted slurrypage: 16
• Removal of sand <strong>from</strong> mixing tanks and reac<strong>to</strong>rs• Abatement of smell <strong>from</strong> <strong>the</strong> plants• Cleaning of <strong>gas</strong> for hydrogen sulphide, ammonia and particulate.Farm bio<strong>gas</strong> plantsThe bio<strong>gas</strong> production on farms uses basically <strong>the</strong> same processes as centralised plants andnormally <strong>the</strong> farm also establishes a CHP facility. Heat is usually distributed <strong>to</strong> <strong>the</strong> farm itself and <strong>to</strong>nearby users. Electricity is sold <strong>to</strong> <strong>the</strong> power <strong>grid</strong>.The size and <strong>the</strong> set-up vary. The reac<strong>to</strong>rs include horizontal and vertical steel tanks as well asconcrete basins. The mixing devices range <strong>from</strong> stirrer and propeller <strong>to</strong> pump.Some plants have a <strong>gas</strong> s<strong>to</strong>rage facility <strong>to</strong> be able <strong>to</strong> take advantage of power peak hours. Thes<strong>to</strong>rage may be established as a <strong>gas</strong>bag covering <strong>the</strong> reac<strong>to</strong>r or as a <strong>gas</strong>bag in a separate building.Like <strong>the</strong> centralised plants, <strong>the</strong> smaller farm plants have found it attractive <strong>to</strong> mix manure andorganic waste <strong>to</strong> stabilise and increase productivity. However, <strong>the</strong> requirement of heat treatment ofwaste at 70 °C for one hour in some countries seems <strong>to</strong> be a blockage.Sewage plantsThe bio<strong>gas</strong> technology has its origin in sewage plants where digestion of <strong>biomass</strong> is used <strong>to</strong> reduce<strong>the</strong> amount of dry content as opposed <strong>to</strong> oxygenation. The energy production through bio<strong>gas</strong> wassecondary <strong>to</strong> <strong>the</strong>se plants. Today <strong>the</strong> bio<strong>gas</strong> energy production attracts attention as opposed <strong>to</strong> <strong>the</strong>energy consumption required for oxygenation.It is noted that half of <strong>the</strong> potential bio<strong>gas</strong> energy available in sewage plants is used forde-nitrification. Environmentally and economically it is <strong>the</strong>refore preferable <strong>to</strong> treat <strong>the</strong> sewage slurryin centralised bio<strong>gas</strong> plants where <strong>the</strong> de-nitrification is avoided and <strong>the</strong> nitrogen recycled. Thissolution is not applicable however, when <strong>the</strong> content of environmental foreign elements is high.LandfillLandfill <strong>gas</strong> is produced biologically <strong>from</strong> organic material in waste deposits. The <strong>gas</strong> productionpeaks at about 20 years after closure and continues for more than 50 years.The <strong>gas</strong> is extracted by vertical or horizontal perforated tubes and filtered. The blower orcompressor used also establishes <strong>the</strong> supply pressure.The extraction of <strong>the</strong> <strong>gas</strong> is seen not only as a source of energy, but also as a precaution againstgreen house <strong>gas</strong> emission <strong>to</strong> <strong>the</strong> atmosphere. An additional advantage is also <strong>the</strong> reduction, ofteneven elimination, of odour emissions. The occurrence of fires and explosions caused by involuntarymethane emissions is reduced <strong>to</strong> zero.page: 17
3.1.3 Table of bio<strong>gas</strong> compositionsDepending on <strong>the</strong> raw material and <strong>the</strong> digestion process, <strong>the</strong> composition of <strong>the</strong> <strong>gas</strong> produced willvary. The energy content of <strong>the</strong> <strong>gas</strong> is linked <strong>to</strong> <strong>the</strong> methane component, so <strong>the</strong> processoptimisation will focus on <strong>the</strong> content of this component, which may come as high as 80% in case ofindustrial sewage.Carbon dioxide and nitrogen, are inert <strong>gas</strong>es that reduce <strong>the</strong> heating value of <strong>the</strong> bio<strong>gas</strong>. Asdiscussed in chapter 4, upgrading of bio<strong>gas</strong> by removal of nitrogen is still <strong>to</strong>o expensive, whereasseveral techniques are available for removal of carbon dioxide at low costs. Bio<strong>gas</strong> containing largeramounts of nitrogen can however be added <strong>to</strong> <strong>the</strong> <strong>grid</strong> distributing pipeline quality <strong>gas</strong> with a lowheating value (L-<strong>gas</strong>).Hydrogen sulphide is poisonous and highly corrosive, <strong>the</strong> content being dependent on <strong>the</strong> rawmaterial. Even in small-scale installations this component is normally removed <strong>to</strong> a level of less than3 ppm.Concentration Bio<strong>gas</strong> plant Sewage plant LandfillComponentinMethane % 60 - 70 55 - 65 45 - 55Carbon dioxide % 30 - 40 balance 30 - 40Nitrogen % < 1 < 1 5 - 15Hydrogen sulphide ppm10 – 2000 10 - 40 50 - 300Table 2: Typical raw (untreated) bio<strong>gas</strong> compositions at <strong>the</strong> different plants3.1.4 Indication of investments, operation and maintenance costsCentralised bio<strong>gas</strong> plantSince 1984, 20 centralised bio<strong>gas</strong> plants have been established and operated in Denmark. Themain purpose of <strong>the</strong> first plants was energy production. Later it was found that <strong>the</strong> plants make asignificant contribution <strong>to</strong> solving a number of environmental problems in <strong>the</strong> fields of agriculture,waste recycling and greenhouse <strong>gas</strong> reduction. In recognition of this, <strong>the</strong> government has supported<strong>the</strong> development in different ways: appropriate legislative framework, research and developmentprogrammes, investment grants and o<strong>the</strong>r subsidies.In relation <strong>to</strong> <strong>the</strong> investment grants and subsidies, <strong>the</strong> financial and economic situation of all <strong>the</strong>plants is moni<strong>to</strong>red year by year and made publicly available. As plants vary considerably in size,age and technology, figures are not directly comparable. Instead, representative and realistic figuresfor <strong>the</strong> ‘Plant of <strong>to</strong>day’ are presented. The figures are based on <strong>the</strong> large number of existing plantspage: 18
with correction for late developments. The capacity of <strong>the</strong> plant is chosen <strong>to</strong> be optimal in relation <strong>to</strong><strong>the</strong> size of Danish farms and <strong>the</strong>ir distribution.Aspect Unit ValueTreatment capacityM 3 /dayM 3 /year300109,500• 80% ManureM 3 /day240• 20% Organic wasteM 3 /day60Bio<strong>gas</strong> production at 65% methaneM 3 /day 10,200at 34 m 3 bio<strong>gas</strong>/m 3 <strong>biomass</strong>InvestmentsPlant investment M€ 4.0Vehicles investment €M 0.5Total costs*Treatment costsM€/year€/m 3 <strong>biomass</strong>0.556.0Transport costsPrice of <strong>gas</strong>Bio<strong>gas</strong>Table 3: Characteristics ‘Centralised Plant of <strong>to</strong>day’M€/year€/m 3 <strong>biomass</strong>C€/m 3 bio<strong>gas</strong>*At 65% methane0.222.324*) Assumptions made:Interest rate5% per yearDepreciation of investments:Buildings20 yearsTanks/mechanical equipment 15 -Vehicles chassis 7 -Vehicle tanks 15 -The price, 24 c€/m 3 bio<strong>gas</strong> (65% methane) is not discussed in this paragraph, but it is stressed thatno o<strong>the</strong>r potential sources of income have been anticipated in <strong>the</strong> price calculation.Farm bio<strong>gas</strong> plantsNo consistent figures are available, but <strong>the</strong> following range of investments has been found. Thefarmer often performs <strong>the</strong> maintenance.page: 19
Aspect Unit ValueManure M 3 /day 6Bio<strong>gas</strong> production, 60% methane atM 3 /day 10017m 3 bio<strong>gas</strong>/m 3 <strong>biomass</strong>InvestmentsPlant investment incl. powerK€ 100 - 300generationPrice of <strong>gas</strong> C€/m 3bio<strong>gas</strong>n.a.Table 4: ‘Farm Plant’ characteristicsBio<strong>gas</strong> <strong>from</strong> farms is always used locally for heat and power production, no examples are knownwhere it has been upgraded and added <strong>to</strong> <strong>the</strong> <strong>gas</strong> <strong>grid</strong>.Sewage plantsNo consistent figures are available.LandfillNo consistent figures are available. The high content of nitrogen makes <strong>the</strong> <strong>gas</strong> unsuitable forupgrading and injection in<strong>to</strong> a high calorific natural <strong>gas</strong> <strong>grid</strong>.3.2 SYNGAS FROM BIOMASS PYROLYSIS AND GASIFICATION3.2.1 General aspects of <strong>the</strong>rmal <strong>biomass</strong> <strong>gas</strong>ificationGasification technology for syn<strong>gas</strong> production <strong>from</strong> <strong>biomass</strong>The technology for <strong>the</strong> <strong>the</strong>rmal <strong>gas</strong>ification of <strong>biomass</strong> is mainly derived <strong>from</strong> <strong>the</strong> <strong>gas</strong>ification ofcoal. There is a tremendous worldwide experience basis in <strong>the</strong> <strong>gas</strong>ification of coal. The coal<strong>gas</strong>ification is a mature technology able <strong>to</strong> fulfil any rational commercial requirements. Thisexperience started already in <strong>the</strong> 1850’s when <strong>the</strong> first coal <strong>gas</strong> pipelines came on stream. Currentcoal <strong>gas</strong>ification technology has three branches <strong>to</strong> be distinguished by <strong>the</strong>ir reac<strong>to</strong>r characteristics.These three branches are fixed bed, fluidised bed and entrained flow <strong>gas</strong>ifiers.In <strong>the</strong> fixed bed <strong>the</strong> <strong>biomass</strong> is embedded in a flow of <strong>the</strong> reactant. During <strong>the</strong> <strong>gas</strong>ification <strong>the</strong>remaining ashes are removed and new <strong>biomass</strong> is added. This causes some movement in <strong>the</strong><strong>biomass</strong>. In some <strong>gas</strong>ifiers rotating <strong>the</strong> <strong>gas</strong>ifier enhances this movement by some rotatingmovement in <strong>the</strong> reacting chamber. This movement is <strong>to</strong> remove <strong>the</strong> ashes and <strong>to</strong> enhance <strong>the</strong>interaction of <strong>the</strong> reactant <strong>gas</strong>es with <strong>the</strong> <strong>biomass</strong>.Essentially this reac<strong>to</strong>r shows plug flow and has an essentially high conversion efficiency.page: 20
In fluidised bed reac<strong>to</strong>rs <strong>the</strong> reactant <strong>gas</strong>es are blown <strong>from</strong> <strong>the</strong> bot<strong>to</strong>m through <strong>the</strong> <strong>biomass</strong> withsuch a speed that <strong>the</strong> <strong>biomass</strong> obtains a liquid like fluid state. Fluidised bed reac<strong>to</strong>rs behave likecontinuously stirred reac<strong>to</strong>rs and show essentially only a partial conversion.In entrained bed <strong>gas</strong>ifiers pulverised coal and reactant <strong>gas</strong>es are flowing at high speed in <strong>the</strong> samedirection. The reactions proceed in a flame-like zone, leaving <strong>the</strong> syn<strong>gas</strong> and ashes at <strong>the</strong> end of<strong>the</strong> reaction zone. Essentially this is a plug flow reac<strong>to</strong>r resulting in a completed conversion. Sinceits very difficult <strong>to</strong> pulverise <strong>biomass</strong> this kind of reac<strong>to</strong>rs is not applied in <strong>biomass</strong> <strong>gas</strong>ification.The nature of <strong>the</strong> reactant <strong>gas</strong>es fur<strong>the</strong>r differentiates <strong>the</strong> <strong>gas</strong>ification processes. Besides air <strong>the</strong>reactant <strong>gas</strong>es can be oxygen, water and hydrogen. Air is available at <strong>the</strong> lowest cost but <strong>the</strong>resulting <strong>gas</strong> will always contain a large amount of nitrogen.• The use of oxygen will result in a richer product <strong>gas</strong> and allows <strong>the</strong> use of a more compact<strong>gas</strong>ifiers and syn<strong>gas</strong> treatment system. This has <strong>to</strong> be weighed against <strong>the</strong> expensive andenergy consuming oxygen <strong>from</strong> <strong>the</strong> air separation plant.• <strong>Adding</strong> water will result in additional hydrolysis processes. Water is available at low cost. Theresulting hydrolysis improves <strong>the</strong> quality of <strong>the</strong> product <strong>gas</strong>es.• Also <strong>the</strong> addition of hydrogen will result in a better product <strong>gas</strong>, but is only feasible in <strong>the</strong> scarcesituation that hydrogen is available at low cost and not usable in o<strong>the</strong>r, more profitable,applications.Fur<strong>the</strong>r differentiation is <strong>the</strong> process conditions given by <strong>the</strong> temperature and <strong>the</strong> pressure in <strong>the</strong>reac<strong>to</strong>r. Higher pressure and temperatures will result in more compact reac<strong>to</strong>rs. Higher pressures(typically 30 - 50 bar) will also result in a larger fraction of methane and some o<strong>the</strong>r hydrocarbons in<strong>the</strong> syn<strong>gas</strong>. Higher temperatures (typically 1200 - 1600 °C) will result in higher hydrogen and carbonmonoxide fractions in <strong>the</strong> syn<strong>gas</strong>. In <strong>the</strong> comparatively small <strong>biomass</strong> <strong>gas</strong>ification plants risingpressure and temperature increases also <strong>the</strong> cost of <strong>the</strong> reac<strong>to</strong>r and auxiliary equipment forintroduction of <strong>the</strong> <strong>biomass</strong> and compression of <strong>the</strong> reactants.Dedicated designed <strong>biomass</strong> plants use atmospheric or moderate (3 - 5 bar) pressure. Alsomoderate <strong>gas</strong>ification temperatures (400 - 800 °C) prevail.Technologies for syn<strong>gas</strong> cleaningThe syn<strong>gas</strong>es for <strong>biomass</strong> and coal have nearly <strong>the</strong> same properties. Generally <strong>the</strong> syn<strong>gas</strong> <strong>from</strong><strong>biomass</strong> contains less contaminants like metals, ashes, tars and sulphurous components. Therefore<strong>the</strong> mature technology for cleaning of syn<strong>gas</strong> <strong>from</strong> coal can apply <strong>to</strong> syn<strong>gas</strong> <strong>from</strong> <strong>biomass</strong>. Due <strong>to</strong><strong>the</strong> disperse location of <strong>biomass</strong> sources <strong>the</strong> capacity of most <strong>biomass</strong> plants will be much smallerthan <strong>the</strong> current giant coal <strong>gas</strong>ification facilities.page: 21
Technologies for syn<strong>gas</strong> upgradingThe <strong>gas</strong> generated <strong>from</strong> coal has different applications. They include distribution <strong>to</strong> consumers, <strong>the</strong>generation of power, <strong>the</strong> conversion <strong>to</strong> pipeline quality <strong>gas</strong> and <strong>the</strong> conversion <strong>to</strong> a nearly infiniterange of chemical products. All <strong>the</strong>se mature processes are available for <strong>the</strong> upgrading of syn<strong>gas</strong><strong>from</strong> <strong>biomass</strong>.PyrolysisPyrolysis is <strong>the</strong> degradation of organic materials at high temperature in absence of o<strong>the</strong>r reactantslike oxygen or water. Unlike coal, <strong>biomass</strong> is readily pyrolysed at relatively low temperatures. Thispyrolysis generates a considerable amount of syn<strong>gas</strong>, but also some carbon rich liquids and solids.In <strong>biomass</strong> <strong>gas</strong>ification <strong>the</strong> pyrolysis step is <strong>the</strong>refore often followed by a <strong>gas</strong>ification of <strong>the</strong>remaining non-<strong>gas</strong>eous organic materials. This <strong>gas</strong>ification is ra<strong>the</strong>r easy due <strong>to</strong> <strong>the</strong> high reactivityof this organic material.The pyrolysis is enhanced by <strong>the</strong> addition of water in <strong>the</strong> reaction chamber. Water at hightemperature is very reactive <strong>to</strong> <strong>the</strong> organic materials in <strong>the</strong> <strong>biomass</strong>. The reaction of water withorganic materials is called ‘reforming’. There are quite a lot of <strong>biomass</strong> <strong>gas</strong>ification processes indevelopment combining pyrolysis, reforming and <strong>gas</strong>ification. These processes hold promises since<strong>the</strong>y can be performed at a small scale and with compact and low cost equipment. The resultingsyn<strong>gas</strong> contains less inert components allowing smaller and lower cost cleaning, conversion andupgrading equipment.HydrolysisBiomass can easily be <strong>gas</strong>ified in <strong>the</strong> reaction with water at temperatures of about 600 ºC andpressures at about 350 bar. This <strong>gas</strong>ification results in a hydrogen and methane rich syn<strong>gas</strong><strong>to</strong>ge<strong>the</strong>r with considerable amounts of liquid organic materials. Hydrolysis of <strong>biomass</strong> is still in <strong>the</strong>research phase. Research is going on in <strong>the</strong> USA at NREL (National Renewable EnergyLabora<strong>to</strong>ry) and in Japan at <strong>the</strong> University of Tokyo.HydrogenationIn <strong>the</strong> Ne<strong>the</strong>rlands ECN is starting a project <strong>to</strong> <strong>gas</strong>ify <strong>biomass</strong> with hydrogen. This hydrogen will beobtained as a residual of industrial processes or, in <strong>the</strong> far future, <strong>from</strong> renewable sources. Thisproject is dedicated <strong>to</strong> <strong>the</strong> production of pipeline quality <strong>gas</strong>.page: 22
Overview <strong>the</strong>rmal <strong>gas</strong>ification for <strong>biomass</strong>Table 5 gives a survey of <strong>the</strong>rmal <strong>biomass</strong> <strong>gas</strong>ification described in appendix 2.Type Name Additional characteristicsBioneerupdraft fixed bedEisenmannrotary drumFixed bed LurgiPRMEProme<strong>the</strong>usBTS-fluid bedEisenmannPressurised fluidised bedFoster WheelerFluidised bedLurgiPyroflowAtmospheric, circulating fluidised bedSELTECS<strong>to</strong>rkcirculating fluidised bedTPSAtmospheric fluidised bedBatelle/Fercopyrolysis followed by <strong>gas</strong>ificationBrightstarpyrolysis followed by reformingEVNpyrolysis <strong>gas</strong>ifierPyrolysis Gibrospyrolysis followed by <strong>gas</strong>ificationNoellpyrolysis followed by high temperature <strong>gas</strong>ificationThermoselectpyrolysis followed by <strong>gas</strong>ificationThermogenicspyrolysis, with utilisation of remaining liquids and solidsHydrogenation ECNTable 5: Survey of reported <strong>the</strong>rmal <strong>biomass</strong> <strong>gas</strong>ification processesThe composition of <strong>the</strong> syn<strong>gas</strong> obtained <strong>from</strong> <strong>biomass</strong> by <strong>the</strong> different processes can typically bedivided in<strong>to</strong> five categories. These are syn<strong>gas</strong>es obtained by <strong>gas</strong>ification of <strong>biomass</strong> with air, <strong>the</strong><strong>gas</strong>ification of <strong>biomass</strong> with oxygen, pyrolysis, hydrogenation and hydrolysis.page: 23
CompositionProcesscalorific value MJ/m 3hydrogencarbon monoxidemethane +carbon dioxidenitrogen +watero<strong>the</strong>r hydrocarbonsfixed bed: oxygen 35 13 12 35 0 0 3• PRME: 10% moisture 9.7 42 34 0 19 2 3• PRME: 20% moisture 9.3 43 29 0 22 2 3Fluidised bed: air 5 - 7 4 - 9 - 16 1 - 5 15 - 16 3• Eisenmann medium 20 n.a. n.a. n.a. n.a. n.a.• Lurgi 7 17 22 4 14 41 1 2• S<strong>to</strong>rk 5 8 11 1 15 10 0• TPS: general 5 8 16 6 15 53 0• TPS: Crève – plant 7 9 9 7 16 56 0Fluidised bed: oxygen 40 - 45 29 - 34 19 - 22 3 0 0 2no examples availableEntrained bed 30 - 35 50 - 70 0 - 1 2 - 15 0 0 1no examples availablePyrolysis based7 - 15 20 - 46 18 - 40 0 - 5 15 - 20 0 0 0-4processes• Batelle/Ferco 7 4 30 4 n.a. n.a. n.a. 1• Brightstar 12 - 15 30 - 40 20 - 30 10 - 15 15 - 20 1 0• EVN 20 18 5 n.a. n.a. n.a.• Gibros PEC 10 46 38 0 14 1 0Table 6: Typical compositions of <strong>the</strong>rmal <strong>gas</strong> production processes3.2.7 Preferred <strong>gas</strong>ification processes for <strong>biomass</strong>It is tempting <strong>to</strong> apply <strong>the</strong> mature and successful coal and lignite <strong>gas</strong>ification technology directly <strong>to</strong><strong>biomass</strong>. Essential differences between coal and <strong>biomass</strong> urge, however <strong>the</strong> development of morespecific <strong>biomass</strong> <strong>gas</strong>ification processes. The first important difference is <strong>the</strong> scale of operation. A 50<strong>to</strong>n/day <strong>biomass</strong> <strong>gas</strong>ifier is already quite large compared <strong>to</strong> <strong>the</strong> locally available supply of <strong>biomass</strong>.A 500 <strong>to</strong>n/day coal <strong>gas</strong>ification plant is still small compared <strong>to</strong> <strong>the</strong> available coal at mining locations.page: 24
A second difference between coal and <strong>biomass</strong> is <strong>the</strong> reactivity. Biomass readily reacts with oxygenat temperatures starting at 600 °C. Coal needs at least 800 - 1200 °C <strong>to</strong> obtain a useful rate ofconversion. Biomass also readily hydrolyses with water. Pyrolysis of <strong>biomass</strong> can also beconducted at moderate temperatures.Newly designed <strong>biomass</strong> <strong>gas</strong>ification plants have a modest size (5 - 50 <strong>to</strong>n/day) and applymoderate temperature and pressure processes. Pyrolysis and hydrogenation improve <strong>the</strong> quality of<strong>the</strong> syn<strong>gas</strong>.Considering <strong>the</strong> addition of <strong>gas</strong> <strong>from</strong> <strong>biomass</strong> <strong>to</strong> <strong>the</strong> <strong>grid</strong>, most attention has <strong>to</strong> be given <strong>to</strong> smallscalehydro-pyrolysis <strong>gas</strong>ifiers. The cleaning and upgrading of <strong>the</strong> rich syn<strong>gas</strong> <strong>from</strong> <strong>the</strong>se reac<strong>to</strong>rsis much easier than <strong>the</strong> utilisation of <strong>the</strong> lean syn<strong>gas</strong> <strong>from</strong> ‘classic’ <strong>gas</strong>ification processes. A recentIGU publication [lit.7] shows that <strong>from</strong> new <strong>biomass</strong> and waste <strong>gas</strong>ification plants fifty utilise classiccoal <strong>gas</strong>ification processes and only seven utilise a pyrolysing reac<strong>to</strong>r.page: 25
4 PIPELINE QUALITY GAS FROM BIOGAS4.1 INTRODUCTIONBio<strong>gas</strong> <strong>from</strong> anaerobic digestion consists primarily of methane (typically 60 - 70%) and carbondioxide. O<strong>the</strong>r components can be oxygen and nitrogen, originating <strong>from</strong> air, sulphur compounds, inparticular hydrogen sulphide and water. In order <strong>to</strong> obtain pipeline quality <strong>gas</strong> <strong>the</strong> bio<strong>gas</strong> must passtwo major processes:• A cleaning process, in which trace components harmful <strong>to</strong> <strong>the</strong> natural <strong>gas</strong> <strong>grid</strong>, appliances orend-users are removed.• An upgrading process, in which <strong>the</strong> calorific value, Wobbe index and o<strong>the</strong>r parameters areadjusted in order <strong>to</strong> meet <strong>the</strong> pipeline specifications.Fur<strong>the</strong>rmore, <strong>the</strong> <strong>gas</strong> must be odorised before it is added <strong>to</strong> <strong>the</strong> natural <strong>gas</strong> <strong>grid</strong>.The relevance and feasibility of <strong>the</strong> different types of cleaning and upgrading processes depends on<strong>the</strong> specific bio<strong>gas</strong> composition, which again is a result of <strong>the</strong> <strong>biomass</strong> feeds<strong>to</strong>ck and <strong>the</strong> digestionprocess. The two major steps are not always <strong>to</strong>tally separated. Some membrane separationprocesses, e.g., do not only remove carbon dioxide <strong>from</strong> <strong>the</strong> methane, but also hydrogen sulphide.This chapter describes processes that are capable of upgrading <strong>the</strong> bio<strong>gas</strong> <strong>to</strong> pipeline quality.However, in some cases <strong>the</strong> upgraded <strong>gas</strong> may not have <strong>to</strong> meet <strong>the</strong> pipeline specificationscompletely. The <strong>gas</strong> quality of <strong>the</strong> mixture of natural <strong>gas</strong> and upgraded <strong>gas</strong> downstream of <strong>the</strong> pointwhere <strong>the</strong> upgraded <strong>gas</strong> enters <strong>the</strong> <strong>gas</strong> <strong>grid</strong> is a function of:• The composition of <strong>the</strong> upgraded <strong>gas</strong>• The composition of <strong>the</strong> natural <strong>gas</strong>• The ratio between <strong>the</strong> flows of natural <strong>gas</strong> and upgraded <strong>gas</strong>If e.g. <strong>the</strong> Wobbe index of <strong>the</strong> natural <strong>gas</strong> is somewhat higher than <strong>the</strong> minimum limit, <strong>the</strong> mixture ofnatural <strong>gas</strong> and upgraded <strong>gas</strong> can meet this specification even if <strong>the</strong> Wobbe index of <strong>the</strong> upgraded<strong>gas</strong> is lower than <strong>the</strong> limit. If lower qualities can be allowed as output <strong>from</strong> <strong>the</strong> upgrading process,<strong>the</strong> efficiency and methane yield of <strong>the</strong> upgrading process can be improved, and <strong>the</strong> investment andoperating costs can be reduced.If bio<strong>gas</strong> is distributed in a closed bio<strong>gas</strong> network or in a <strong>to</strong>wn <strong>gas</strong> network, only <strong>the</strong> cleaning ofbio<strong>gas</strong> is necessary. This option has been demonstrated in Sweden and Denmark. § 4.5 givessome details of this approach.page: 26
4.2 CLEANINGThe main components in bio<strong>gas</strong> are methane and carbon dioxide, normally 90 - 95%. Additionalsubstances can be water, hydrogen sulphide, nitrogen and sometimes oxygen. When bio<strong>gas</strong> isupgraded <strong>to</strong> natural <strong>gas</strong> quality, most of <strong>the</strong>se additional substances have <strong>to</strong> be removed. This canbe done before <strong>the</strong> upgrading process, in <strong>the</strong> upgrading process or after <strong>the</strong> upgrading process.4.2.1 Removal hydrogen sulphideProteins and o<strong>the</strong>r sulphur containing materials produce hydrogen sulphide in <strong>the</strong> digestionprocess. Hydrogen sulphide is poisonous and corrosive, as well as environmentally hazardoussince it is converted <strong>to</strong> sulphur dioxide by combustion. Fur<strong>the</strong>rmore it contaminates some upgradingprocesses. Hydrogen sulphide can be removed ei<strong>the</strong>r in <strong>the</strong> digester, <strong>from</strong> <strong>the</strong> crude bio<strong>gas</strong>, or in<strong>the</strong> upgrading process.In-situ reduction of <strong>the</strong> hydrogen sulphide concentrationHydrogen sulphide can be treated directly in <strong>the</strong> digester vessel. The sulphide is ei<strong>the</strong>r reacted witha metal ion <strong>to</strong> form an insoluble metal sulphide or oxidised <strong>to</strong> elementary sulphur. Iron salts are <strong>the</strong>most used reactants for <strong>the</strong> in-situ reduction of hydrogen sulphide emissions.Iron, in <strong>the</strong> form of Fe 2+ , reacts with sulphide ions <strong>to</strong> form iron sulphide, FeS. The iron ion isnormally supplied as iron chloride, FeCl 2 , which is added <strong>to</strong> <strong>the</strong> digester. Hydrogen sulphide levelsof typically 100 <strong>to</strong> 150 ppm in <strong>the</strong> <strong>gas</strong> stream can be reached with this method.The in-situ removal of hydrogen sulphide is included in <strong>the</strong> turn key bio<strong>gas</strong> plant or installed by <strong>the</strong>plant owner. The investment costs are ra<strong>the</strong>r low since <strong>the</strong> only equipment needed is a dosingsystem. The operational cost for this method depends on <strong>the</strong> amount of hydrogen sulphide that isformed by <strong>the</strong> digestion processes. When using raw materials that are rich in protein and o<strong>the</strong>rsulphur containing molecules, this method is ra<strong>the</strong>r expensive.Plant examplesParameter Unit Process Plant 1 Plant 2 Plant 3 Plant 4Location/nameLinköpingbio<strong>gas</strong>Laholmbio<strong>gas</strong>NSR 2 Kalmarbio<strong>gas</strong>Capacity rangem 3 hydrogen no specificall 100 - 10,000sulphide/yearrangeInput· hydrogen sulphide Ppm500 – 300,000 In situ In situ In situ In situOutput· hydrogen sulphide Ppm50 - 150 50 - 100 100 - 150 15 - 35 115 - 400Process conditionsnormal digesterconditionsDigester40 °CDigester38 °CDigester36 °CDigesterNo temp availTable 7: In-situ reduction of hydrogen sulphide productionpage: 27
Removal of hydrogen sulphide with metal oxides and hydroxidesThe crude bio<strong>gas</strong> can be cleaned <strong>from</strong> hydrogen sulphide by different methods. The most commonmethods are reaction with metal oxides or hydroxides, oxidation with air and adsorption on activatedcarbon.The most commonly used metal compound is iron oxide, but iron hydroxide and zinc oxide can alsobe used. Below is a description of a mixture of iron oxides, with <strong>the</strong> registered trademark SulfaTreat.SulfaTreat is based on a naturally occurring substance, which is processed <strong>to</strong> granules for use inreaction beds.The solid phase is packed in a circular reac<strong>to</strong>r vessel. Bio<strong>gas</strong> is fed in<strong>to</strong> <strong>the</strong> reac<strong>to</strong>r <strong>from</strong> <strong>the</strong> <strong>to</strong>p.The reason for this is that <strong>the</strong> reaction is exo<strong>the</strong>rmic and water is used <strong>to</strong> cool <strong>the</strong> solid bed. With adownstream <strong>gas</strong> flow <strong>the</strong> water is better distributed in <strong>the</strong> bed. The <strong>gas</strong> flow is saturated with waterand excess water is added <strong>to</strong> <strong>the</strong> reaction bed. Reaction temperature is dependent on <strong>the</strong> hydrogensulphide content in <strong>the</strong> bio<strong>gas</strong>. The reaction bed is not heated.With fresh SulfaTreat and moderate concentrations of hydrogen sulphide, all H 2 S is removed <strong>from</strong><strong>the</strong> <strong>gas</strong>. The bed material is consumed by <strong>the</strong> reaction and this results in a rising H 2 S content in <strong>the</strong>outlet stream. If it is important <strong>to</strong> keep <strong>the</strong> H 2 S content in <strong>the</strong> cleaned <strong>gas</strong> <strong>to</strong> virtually zero, <strong>gas</strong>sampling can be done in <strong>the</strong> bed at some distance <strong>from</strong> <strong>the</strong> <strong>gas</strong> outlet. When <strong>the</strong> H 2 S contentincreases in <strong>the</strong> sample, <strong>the</strong> bed material is removed and <strong>the</strong> reac<strong>to</strong>r is recharged with freshmaterial. For completely continuous running, two reac<strong>to</strong>rs can be installed and switched when <strong>the</strong>H 2 S content starts <strong>to</strong> increase.Parameter Unit Process Plant exampleLocation/nameLaholmCapacity range · m 3 bio<strong>gas</strong>/h 0 - 2000· m 3 H 2S/h0 - 5 0 - 0.5Input· hydrogen sulphide Ppm50 - 2500 50 - 3000Output· hydrogen sulphide Ppm0 - 10 0 - 15Process conditions· adsorbtion pressure· adsorption temperature· regeneration pressureSupplierbar (abs)°Cmbar (abs)105030no regenerationSulfaTreat Co. MalmbergWater ABInvestment M€ Included in <strong>the</strong> turn keyupgrading plant. No specificcost is available.Operational costs k€/year 6 3Table 8: Removal of hydrogen sulphide with SulfaTreat23NSR: North West Scania Waste Treatment Co.This includes <strong>the</strong> reacting agent, SulfaTreat, energy costs for compression work and labour costs for recharging <strong>the</strong>absorption reac<strong>to</strong>r.page: 28
Removal of hydrogen sulphide by oxidation with airThe H 2 S content of <strong>the</strong> bio<strong>gas</strong> can be reduced significantly by addition of 5 - 10% air <strong>to</strong> <strong>the</strong> bio<strong>gas</strong>in a cleaning unit after <strong>the</strong> bio<strong>gas</strong> production [lit.9,10,11]. The filter vessel is filled with plasticcarriers and a liquid made up <strong>from</strong> <strong>gas</strong> condensate and liquid <strong>from</strong> effluent slurry separation iscontinuously recirculated over <strong>the</strong> filter. A temperature of approximately 35 °C promotes <strong>the</strong> processin which <strong>the</strong> H 2 S is biologically converted <strong>to</strong> sulphur. The sulphur is retained in <strong>the</strong> liquid in <strong>the</strong> filter.After successful full-scale experiments at <strong>the</strong> Fangel plant in 1993, this method has been utilisedwidely in Danish bio<strong>gas</strong> plants. The utilisation of <strong>the</strong> method is increasing because it is cheaperthan chemical cleaning. The method is also able <strong>to</strong> remove <strong>the</strong> ammonia content of <strong>the</strong> bio<strong>gas</strong>. Withaddition of air in biological filters <strong>the</strong> H 2 S content can be reduced <strong>from</strong> 2000 - 3000 ppm <strong>to</strong> 50 - 100ppm. In o<strong>the</strong>r experiments <strong>the</strong> H 2 S content has been reduced <strong>from</strong> 800 ppm <strong>to</strong> 10 ppm.Limitations:· Aftertreatment might be required <strong>to</strong> obtain pipeline <strong>gas</strong> quality.· The addition of air may conflict with pipeline specifications for oxygen (and nitrogen) content.· The addition of 5 - 10% air might reduce <strong>the</strong> effectiveness or capacity of an upgrading processfollowing <strong>the</strong> H 2 S cleaning.Removal of hydrogen sulphide by adsorption on activated carbonH 2 S can be adsorbed on activated carbon. The sulphur containing carbon can <strong>the</strong>n ei<strong>the</strong>r bereplaced with fresh activated carbon or regenerated.The adsorption of hydrogen sulphide on activated carbon is catalytic and <strong>the</strong> carbon acts ascatalyst. The carbon is often impregnated with potassium iodide (KI) or sulphuric acid (H 2 SO 4 ) <strong>to</strong>increase <strong>the</strong> reaction rate. The chemical reaction is:2H 2 S + O 2 ---> 2S + 2H 2 OOxygen is needed for <strong>the</strong> reaction and is usually added as air. This results in nitrogen being added<strong>to</strong> <strong>the</strong> <strong>gas</strong>, but if <strong>the</strong> H 2 S content is low, only minor amounts of nitrogen will be present in <strong>the</strong>cleaned <strong>gas</strong>.If <strong>the</strong> carbon is regenerated, this is done with hot nitrogen (inert <strong>gas</strong>) or steam. The sulphur will bevaporised and, after cooling, liquify at approximately 130 °C. Regeneration requires two reactionvessels for continuous running. The most common way for utilising activated carbon adsorption iswithout regeneration of <strong>the</strong> carbon.page: 29
Parameter Unit Process Plant exampleLocation/nameNSR pilot plantCapacity rangewith regeneration15without regenerationm 3 bio<strong>gas</strong>/hm 3 hydrogen sulphide/hm 3 bio<strong>gas</strong>/hm 3 hydrogen sulphide/h0 - 50000 - 100 - 10000 - 10Inputhydrogen sulphide Ppm50 - 2000 15-35Outputhydrogen sulphide Ppm10 – 100 0-2Process conditions 4adsorbtion temperatureambientregeneration temperatureSupplier°C°CAmbient400 - 500Table 9: Removal of hydrogen sulphide by adsorption on activated carbonno regenerationNSR4.2.2 Removal of waterRemoval of water by refrigerationThe crude bio<strong>gas</strong> is saturated with water. The absolute amount of water in <strong>the</strong> <strong>gas</strong> depends on <strong>the</strong>temperature. At 35 °C <strong>the</strong> water content is approximately 5%. Water has <strong>to</strong> be removed <strong>from</strong> <strong>the</strong><strong>gas</strong> before it can be fed in<strong>to</strong> <strong>the</strong> <strong>gas</strong> <strong>grid</strong>. The removal of water can be done with different methodsand at various stages in <strong>the</strong> upgrading process, depending on <strong>the</strong> upgrading method. Condensedwater is usually separated <strong>from</strong> <strong>the</strong> <strong>gas</strong> flow before any compressing takes place. With a scrubbingupgrade system no fur<strong>the</strong>r drying of <strong>the</strong> crude <strong>gas</strong> is done. An adsorption upgrade system normallyrequires <strong>the</strong> <strong>gas</strong> <strong>to</strong> be dried before upgrading. The most commonly used drying methods arerefrigeration and adsorption. Absorption with hygroscopic salts can also be used.A common method for <strong>the</strong> drying of <strong>gas</strong> is refrigeration. The <strong>gas</strong> is cooled in heat exchangers and<strong>the</strong> condensed water is separated <strong>from</strong> <strong>the</strong> <strong>gas</strong>. Normally a chiller is utilised for <strong>the</strong> refrigeration.This method can normally only lower <strong>the</strong> dewpoint <strong>to</strong> 0.5 - 1 °C due <strong>to</strong> problems with freezing on <strong>the</strong>heat exchanger surfaces. To achieve lower dewpoints <strong>the</strong> <strong>gas</strong> has <strong>to</strong> be compressed before coolingand <strong>the</strong>n expanded <strong>to</strong> <strong>the</strong> desired pressure.The method can be used for all possible flow rates. The input dewpoint ranges <strong>from</strong> 3 °C <strong>to</strong>saturated. The output dewpoint is 0.5 - 1 °C at actual pressure. There are no specific examples.Thisis a commonly used method with many suppliers.4air added for s<strong>to</strong>ichiometry between oxygen and H 2Spage: 30
Removal of water by adsorptionAdsorption drying means that water is adsorbed on <strong>the</strong> surface of a drying agent. This can be silicagel, aluminium oxide or magnesium oxide for example. The drying agent is packed in containersand <strong>the</strong> moist <strong>gas</strong> is distributed in <strong>the</strong> drying bed. Normally an adsorption drier has two containersthat are switched. One is drying and <strong>the</strong> o<strong>the</strong>r is being regenerated.Regeneration can be performed in two different ways. If <strong>the</strong> drying is performed at elevatedpressure a minor amount (3 - 8%) of <strong>the</strong> dried <strong>gas</strong> can be depressurised and used for regeneration.This <strong>gas</strong> is <strong>the</strong>n recycled <strong>to</strong> <strong>the</strong> compressor inlet which means that <strong>the</strong> net capacity of <strong>the</strong>compressor is lowered. If drying is performed at atmospheric pressure <strong>the</strong> regeneration isperformed with air and a vacuum pump. This method has <strong>the</strong> disadvantage of mixing air in<strong>to</strong> <strong>the</strong><strong>gas</strong> and is <strong>the</strong>refore not well suited for <strong>the</strong> drying of bio<strong>gas</strong>.Parameter Unit Process Plant examplesLocation/name Kristianstad EllingeCapacity range m 3 bio<strong>gas</strong>/h 100 <strong>to</strong> 10,000kg/h1 - 1.5 1 - 1.5Input· dewpoint °C - 20 <strong>to</strong> saturated satured at 10 – 20 satured at 10 - 20Output· dewpoint °C - 30 <strong>to</strong> – 70 -45 <strong>to</strong> –60 -30 <strong>to</strong> -60Process conditions· temperature· pressure°CbarAmbientambient - 260Ambient8 – 10Ambient7 - 10Supplier Malmberg Water AB EllingeTable 10: Removal of water by adsorptionRemoval of water by absorptionWater can be absorbed with e.g. glycol, triethylene glycol or hygroscopic salts. There are manytypes of salt with different absorption properties. Normally <strong>the</strong> drier consists of an absorption vesselfilled with salt granules. The wet <strong>gas</strong> is fed <strong>from</strong> <strong>the</strong> bot<strong>to</strong>m and <strong>the</strong> salt is dissolved as it absorbswater. The saturated salt solution is withdrawn with a valve <strong>from</strong> <strong>the</strong> bot<strong>to</strong>m of <strong>the</strong> vessel. The saltis not regenerated and new salt granules have <strong>to</strong> be added <strong>to</strong> replace <strong>the</strong> dissolved salt.The dewpoint lowering for commercial driers is typically in <strong>the</strong> interval 10 <strong>to</strong> 15 °C depending on <strong>the</strong>salt.page: 31
Parameter Unit Process valueCapacity range m 3 bio<strong>gas</strong>/h 0 - 1000InputGas saturated with water at ambienttemperatureOutput· dewpoint °C 10 - 15 below ambient temperatureProcess conditions· pressure· temperatureSupplierBar°CTable 11: Removal of water by absorptionambientambientVan Air Inc.4.2.3 Removal of o<strong>the</strong>r contaminantsSeveral trace components o<strong>the</strong>r than hydrogen and water might be present in <strong>the</strong> bio<strong>gas</strong> inquantities that call for cleaning in order <strong>to</strong> obtain pipeline quality <strong>gas</strong>. Cleaning processes for someof <strong>the</strong>se substances are well established in <strong>the</strong> bio<strong>gas</strong> sec<strong>to</strong>r, since <strong>the</strong>y must also be removedprior <strong>to</strong> utilisation in e.g. engines and boilers. Pipeline <strong>gas</strong> quality specifications are in general,however, much more stringent than <strong>the</strong> limits for <strong>the</strong>se purposes. The presence and amount ofundesired trace components is highly dependent on <strong>the</strong> raw material for <strong>the</strong> bio<strong>gas</strong> production and<strong>the</strong> production process. Below are <strong>the</strong> most relevant substances <strong>to</strong> consider described <strong>to</strong>ge<strong>the</strong>r withavailable cleaning technologies [lit.12,13,14].ParticlesParticles are common in bio<strong>gas</strong> and must be removed in filters in order <strong>to</strong> obtain pipeline <strong>gas</strong>quality.Halogenated hydrocarbonsHalogenated hydrocarbons, particularly chloro- and fluoro-compounds, are predominantly found inlandfill <strong>gas</strong> and can cause corrosion. They can be removed with impregnated activated carbon. Inthis process small molecules like methane, carbon dioxide, nitrogen and oxygen pass through, whilelarger molecules are adsorbed.Regeneration is carried out by heating <strong>the</strong> activated carbon <strong>to</strong> 200 °C.AmmoniaIn industrial large-scale cleaning processes, ammonia is often removed <strong>from</strong> <strong>the</strong> <strong>gas</strong> by a washingprocess with diluted nitric or sulfuric acid. However, <strong>the</strong> use of such acids requires equipmentconstructed in stainless steel which can be expensive for small-scale applications as bio<strong>gas</strong>cleaning. Ammonia can be removed with activated charcoal units and can also be removed in someupgrading processes, for example adsorption processes and water scrubbing.page: 32
OxygenOxygen is often present in landfill <strong>gas</strong>, originating <strong>from</strong> air extracted <strong>to</strong>ge<strong>the</strong>r with <strong>the</strong> <strong>gas</strong>, but is nota natural component of bio<strong>gas</strong> produced by controlled anaerobic digestion of manure etc. However,oxygen might be present due <strong>to</strong> ei<strong>the</strong>r leaks in <strong>the</strong> production and transport system or because airis supplied <strong>to</strong> <strong>the</strong> bio<strong>gas</strong> in e.g. a hydrogen sulphide cleaning process. In order <strong>to</strong> obtain pipelinequality <strong>gas</strong>, <strong>the</strong> oxygen sources must be controlled and minimised. In some cases <strong>the</strong> upgradingprocess, if e.g. membrane separation or PSA is applied, reduces <strong>the</strong> oxygen content.Organic silicon compoundsOrganic silicon compounds are occasionally present in bio<strong>gas</strong>, and <strong>the</strong>y can cause severe damage<strong>to</strong> <strong>gas</strong> driven engines. They can be removed by absorption in a liquid medium, a mixture ofhydrocarbons with a special ability <strong>to</strong> absorb <strong>the</strong> silicon compounds.Carbon dioxideCarbon dioxide is a major component in <strong>the</strong> raw bio<strong>gas</strong> and <strong>the</strong> vast majority of it will be removed in<strong>the</strong> upgrading process in order <strong>to</strong> raise <strong>the</strong> calorific value, Wobbe index etc., see § 4.3. However,typically traces of carbon dioxide will be present in <strong>the</strong> upgraded <strong>gas</strong>. The pipeline specifications forcarbon dioxide are varying for different <strong>grid</strong>s. In some <strong>grid</strong>s <strong>the</strong> natural <strong>gas</strong> contains severalpercentages carbon dioxide. In case of stringent limits for <strong>the</strong> carbon dioxide content, an upgradingprocess must be chosen that provides high purity methane, and <strong>the</strong>refore only a minor fraction ofcarbon dioxide.4.3 UPGRADING4.3.1 Upgrading and carbon dioxide removalThe upgrading process is basically a separation of <strong>the</strong> methane and carbon dioxide of <strong>the</strong> bio<strong>gas</strong>, inorder <strong>to</strong> obtain pipeline <strong>gas</strong> quality with regards <strong>to</strong> calorific value, Wobbe index, relative density etc.Figure 2 illustrates how <strong>the</strong> Wobbe index is increased and <strong>the</strong> relative density decreases, as <strong>the</strong>methane content of <strong>the</strong> upgraded <strong>gas</strong> is raised (i.e. <strong>the</strong> carbon dioxide content is reduced). A rawbio<strong>gas</strong> composition of 65% methane and 35% carbon dioxide is assumed.page: 33
600.9500.840Wobbe index [MJ/m 3 n]Relative density [-]0.7300.6200.5Carbon dioxide [vol-%]100.400.365 70 75 80 85 90 95 100Methane content in upgraded <strong>gas</strong> [vol-%]Figure 2: Wobbe Index and relative density as function of <strong>the</strong> carbon dioxide concentration inmethane/carbon dioxide mixtures.The following upgrading processes are described:· Membrane separation· Pressure Swing Adsorption (PSA)· Absorption without chemical reaction· Absorption with chemical reaction· Cryogenic removal of carbon dioxide· <strong>Adding</strong> propane (supplementary upgrading)4.3.2 Upgrading by membrane separationThe principle of membrane separation is that some components of <strong>the</strong> raw <strong>gas</strong> are transportedthrough a thin membrane (< 1 mm) while o<strong>the</strong>rs are retained. In practice all components will betransported through <strong>the</strong> membrane in some extent. The transport of each component is driven by<strong>the</strong> difference in partial pressure over <strong>the</strong> membrane and is highly dependent on <strong>the</strong> permeability of<strong>the</strong> component in <strong>the</strong> membrane material. In order <strong>to</strong> obtain high methane purity and recovery, <strong>the</strong>selectivity of <strong>the</strong> membranes, i.e. <strong>the</strong> difference in permeability of methane and carbon dioxiderespectively, must be high. The permeability is a direct function of <strong>the</strong> chemical solubility of <strong>the</strong>target component in <strong>the</strong> membrane.Solid membranes can be constructed as e.g. hollow fibre modules, which give a large membranesurface per volume and hence compact units. Solid membranes can be constructed <strong>from</strong> severalpolymers as e.g. acetate-cellulose. In this material <strong>the</strong> permeability of CO 2 is 20 times higher thanCH 4 , and <strong>the</strong> permeability of H 2 S is 60 times higher than for methane [lit.15,16].page: 34
This means that CO 2 and H 2 S will pass through <strong>the</strong> membrane (fibre wall), while methaneessentially is retained. Since <strong>the</strong> upgraded <strong>gas</strong> with reduced CO 2 content is retained at <strong>the</strong> highpressure side of <strong>the</strong> membrane, it leaves <strong>the</strong> upgrading process at high pressure, which means that<strong>the</strong> need for fur<strong>the</strong>r compression prior <strong>to</strong> its introduction <strong>to</strong> a <strong>gas</strong> <strong>grid</strong> is reduced or eliminated.Typical operating pressures are in <strong>the</strong> range of 25 - 40 bar.The principle of membrane separation constitutes a conflict between high methane purity in <strong>the</strong>upgraded <strong>gas</strong> and high methane yield. The purity of <strong>the</strong> upgraded <strong>gas</strong> can be improved byincreasing <strong>the</strong> size or number of <strong>the</strong> membrane modules, but a larger amount of <strong>the</strong> methane willpermeate through <strong>the</strong> membranes and is <strong>the</strong>refore lost, see figure 3.Figure 3: Relation between methane purity in upgraded <strong>gas</strong> and methane yield withmembrane modules connected in series (no recirculation) [lit.12]For specific methane purity, <strong>the</strong> methane yield can be improved by recirculation of a part of <strong>the</strong>permeated CO 2 -enriched <strong>gas</strong>. In case of several modules connected in series <strong>the</strong> best result isobtained with recirculation of only <strong>the</strong> permeated <strong>gas</strong> <strong>from</strong> <strong>the</strong> last module [lit.12]. Ano<strong>the</strong>r way <strong>to</strong>maximise <strong>the</strong> methane yield and still obtain pipeline quality <strong>gas</strong> is <strong>to</strong> upgrade <strong>the</strong> bio<strong>gas</strong> <strong>to</strong> a lowerquality than required and <strong>the</strong>n add propane in order <strong>to</strong> meet <strong>the</strong> specifications. This solution is alsoadvantageous for <strong>the</strong> process control and <strong>the</strong> investment for <strong>the</strong> required equipment is smallcompared <strong>to</strong> <strong>the</strong> <strong>to</strong>tal investment [lit.15].In liquid membrane systems, a liquid absorbs <strong>the</strong> CO 2 after it has permeated <strong>the</strong> membrane. Thistype of membranes is reported <strong>to</strong> have a very high selectivity and operates at lower pressures(approximately atmospheric) than solid membrane systems [lit.10,16].page: 35
Figure 4 illustrates reported investments for membrane upgrading systems as a function of <strong>the</strong> plantcapacity. Some of <strong>the</strong> figures are budgets while o<strong>the</strong>rs are data <strong>from</strong> realised plants.Since <strong>the</strong> construction of membrane systems is of a modular nature, <strong>the</strong> specific costs perprocessed volume of <strong>gas</strong> is more competitive for smaller units than for larger.Figure 4: Specific investment of membrane upgrading system versus capacity [lit.9,15,17]4.3.3 Upgrading by Pressure Swing AdsorptionPressure Swing Adsorption, or PSA, is a method for <strong>the</strong> separation of carbon dioxide <strong>from</strong> methaneby adsorption/desorption of carbon dioxide on zeolites or activated carbon at different pressurelevels. The adsorption material adsorbs hydrogen sulphide irreversibly and is thus poisoned byhydrogen sulphide. For this reason a hydrogen sulphide removing step is often included in <strong>the</strong> PSAprocess.The PSA process requires dry <strong>gas</strong> and <strong>the</strong> crude bio<strong>gas</strong> is dried before it enters <strong>the</strong> upgradingprocess.The upgrading system consists of four adsorber vessels filled with adsorption material. This materialcan be zeolites <strong>from</strong> carbon for example. During normal operation each adsorber operates in analternating cycle of adsorption, regeneration and pressure build-up. During <strong>the</strong> adsorption phasebio<strong>gas</strong> enters <strong>from</strong> <strong>the</strong> bot<strong>to</strong>m in<strong>to</strong> one of <strong>the</strong> adsorbers. When passing <strong>the</strong> adsorber vessel, carbondioxide, oxygen and nitrogen are adsorbed on <strong>the</strong> adsorbent material surface. The <strong>gas</strong> leaving <strong>the</strong><strong>to</strong>p of <strong>the</strong> adsorber vessel contains > 97% methane.Before <strong>the</strong> adsorbent material is completely saturated with <strong>the</strong> adsorbed feed <strong>gas</strong> components, <strong>the</strong>adsorption phase is s<strong>to</strong>pped and ano<strong>the</strong>r adsorber vessel that has been regenerated is switchedin<strong>to</strong> adsorption mode <strong>to</strong> achieve continuous operation.page: 36
Regeneration of <strong>the</strong> saturated adsorbent material is performed by a stepwise depressurisation of<strong>the</strong> adsorber vessel <strong>to</strong> atmospheric pressure and finally <strong>to</strong> near vacuum conditions. Initially <strong>the</strong>pressure is reduced by a pressure balance with an already regenerated adsorber vessel. This isfollowed by a second depressurisation step <strong>to</strong> almost atmospheric pressure. The <strong>gas</strong> leaving <strong>the</strong>vessel during this step contains significant amounts of methane and is recycled <strong>to</strong> <strong>the</strong> <strong>gas</strong> inlet.Finally, <strong>to</strong> achieve complete regeneration, <strong>the</strong> adsorber vessel is evacuated by a vacuum pump.Before <strong>the</strong> adsorption phase starts again, <strong>the</strong> adsorber vessel is repressurised stepwise <strong>to</strong> <strong>the</strong> finaladsorption pressure. After a pressure balance with an adsorber that has been in adsorption modebefore, <strong>the</strong> final pressure build-up is achieved with feed <strong>gas</strong>.Upgradedbio<strong>gas</strong>AdsorptionDepressuriseDesorptionPressuriseRaw bio<strong>gas</strong>Vent <strong>gas</strong>(CO2)CompressorVacuumpumpFigure 5: Bio<strong>gas</strong> upgrading with PSAPlant examplesParameter Unit Process Plant 1 Plant 2 Plant 3 Plant 4 Plant 5Location/nameNSR(pilot)Göteborg(pilot)Bromma Nuenen VAMWijsterCapacity range m 3 bio<strong>gas</strong>/h 10 – 20 12 -15 2 * 40010,000Input· methane%45 - 7558 - 6260· carbon dioxide %25 - 55 26 - 29 39 - 4139· nitrogen%< 1 0.5 - 1 0.5 - 11· hydrogen sulphide ppm0 - 2 0-2 not startedOutput· methane· carbon dioxide· dewpoint· hydrogen sulphideProcess conditions· adsorption pressure· adsorption temperature· regeneration pressure%%°C at 4 barppmBar°Cmbar (abs)< 2 5 70 - 739733 - 504-550 - 60100 - 20095 - 981 - 4-65 <strong>to</strong> -7006-1030100 - 20095 – 971.5 - 4-40 <strong>to</strong> -4501030100 - 200not startednot startedSupplier GPM Väst GPM Väst Hahnemann CIRMAC CIRMACInvestment M€ no data no data 1.24 6Operational costs k€/year no data no data not startedTable 12: Biomass upgrading with PSA56Excess H 2S (> 2 ppm) removed separatelyHigh pressure system includedpage: 37
4.3.4 Upgrading by absorption of carbon dioxide without chemical reactionRemoval of carbon dioxide by water wash with regenerationCarbon dioxide can be absorbed in a physical absorption process. The carbon dioxide is dissolvedin <strong>the</strong> absorbent without any chemical reaction taking place. Regeneration of <strong>the</strong> solvent is madeei<strong>the</strong>r by flashing (decreased pressure), by heating a combination of both. Water is <strong>the</strong> mostcommonly used solvent for absorbing carbon dioxide <strong>from</strong> bio<strong>gas</strong>. The solubility for carbon dioxidein water increases with increasing pressure. Water can ei<strong>the</strong>r be regenerated and reused forabsorption in a circulation system or used for absorption in a single pass flow.Carbon dioxide is absorbed in water at elevated pressure. Cleaned bio<strong>gas</strong> is compressed and fedin<strong>to</strong> <strong>the</strong> bot<strong>to</strong>m of an absorption column. Water is fed <strong>from</strong> <strong>the</strong> <strong>to</strong>p of <strong>the</strong> column <strong>to</strong> achieve a <strong>gas</strong>liquidcounter flow. The column is equipped with random packing <strong>to</strong> give a large surface for <strong>gas</strong>liquidcontact and internals for <strong>the</strong> collecting and redistribution of water. Carbon dioxide is absorbedby <strong>the</strong> water and <strong>the</strong> <strong>gas</strong> leaving <strong>the</strong> <strong>to</strong>p of <strong>the</strong> column is stripped <strong>from</strong> most of <strong>the</strong> carbon dioxidecontent.Methane is partly soluble in pressurised water and <strong>the</strong>refore some methane will be removed with<strong>the</strong> water. To minimise <strong>the</strong> losses of methane, <strong>the</strong> water is depressurised in a flash tank afterleaving <strong>the</strong> absorption column. The released <strong>gas</strong> mixture is rich in methane and is recirculated <strong>to</strong><strong>the</strong> compressor inlet.Water <strong>from</strong> <strong>the</strong> flash tank is depressurised <strong>to</strong> atmospheric pressure and fed in<strong>to</strong> <strong>the</strong> <strong>to</strong>p of adesorption column. Air is blown <strong>from</strong> <strong>the</strong> bot<strong>to</strong>m of <strong>the</strong> desorption column <strong>to</strong> remove dissolvedcarbon dioxide <strong>from</strong> <strong>the</strong> water. The desorption column is equipped with internals and packing in <strong>the</strong>same way as <strong>the</strong> absorption column. The regenerated liquid is cooled in a heat exchanger <strong>to</strong>maintain <strong>the</strong> absorption temperature and recycled <strong>to</strong> <strong>the</strong> absorption column.The vent <strong>gas</strong> is ei<strong>the</strong>r released <strong>to</strong> <strong>the</strong> atmosphere or treated in some kind of <strong>gas</strong> filter <strong>to</strong> removeodours.Hydrogen sulphide is absorbed <strong>to</strong>ge<strong>the</strong>r with carbon dioxide in <strong>the</strong> absorption column. The solubilityfor hydrogen sulphide in water is ra<strong>the</strong>r high and all hydrogen sulphide cannot be removed in <strong>the</strong>desorption column. Fur<strong>the</strong>rmore, part of <strong>the</strong> hydrogen sulphide is oxidised with air <strong>to</strong> elementarysulphur in <strong>the</strong> desorption column. This sulphur is accumulated in <strong>the</strong> system and can causeproblems with plugging and fouling after some period of operation. It is <strong>the</strong>refore desirable that highcontents of hydrogen sulphide are removed before <strong>the</strong> absorption. The product <strong>gas</strong> is saturated withwater and has <strong>to</strong> be dried.page: 38
Upgraded <strong>gas</strong>Gas dryerWater pumpRaw bio<strong>gas</strong>AbsorptioncolumnCompressorFlashtankFilterBiofilterVent <strong>gas</strong>(CO2)Watersepara<strong>to</strong>rDesorptioncolumnCoolerAirblowerFigure 6: Water wash process <strong>to</strong> reduce carbon dioxyde concentration including regeneration of <strong>the</strong>waterPlant examplesParameter Unit Process Plant 1 Plant 2 Plant 3 Plant 4Location/name Trollhättan Uppsala Linköping KalmarCapacity range m 3 10 - 1000 140 200 660 60 - 70bio<strong>gas</strong>/hInput· methane%45 - 75 60 - 70 63 - 70 68 - 69 64 - 67· carbon dioxide%25 - 55 29 - 39 29 - 36 30 - 32 33 - 36· nitrogen%< 1 no data no data 0 - 0.10· hydrogen sulphideppm< 200 7 no data no data70 100 - 450Output· methane· carbon dioxide· air· dewpoint%%%°CProcess conditions· adsorption pressure Bar· water flow 8· adsorption temperature °C· pressure in flash tank bar· desorption pressure bar> 98< 2< 1.520 - 356 - 1220 - 352 - 5atmospheric12 - 2096 - 971.5 - 21-1006 - 7no datano dataatmosphericno data93 - 972 - 41 - 2.5-807.5no datano dataatmosphericno data96 - 982.30-1< -808 - 8.5no datano dataatmosphericno data94 - 964 - 60 - 1< -308no datano dataatmosphericno datam 3 /hSupplier FEAB FEAB FEAB FEABInvestment M€ no data 0.86 2.5 no dataOperational costs K€/year no data no data no data no dataTable 13: Removal of carbon dioxide using water wash with regeneration78High pressure system includedDepending on <strong>the</strong> absorption pressure and degree of regeneration, for every 100 m 3 /h processed bio<strong>gas</strong>page: 39
Removal of carbon dioxide by water wash without regenerationCarbon dioxide is absorbed in water at elevated pressure. Cleaned bio<strong>gas</strong> is compressed and fedin<strong>to</strong> <strong>the</strong> bot<strong>to</strong>m of an absorption column. Water is fed <strong>from</strong> <strong>the</strong> <strong>to</strong>p of <strong>the</strong> column <strong>to</strong> achieve a <strong>gas</strong>liquidcounter flow. The column is equipped with random packing <strong>to</strong> give a large surface for <strong>gas</strong>liquidcontact and internals for <strong>the</strong> collecting and redistribution of water. Carbon dioxide is absorbedby <strong>the</strong> water and <strong>the</strong> <strong>gas</strong> leaving <strong>the</strong> <strong>to</strong>p of <strong>the</strong> column is stripped <strong>from</strong> most of <strong>the</strong> carbon dioxidecontent.Methane is partly soluble in pressurised water and <strong>the</strong>refore some methane will be removed with<strong>the</strong> water. To minimise <strong>the</strong> losses of methane, <strong>the</strong> water is depressurised in a flash tank afterleaving <strong>the</strong> absorption column. The released <strong>gas</strong> mixture is rich in methane and is recirculated <strong>to</strong><strong>the</strong> compressor inlet.The water used for absorption is not recirculated but used only once. As water source fresh watercan be used, but <strong>the</strong> main feature with this process is <strong>to</strong> utilise ‘cheap’ water, that is water that hasno value and thus does not add <strong>to</strong> <strong>the</strong> operational costs. A typical installation is at a sewage watertreatment plant. Cleaned sewage water is sufficient for use in <strong>the</strong> absorption column. After <strong>the</strong> flashtank <strong>the</strong> water is depressurised by a regula<strong>to</strong>r valve and returned <strong>to</strong> <strong>the</strong> sewage water treatmentsystem.Hydrogen sulphide is absorbed <strong>to</strong>ge<strong>the</strong>r with carbon dioxide in <strong>the</strong> absorption column. The processis not sensitive <strong>to</strong> hydrogen sulphide as <strong>the</strong> dissolved H 2 S is removed with <strong>the</strong> water outlet. Theproduct <strong>gas</strong> is saturated with water and has <strong>to</strong> be dried.Figure 7: Removal of carbon dioxide using water wash without regenerationpage: 40
Plant examplesParameter Unit Process Plant 1 Plant 2 Plant 3Location/name Ellinge Bromma KristianstadCapacity range m 3 10 - 1000 70 55 175bio<strong>gas</strong>/hInput· methane%45 - 75 58 - 60 61 - 6660· carbon dioxide%25 - 55 40 - 42 33 - 3840· nitrogen%< 10 0.4 - 1.60· hydrogen sulphideppm< 1000< 10 < 0.5no dataOutput· methane· carbon dioxide· air· dewpoint%%%°C> 98< 2< 120 - 3596 - 990.5 - 30.8-6096 - 972 - 31-5097 - 981.5 - 20 - 0.5< -20Process conditions· adsorption pressure bar6 - 12 7 - 11228 - 10· water flowm 3 /h 10 - 15 9 8 - 20 5 - 1520 - 25· adsorption temperature °C10 - 25 10 - 25 10-2510 - 25· pressure in flash tank bar2 - 5 no flash tank no data1.5 - 2Supplier Ellinge FEAB Malmberg WaterTable 14: Removal of carbon dioxide using water wash without regenerationRemoval of carbon dioxide using SelexolSelexol is a registered trade mark for a polyglycol e<strong>the</strong>r. The chemical is dissolved in water and hasa very low vapour pressure. This means that <strong>the</strong> losses of chemicals are very low in <strong>the</strong> process.Selexol removes carbon dioxide, hydrogen sulphide and water simultaneously.The selectivity for hydrogen sulphide is very high compared <strong>to</strong> carbon dioxide and regeneration<strong>from</strong> H 2 S requires increased energy input.Carbon dioxide is absorbed in a circulating Selexol solution at elevated pressure. Cleaned bio<strong>gas</strong> iscompressed and fed in<strong>to</strong> <strong>the</strong> bot<strong>to</strong>m of an absorption column. Selexol is fed <strong>from</strong> <strong>the</strong> <strong>to</strong>p of <strong>the</strong>column <strong>to</strong> achieve a <strong>gas</strong>-liquid counter flow. The column is equipped with random packing <strong>to</strong> give alarge surface for <strong>gas</strong>-liquid contact and internals for <strong>the</strong> collecting and redistribution of Selexol.Carbon dioxide is absorbed by <strong>the</strong> Selexol solution and <strong>the</strong> <strong>gas</strong> leaving <strong>the</strong> <strong>to</strong>p of <strong>the</strong> column isstripped <strong>from</strong> most of <strong>the</strong> carbon dioxide content.Methane is partly soluble in pressurised Selexol solution and <strong>the</strong>refore some methane will beremoved with <strong>the</strong> liquid. To minimise <strong>the</strong> losses of methane, <strong>the</strong> Selexol solution is depressurised ina flash tank after leaving <strong>the</strong> absorption column. The released <strong>gas</strong> mixture is rich in methane and isrecirculated <strong>to</strong> <strong>the</strong> compressor inlet.9Depending on <strong>the</strong> absorption pressure, for every 100 m 3 /h processed bio<strong>gas</strong>page: 41
Selexol <strong>from</strong> <strong>the</strong> flash tank is depressurised <strong>to</strong> atmospheric pressure and fed in<strong>to</strong> <strong>the</strong> <strong>to</strong>p of adesorption column. Air is blown <strong>from</strong> <strong>the</strong> bot<strong>to</strong>m of <strong>the</strong> desorption column <strong>to</strong> remove dissolvedcarbon dioxide <strong>from</strong> <strong>the</strong> Selexol solution. The desorption column is equipped with internals andpacking in <strong>the</strong> same way as <strong>the</strong> absorption column. The regenerated liquid is cooled in a heatexchanger <strong>to</strong> maintain <strong>the</strong> absorption temperature and recycled <strong>to</strong> <strong>the</strong> absorption column.The vent <strong>gas</strong> is ei<strong>the</strong>r released <strong>to</strong> <strong>the</strong> atmosphere or treated in some kind of <strong>gas</strong> filter <strong>to</strong> removeodours.Hydrogen sulphide is absorbed <strong>to</strong>ge<strong>the</strong>r with carbon dioxide in <strong>the</strong> absorption column. The solubilityfor H 2 S in Selexol is very high and H 2 S cannot be removed in <strong>the</strong> desorption column. To removeH 2 S <strong>from</strong> a Selexol solution, heating with steam is needed. It is <strong>the</strong>refore desirable that H 2 S isremoved before <strong>the</strong> absorption <strong>to</strong> minimise energy costs. If very large <strong>gas</strong> flows are treated, it canbe economically interesting <strong>to</strong> use Selexol for H 2 S removal. The recovered H 2 S is <strong>the</strong>n processedfur<strong>the</strong>r <strong>to</strong> produce sulphur.The product <strong>gas</strong> has a low water content since Selexol absorbs water. Fur<strong>the</strong>r drying is normally notneeded.Figure 8: Bio<strong>gas</strong> cleaning and upgrading with ‘SulfaTreat’ and ‘Selexol’page: 42
Parameter Unit Process Plant exampleLocation/nameLaholmCapacity range M 3 bio<strong>gas</strong>/h 100 <strong>to</strong> > 10,000 250Input· methane%45 - 7569 - 72· carbon dioxide %25 - 5528 - 31· nitrogen%< 10 - 0.2· hydrogen sulphideppm< 10 10 0 - 15Output· methane· carbon dioxide· air· dewpoint· hydrogen sulphideProcess conditionsAbsorption pressureAbsorption temperaturePressure in flash tankDesorption pressureSelexol flowSupplier%%%°CppmBar°Cbarmbar (abs)m 3 /h> 98< 2< 1.5< -20095 - 982 - 50 - 0.5< -60010 - 127 - 920 - 3572 - 51.5 - 2atmospheric <strong>to</strong> 2009503 - 6 11 10 - 15Malmberg Water ABTable 15: Removal of carbon dioxide using Selexol4.3.5 Removal of carbon dioxide by chemical reactionThis process is based on <strong>the</strong> same principle as <strong>the</strong> absorption processes without chemical reaction,see § 4.3.4. The raw <strong>gas</strong> is led through a liquid, typically at elevated pressure and temperature, and<strong>the</strong> undesired components (e.g. CO 2 , H 2 S) are absorbed in <strong>the</strong> liquid. However, instead of simplydissolving <strong>the</strong>se components, <strong>the</strong> liquid reacts chemically with <strong>the</strong>m and <strong>the</strong>refore drives <strong>the</strong>m in<strong>to</strong>solution.Due <strong>to</strong> absorber costs and <strong>the</strong> disposal of contaminated absorber, <strong>the</strong> absorber is alwaysregenerated, i.e. single pass operation know, <strong>from</strong> water scrubbers are not applied. The process iscontinuous and <strong>the</strong> absorber is regenerated in a reversal chemical reaction in which <strong>the</strong> absorbedCO 2 is released.Table 15 illustrates <strong>the</strong> characteristics of a number of <strong>gas</strong> treatment processes with absorption inchemically reacting absorbers. The alkanolamines MEA, DEA and DGA are examples of absorbers.Several of <strong>the</strong> alkanolamines also absorb a significant amount of <strong>the</strong> water contained in <strong>the</strong> bio<strong>gas</strong>.MEA, that is an organic base in an aqueous solution, is one of <strong>the</strong> most feasible chemicalabsorbers. MEA is often used in <strong>gas</strong> separation processes in e.g. CO 2 production <strong>from</strong> flue <strong>gas</strong>es,cleaning of natural <strong>gas</strong>es, and production of hydrogen and ammonia. It is a colourless, viscous,1011Excess H 2S (> 10 ppm) removed separately <strong>to</strong> reduce energy costsDepending on <strong>the</strong> absorption pressure, for every 100 m 3 /h processed bio<strong>gas</strong>page: 43
poisonous and aggressive liquid with a boiling temperature of 170 °C and a weak smell of ammonia.The MEA process does not remove water, halogenated carbon hydrates or ammonia.The methane yield and methane purity in <strong>the</strong> upgraded <strong>gas</strong> are both close <strong>to</strong> 100%. Chemicalabsorption is more cost competitive for larger plants than for smaller.Process name/AbsorbentOperatingtemperatureOperatingpressure°C BarMethod ofRegenerationStrong and weakassetsAmine-guardMono-ethanol-amine(MEA)SNPA-DEADiethanolamine(DEA)EconamineHydroxyaminoethylesterBenfieldPotassium carbonateCatacarbPotassium carbonateplus amine borate50 High ReboilingLow pressure50 > 34 HeatingLow pressureup <strong>to</strong> 50 > 34 HeatingLow pressurestrong: High efficiency,moderate solvent costweak: High capital cost,corrosive inhibi<strong>to</strong>rs,<strong>to</strong>xic, foaming agentsneededstrong: High efficiencynoncorrosive &nonfoamingweak: High capital andsolvent costsstrong: Moderatecapital and operatingcostsweak: High solventcost,corrosion inhibi<strong>to</strong>rsneeded115 7 - 138 Steamstrong: Low solventcost, high efficiencyweak: High capital cost,corrosion inhibi<strong>to</strong>rsneededFoaming agentsneeded15 - 230 7 - 69 Steamstrong: Low solventcost, high efficiency,non <strong>to</strong>xic additivesweak: High capital cost,corrosion inhibi<strong>to</strong>rs &Foaming agentsneededTable 16: Characteristics of <strong>gas</strong> treatment processes with absorption in chemically reactingabsorbers. None of <strong>the</strong>se processes removes mercaptans [lit.18].page: 44
4.3.6 Cryogenic removal of carbon dioxideCarbon dioxide can be separated <strong>from</strong> methane by cooling <strong>the</strong> <strong>gas</strong> mixture at elevated pressureand removing <strong>the</strong> formed liquid carbon dioxide. This method has been studied as a research projectat <strong>the</strong> Lund Institute of Technology, but is not available as a commercial process.The crude bio<strong>gas</strong> is compressed <strong>to</strong> approximately 80 bar. The compression is made in multiplestages with intercooling. The compressed <strong>gas</strong> is dried <strong>to</strong> avoid freezing in <strong>the</strong> following coolingprocess. The bio<strong>gas</strong> is cooled with chillers and heat exchangers <strong>to</strong> -45 °C. Condensed carbondioxide is removed in a separa<strong>to</strong>r. This carbon dioxide is processed fur<strong>the</strong>r <strong>to</strong> recover dissolvedmethane which is recycled <strong>to</strong> <strong>the</strong> <strong>gas</strong> inlet.The <strong>gas</strong> is cooled fur<strong>the</strong>r <strong>to</strong> approximately -55 °C by heat exchangers. The cold <strong>gas</strong> is expandedthrough a Joule-Thomson nozzle in<strong>to</strong> an expansion vessel. The pressure in <strong>the</strong> vessel is 8-10 barand <strong>the</strong> temperature approximately -110 °C. In <strong>the</strong> expansion vessel a <strong>gas</strong>-solid phase equilibriumis established. The solid phase is frozen carbon dioxide. The <strong>gas</strong> phase, which consists of morethan 97% methane, is heated before it leaves <strong>the</strong> plant (see figure 9).No cost data are available on investment and operational but calculations made in <strong>the</strong> researchproject indicate that <strong>the</strong> costs are comparable with water scrubbing techniques at medium sizeplants. The cryogenic process benefits economically <strong>from</strong> larger plants more than water scrubbingprocesses do. Thus, a large upgrading plant based on cryogenic technique would have a lower costthan <strong>the</strong> same size water scrubbing plant.1412Heat exchanger5Heat exchanger6611J-TnozzleF1B12B23Heat exchanger2Heat exchanger318 19Heat exchanger44KA16KOND 1CO2 outBIOGAS21175F2Bio<strong>gas</strong> inGas drierMETHANEHeat exchanger1KOND 2CO2 outUpgraded <strong>gas</strong> outFigure 9: Cryogenic removal of carbon dioxidepage: 45
Parameter Unit ProcessCapacity range m 3 bio<strong>gas</strong>/h 100 - 20,000Input· methane· carbon dioxyde· nitrogen· hydrogen sulphideOutput· methane· carbon dioxide· dewpointProcess conditions· Pressure after compressing· Pressure after expansion· Condensing temperature%%%ppm%%°C at 8 barbarbar°CTable 17: Cryogenic removal of carbon dioxide45 - 7525 - 55< 1< 5> 97< 3- 110808 - 10- 1104.4 ADDITION OF PROPANEPropane or Liquefied Petroleum Gas (LPG), which is a mixture of propane and butane, has a highcalorific value and Wobbe index. With a typical LPG composition of 70% propane and 30% butane,<strong>the</strong> net calorific value is 102 MJ/m 3 , and <strong>the</strong> gross Wobbe index is 85 MJ/m 3 . Therefore, addition ofLPG <strong>to</strong> <strong>the</strong> bio<strong>gas</strong> will increase <strong>the</strong>se properties for <strong>the</strong> mixture <strong>to</strong>wards <strong>the</strong> specifications ofpipeline quality <strong>gas</strong>.However, addition of large amounts of LPG is a ra<strong>the</strong>r costly upgrading method and it is notpossible <strong>to</strong> obtain typical pipeline specifications by simply adding propane <strong>to</strong> <strong>the</strong> bio<strong>gas</strong>. As anexample, <strong>the</strong> relative density of bio<strong>gas</strong> (65/35% CH 4 /CO 2 ) and LPG is approximately 0.9 and 1.7respectively. Such a high density is outside conventional quality requirements.LPG addition can, however, be used as a supplementary method that can be combined with o<strong>the</strong>rupgrading methods. Following <strong>the</strong> main upgrading process, propane addition can be used <strong>to</strong>regulate <strong>the</strong> <strong>gas</strong> quality <strong>to</strong>wards pipeline quality, and <strong>the</strong>reby compensate for variations in <strong>the</strong>composition of <strong>the</strong> upgraded bio<strong>gas</strong>. The major advantage of supplementary propane addition isthat <strong>the</strong> main upgrading process can operate with lower outlet methane concentrations. For someupgrading processes, e.g. membrane separation, this means that higher efficiencies/methane yieldscan be obtained.The required amount of LPG addition depends on <strong>the</strong> main upgrading process, <strong>the</strong> pipelinespecifications, <strong>the</strong> bio<strong>gas</strong> quality etc. As an example, <strong>the</strong> energy content of <strong>the</strong> estimated LPGaddition in combination with membrane separation corresponds <strong>to</strong> approximately 8% of <strong>the</strong> <strong>to</strong>tal <strong>gas</strong>flow. Table 18 shows some financial data for this propane addition installation at different bio<strong>gas</strong>flows (400 and 1600) [lit.15]. The investment for this corresponds <strong>to</strong> approximately 10% of <strong>the</strong> <strong>to</strong>talinvestment of <strong>the</strong> upgrading plant.page: 46
ParameterUnitBio<strong>gas</strong> flow (raw <strong>gas</strong>) m 3 /h 400 1,600Production of upgraded <strong>gas</strong> 10 6 m 3 /year 1.98 7.91LPG consumption 1000160 640litre/yearLPG costs k€/year 36 145Investment, propane addition k€ 17 36Investment, propane s<strong>to</strong>rage k€ 23 45Total investment k€ 39 81Table 18:Estimated investments and LPG consumption for LPG addition plant combined withmembrane separation [lit.15]4.5 ADAPTION TO NON NATURAL GAS GRIDSIt is not always necessary <strong>to</strong> upgrade <strong>the</strong> bio<strong>gas</strong> in order <strong>to</strong> distribute it on a <strong>grid</strong>. In Revninge (DK)and Go<strong>the</strong>nburg (S) bio<strong>gas</strong>es are adapted for use in <strong>grid</strong>s separated <strong>from</strong> <strong>the</strong> natural <strong>gas</strong>.RevningeThe bio<strong>gas</strong> plant at Revninge started operating in 1990, and supplies 67 households in Revninge.For back up or for adjustment of <strong>the</strong> <strong>gas</strong> quality a mixture of natural <strong>gas</strong> and air can also supply <strong>the</strong>small network which is isolated <strong>from</strong> <strong>the</strong> natural <strong>gas</strong> network. An evaluation of <strong>the</strong> domestic boilersin Revninge in 1994 showed some minor corrosion problems, but <strong>the</strong> concept is in generalpromising.Instead of bio<strong>gas</strong> upgrading and supply of bio<strong>gas</strong> <strong>to</strong> <strong>the</strong> natural <strong>gas</strong> network, <strong>the</strong> Revninge conceptcould be a model for smaller parts of <strong>the</strong> natural <strong>gas</strong> network. For safety reasons only minorvariations of <strong>the</strong> Wobbe index can be accepted when supplying households. For separate bio<strong>gas</strong>networks backup supply <strong>from</strong> natural <strong>gas</strong> or propane/butane is recommended.Go<strong>the</strong>nburgIn Go<strong>the</strong>nburg, Sweden, ano<strong>the</strong>r solution has been chosen. Go<strong>the</strong>nburg has an old distributionsystem for <strong>to</strong>wn <strong>gas</strong> and a mixture of natural <strong>gas</strong> and air is now being distributed on this <strong>grid</strong>. Themixture is 47% natural <strong>gas</strong> and 53% air, resulting in a product with a Wobbe number similar <strong>to</strong> <strong>the</strong>old <strong>to</strong>wn <strong>gas</strong> that was manufactured <strong>from</strong> reforming of butane. The maximum load on this system isaround 3000 m 3 /h. Bio<strong>gas</strong> in Go<strong>the</strong>nburg is produced in <strong>the</strong> local treatment plant for sewage waterand is presently being used for <strong>the</strong> combined production of heat and power in a number of <strong>gas</strong>engines at <strong>the</strong> water treatment plant. Part of <strong>the</strong> bio<strong>gas</strong> is compressed, cooled and transferred <strong>to</strong><strong>the</strong> old <strong>to</strong>wn <strong>gas</strong> plant, where now <strong>the</strong> mixture of natural <strong>gas</strong> and air is introduced in <strong>the</strong> <strong>to</strong>wn <strong>gas</strong><strong>grid</strong>.The bio<strong>gas</strong> system has a maximum capacity of 300 m 3 /h and <strong>the</strong> maximum amount of bio<strong>gas</strong> that isintroduced in<strong>to</strong> <strong>the</strong> <strong>grid</strong> is limited <strong>to</strong> 30%, a figure based on tests performed with different kind of<strong>gas</strong> equipment presently used in <strong>the</strong> <strong>to</strong>wn <strong>gas</strong> system. Appropriate quality of <strong>the</strong> <strong>gas</strong> on <strong>the</strong> <strong>to</strong>wnpage: 47
<strong>gas</strong> system is maintained by a control system where first natural <strong>gas</strong> and air is mixed <strong>to</strong> a specifiedWobbe number and <strong>the</strong>n <strong>the</strong> resulting mixture is blended with a bio<strong>gas</strong> that has been adjusted <strong>to</strong> aspecified heating value. This procedure maintains a stable <strong>gas</strong> quality on <strong>the</strong> <strong>to</strong>wn <strong>gas</strong> system and<strong>the</strong>reby ascertains a safe and stable operation of <strong>the</strong> equipment connected <strong>to</strong> <strong>the</strong> <strong>grid</strong>.4.6 ODORISATIONThe <strong>gas</strong> in <strong>the</strong> distribution <strong>grid</strong> must be odorised in order <strong>to</strong> ensure that it will be detected in case of<strong>gas</strong> leaks. If <strong>the</strong> upgraded <strong>gas</strong> is delivered <strong>to</strong> <strong>the</strong> <strong>grid</strong> close <strong>to</strong> <strong>the</strong> location where <strong>the</strong> natural <strong>gas</strong> isodorised, <strong>the</strong>n this odorising can in principle be adjusted <strong>to</strong> take in<strong>to</strong> account <strong>the</strong> increased volumeof <strong>gas</strong> originating <strong>from</strong> <strong>the</strong> upgrading plant. However, in general <strong>the</strong> upgraded <strong>gas</strong> must be odorisedbefore it is supplied <strong>to</strong> <strong>the</strong> <strong>grid</strong>.Typical compounds used for odorising are tetrahydrotiophen (THT) and mercaptans. Theconcentrations are in <strong>the</strong> range 5 - 30 mg/m 3 .VariableUnitBio<strong>gas</strong> flow (raw <strong>gas</strong>) M 3 /h 400 1600Unit for Pressure Swing Adsorption plant k€ 17 17Unit for membrane separation plant k€ 3 9Table 19: Estimated prices for odorising equipment for upgrading plants at different bio<strong>gas</strong> flows[lit.15]Laholm (Sweden) plant interior and exterior, see page 27 and fur<strong>the</strong>rpage: 48
5 PIPELINE QUALITY GAS FROM SYNGAS5.1 PROCESS LAYOUTFigure 10 gives an example of a process <strong>to</strong> convert syn<strong>gas</strong> <strong>from</strong> <strong>biomass</strong> <strong>to</strong> pipeline quality <strong>gas</strong>.The main process steps after <strong>gas</strong>ification are cleaning, conversion and upgrading. The bordersbetween <strong>gas</strong>ification, cleaning, conversion and upgrading are arbitrary. The cleaning step removescontaminants <strong>from</strong> <strong>the</strong> syn<strong>gas</strong>, <strong>the</strong> conversion process converts carbon monoxide <strong>to</strong> methane and<strong>the</strong> upgrading step removes carbon dioxide and nitrogen as far as necessary <strong>to</strong> reach pipeline <strong>gas</strong>quality. Sometimes propane is added in <strong>the</strong> upgrading step <strong>to</strong> increase <strong>the</strong> calorific value. If <strong>the</strong> <strong>gas</strong>is supplied <strong>to</strong> a distribution <strong>grid</strong> also an odorant is added <strong>to</strong> ensure sufficient perceptibility of <strong>the</strong><strong>gas</strong>. A thorough and highly generalised discussion on syn<strong>gas</strong> treatment is given in <strong>the</strong> Ullmann’sEncyclopaedia of Industrial Chemistry [lit.19]. A detailed example of <strong>the</strong> production of pipelinequality <strong>gas</strong> <strong>from</strong> syn<strong>gas</strong> <strong>from</strong> <strong>biomass</strong> is given in a confidential Gastec report [lit.20]. The basic datafor this process are given in table 20.Unit Pipelinequality <strong>gas</strong>productioninstalled capacity MW 19efficiency pipeline quality <strong>gas</strong> production % 79investment (excluding syn<strong>gas</strong> production) M€ 5specific investment pipeline quality <strong>gas</strong>production€/kWg 260Table 20: Basic data for a syn<strong>gas</strong> <strong>to</strong> pipeline quality <strong>gas</strong> conversion plant. The plant capacity is 24MW syn<strong>gas</strong>, and includes a syn<strong>gas</strong> cleaning train, methanising reac<strong>to</strong>r and a pressureswing absorption carbon dioxide removal step.<strong>gas</strong> productioncleaningconversionupgradingcyclone IIfiltercyclone ISremovalCO conversionCO2removal<strong>to</strong> <strong>grid</strong><strong>biomass</strong>recyclingwaterpropaneodoran<strong>to</strong>xygen/airoptionalash/wasteash/wasteFigure 10: The schematic route <strong>to</strong> produce pipeline quality <strong>gas</strong> <strong>from</strong> syn<strong>gas</strong> <strong>from</strong> <strong>biomass</strong>page: 49
In <strong>the</strong> <strong>gas</strong>ification process <strong>the</strong> first degradation stage is often followed by an additional hightemperature <strong>gas</strong>ification stage for <strong>the</strong> conversion of remaining tars and carbon rich solids <strong>to</strong> <strong>gas</strong>esand carbon free ash. This essential clean up is generally considered as a part of <strong>the</strong> <strong>gas</strong>ificationprocess. Also <strong>the</strong> first cyclone <strong>to</strong> separate <strong>the</strong> <strong>gas</strong> and solids is often designed as a part of <strong>the</strong><strong>gas</strong>ifier.Syn<strong>gas</strong> cleaning starts with an already relatively clean syn<strong>the</strong>sis <strong>gas</strong> with a low amount ofaccompanying liquids and solids. The cleaning train consists of a sequence of cleaning units, eachunit removing some of <strong>the</strong> contaminating components.The general lay out is <strong>to</strong> cool down <strong>the</strong> raw syn<strong>gas</strong> and <strong>to</strong> remove <strong>the</strong> bulk of <strong>the</strong> entrained solidsand liquids with a cyclone, a filter removes remaining solids (solid and liquid separation). The nextstep is <strong>to</strong> remove, when necessary, <strong>the</strong> sulphurous components (desulphurisation).The clean syn<strong>gas</strong> is used for heat and power production. The clean syn<strong>gas</strong> is also used for <strong>the</strong>conversion <strong>to</strong> higher value chemicals, as for example, methanol. Conversion of syn<strong>gas</strong> <strong>to</strong> methanemakes it possible <strong>to</strong> produce a pipeline quality <strong>gas</strong>. This process is widely studied anddemonstrated and is considered as mature. Due <strong>to</strong> <strong>the</strong> abundant and low cost availability of natural<strong>gas</strong> <strong>the</strong>re are currently however no commercial pipeline quality <strong>gas</strong> production plants.A recent study by Gastec [lit.21] compares <strong>the</strong> production of power and pipeline quality <strong>gas</strong> <strong>from</strong>syn<strong>gas</strong>. A projected <strong>the</strong>rmal <strong>biomass</strong> <strong>gas</strong>ification unit produces 70 MWth of clean syn<strong>gas</strong> at nearlyatmospheric pressure. In this specific case 50% of <strong>the</strong> syn<strong>gas</strong> was obtained <strong>from</strong> <strong>biomass</strong> and <strong>the</strong>remaining was obtained <strong>from</strong> (fossil derived) organic wastes. Four potential roads for <strong>the</strong> final use of<strong>the</strong> syn<strong>gas</strong> were compared:• production of power by a steam turbine• production of power by a <strong>gas</strong> turbine• production of power by combined cycle system• production of pipeline quality <strong>gas</strong> for delivery at 40 bar <strong>to</strong> <strong>the</strong> <strong>gas</strong> transport <strong>grid</strong>Table 21 summarises some of <strong>the</strong> results of this study.page: 50
SteamturbineGasturbineCombinedcyclePipelinequality<strong>gas</strong>productioninstalled capacity MW 19 22 29 54Efficiency power production % 27 32 42 n.a.Efficiency pipeline quality <strong>gas</strong> production % Na na Na 78Investment (excluding syn<strong>gas</strong> production) M€ 15 17 22 8specific investment power production €/kWe 810 770 750 n.a.specific investment pipeline quality <strong>gas</strong> €/kWg n.a. n.a. n.a. 140productionavoided emission of fossil carbon dioxide k<strong>to</strong>n/y 20 17 26 32Table 21:Results <strong>from</strong> a case study on syn<strong>gas</strong> utilisation for energy production. Data are based on70 MW (<strong>the</strong>rmal) syn<strong>gas</strong> input. 50% of <strong>the</strong> syn<strong>gas</strong> was obtained <strong>from</strong> non-fossil carbon.5.2 CLEANINGThe cleaning of <strong>the</strong> syn<strong>gas</strong> prior <strong>to</strong> fur<strong>the</strong>r use is of great importance <strong>to</strong> <strong>the</strong> success of <strong>the</strong> project.Engines for <strong>the</strong> production of power need a clean <strong>gas</strong> <strong>to</strong> function properly at low maintenance costs.A catalytic conversion unit also needs a clean <strong>gas</strong>, but also requires input free of sulphur andhalogen containing components. In addition current environmental standards require a nearcomplete removal of all polluting components.The design and dimensioning of <strong>the</strong> cleaning process depends on <strong>the</strong> nature of <strong>the</strong> <strong>gas</strong>ificationprocess and <strong>the</strong> quality of <strong>the</strong> feed. Some <strong>gas</strong>ification processes leave considerable amounts oftars and carboneous solid in <strong>the</strong>ir products <strong>gas</strong>. By incorporating a high temperature in <strong>the</strong> finalstage of <strong>the</strong> <strong>gas</strong>ification <strong>the</strong>se components can be removed nearly completely. Feeds containinglarge amounts of sulphur or trace elements should be avoided, or be processed in dedicatedinstallations.5.2.1 Solid and liquid separationThe solid and liquid separation has <strong>to</strong> be designed <strong>to</strong> <strong>the</strong> size and nature of <strong>the</strong> process. Solidwaste is <strong>to</strong> be separated. Disposal of <strong>the</strong>se solids needs attention. Often some stabilisation of <strong>the</strong>ashes is needed <strong>to</strong> reach <strong>the</strong> requirements for fur<strong>the</strong>r use or disposal. Only in a few cases <strong>the</strong>sematerials can be used directly as fertiliser or as landfill material.5.2.2 DesulphurisationThere is an infinite number of desulphurisation processes. From <strong>the</strong>se, two are generally applied <strong>to</strong>remove sulphurous components <strong>from</strong> <strong>the</strong> syn<strong>gas</strong> obtained <strong>from</strong> <strong>biomass</strong>. Both are simpleabsorption processes <strong>to</strong> be applied <strong>to</strong> small streams of ra<strong>the</strong>r clean syn<strong>gas</strong>. One of <strong>the</strong> processesuses iron containing active carbon. In this process <strong>the</strong> product <strong>gas</strong> will still contain some traces ofsulphurous components. In most situations 1 mg/m 3 is quite acceptable and easily reached.page: 51
A catalytic process requires a feed with an even lower sulphur concentration. In <strong>the</strong>se cases zincoxide (ZnO) is applied operating at 200 - 350 °C. Zinc oxide removes traces of sulphur <strong>to</strong>concentrations down <strong>to</strong> 100 ppb or even lower. Zinc oxide also removes halogen compounds. Athigh chloride concentrations and higher temperatures some of <strong>the</strong> formed zinc chloride canevaporate and move <strong>to</strong> <strong>the</strong> following process step. A second adsorption layer based on activatedaluminium oxide (‘alumina’) unit can absorb <strong>the</strong> volatile halogen components.In both processes <strong>the</strong> design usually aims at a replacement time of at least once per year. The usedactive carbon or zinc oxide reagents are <strong>to</strong> be treated as chemical waste.5.3 CONVERSION AND UPGRADINGThe cleaned syn<strong>gas</strong> will generally contain <strong>to</strong>o much carbon monoxide and will also have a low ormedium calorific value. By a chemical conversion <strong>the</strong> carbon monoxide is converted <strong>to</strong> methane(‘conversion’). In a sequencing step non-combustible <strong>gas</strong>es are removed <strong>to</strong> leave a clean, highcalorific fuel <strong>gas</strong>. Optional is <strong>the</strong> addition of propane and odorant <strong>to</strong> bring <strong>the</strong> product <strong>gas</strong> <strong>to</strong> <strong>grid</strong>specifications (‘upgrading’). The addition of propane is often referred <strong>to</strong> as ‘carburisation’.ConversionConversion is <strong>the</strong> process step <strong>to</strong> remove most of <strong>the</strong> carbon monoxide. Both hydrogen and watercan react with carbon monoxide <strong>to</strong> methane. This process can be described by <strong>the</strong> equilibriumreactions:• <strong>the</strong> reaction of carbon monoxide with hydrogen <strong>to</strong> give methane and water (’shift’)CO + 3H 2 CH 4 + H 2 O• <strong>the</strong> reaction of carbon monoxide with water <strong>to</strong> give methane and carbon dioxide (’methanation’)CO + 2H 2 O CH 4 + CO 2These equilibriums will have <strong>the</strong> maximum yield of methane at low temperatures. At temperatures <strong>to</strong>300 °C a 99% conversion or better will be reached. High pressures, up <strong>to</strong> 100 bar, can improve <strong>the</strong>conversion at higher temperatures. The shift and methanation reactions are slow at reactiontemperatures. To ensure a sufficient rate of <strong>the</strong> reactions a nickel based catalyst is used. Acomplication in <strong>the</strong>se reactions is <strong>the</strong> deposition of carbon on <strong>the</strong> catalyst. This can be suppressedby increasing <strong>the</strong> amount of water in <strong>the</strong> feed. Some new catalysts are claimed <strong>to</strong> be resistant <strong>to</strong>carbon deposition.page: 52
Ano<strong>the</strong>r problem is <strong>the</strong> potential formation of nickel and iron carbonyl components.These components are formed by <strong>the</strong> reaction of iron or nickel with carbon monoxide. This reactiontakes place at temperatures below 300 °C. Iron and nickel carbonyl are highly <strong>to</strong>xic volatilecomponents. Reac<strong>to</strong>r construction materials will lose <strong>the</strong>ir strength when subjected <strong>to</strong> carbonylformation. A careful reac<strong>to</strong>r design, in process temperature selection, material selection andreactant <strong>gas</strong> composition is essential.This conversion reaction is highly exo<strong>the</strong>rmic. Unless <strong>the</strong> heat can find a useful application, anenergy loss of 20 - 30% occurs. To allow cooling of <strong>the</strong> reac<strong>to</strong>r <strong>the</strong> carbon monoxide conversion isperformed in a tube reac<strong>to</strong>r. The quality of <strong>the</strong> feed <strong>gas</strong> and <strong>the</strong> quality requirements of <strong>the</strong> product<strong>gas</strong> largely determine <strong>the</strong> operating conditions. Pressure ranges between 3 - 20 bars andtemperature ranges between 250 and 400 °C. The resulting <strong>gas</strong> mainly consists of methane, carbondioxide and nitrogen. The produced heat can be used for electricity production. Waste heat canoften be applied for drying of <strong>the</strong> (wet <strong>biomass</strong>) feed. Some proposed processes use <strong>the</strong> generatedheat <strong>to</strong> facilitate <strong>the</strong> <strong>the</strong>rmal <strong>gas</strong>ification.UpgradingThe conversion of carbon monoxide <strong>to</strong> methane generates a surplus of carbon dioxide. Chapter 4 ofthis report describes <strong>the</strong> processes <strong>to</strong> remove <strong>the</strong> carbon dioxide <strong>from</strong> a <strong>gas</strong>. The capacity and <strong>the</strong>composition of <strong>the</strong> incoming <strong>gas</strong> mainly determine <strong>the</strong> selection and dimensioning of <strong>the</strong> process.The amount and composition of <strong>the</strong> non-combustible fraction in <strong>the</strong> feed depends on <strong>the</strong> <strong>gas</strong>ificationprocess selected and, <strong>to</strong> a much smaller extent, on <strong>the</strong> nature of <strong>the</strong> <strong>biomass</strong> feed.Carbon dioxide is much easier removed than nitrogen and argon, which are also often present inraw bio<strong>gas</strong>. The upgrading process requires a pyrolysis based <strong>gas</strong>ification process. Additional<strong>gas</strong>ification is mainly obtained by water as <strong>the</strong> reactive agent. The additionally needed oxygenshould be provided by an air separa<strong>to</strong>r, minimising <strong>the</strong> intrusion of nitrogen.Proven technologies are:• pressure swing adsorption,• <strong>gas</strong>eous membrane separation• liquid washDetailed engineering has <strong>to</strong> provide <strong>the</strong> optimal choice in <strong>the</strong>se technologies.Carburation and odorisationWithout carburation with propane most processes will allow <strong>the</strong> production of a low calorific natural<strong>gas</strong> quality. The production of high calorific natural <strong>gas</strong> quality will often require <strong>the</strong> addition of asmall amount of propane <strong>to</strong> reach <strong>the</strong> required high calorific value. Odorisation is only required if <strong>the</strong><strong>gas</strong> in <strong>the</strong> <strong>grid</strong> is <strong>to</strong> be odorised.page: 53
In all countries <strong>gas</strong> in a distribution <strong>grid</strong> (low-pressure <strong>grid</strong>) has <strong>to</strong> be odorised. With someexceptions, <strong>the</strong> <strong>gas</strong> in a transport <strong>grid</strong> (high pressure) is not odorised.The addition of propane and odorant are simple low cost process steps. The propane additionrequires a feed back control loop <strong>to</strong> maintain <strong>the</strong> Wobbe number within <strong>the</strong> local contractual limits.The measurement equipment in this control system can also provide data on <strong>the</strong> delivered calorificvalue of <strong>the</strong> <strong>gas</strong>. § 4.4 describes <strong>the</strong> addition of propane.The addition of <strong>the</strong> odorant requires a flow proportional dosing system. Even simple odorisationequipment performs quite well. § 4.6 describes <strong>the</strong> addition of <strong>the</strong> odorant.5.4 PROCESS INTEGRATIONThe production of pipeline quality <strong>gas</strong> <strong>from</strong> syn<strong>gas</strong> only needs proven technology in astraightforward process using basic process equipment at moderate pressure and temperatureconditions. The combination of <strong>gas</strong>ification of <strong>biomass</strong> and <strong>the</strong> production of pipeline quality <strong>gas</strong> isnew and requires an integral concept. This concept may use:• <strong>gas</strong>ification of <strong>biomass</strong> with water as main reagent• oxygen (not air) as additional reagent• recovery in <strong>the</strong> balance of plant of <strong>the</strong> heat evolved in <strong>the</strong> <strong>gas</strong>ification step in <strong>the</strong> methanation.All <strong>the</strong> pyrolysis processes (appendix 2: Batelle/Ferco, Brightstar, EVN, Gibros, Noell, Thermoselectand Thermogenics) meet <strong>the</strong>se requirements fairly well. Table 22 gives a survey of <strong>the</strong> impact of <strong>the</strong>conversion and upgrading steps.WaterCleanSyn<strong>gas</strong>ConversionConverted syn<strong>gas</strong>Removalcarbon dioxidepipelinequality<strong>gas</strong>carbon dioxideFigure 11: Schematic process flow diagram for <strong>the</strong> production of pipeline quality <strong>gas</strong> <strong>from</strong> cleansyn<strong>gas</strong> originating <strong>from</strong> pyrolysis based processespage: 54
Componentflow andcompositionclean syn<strong>gas</strong>flowwaterflow andcompositionconvertedsyn<strong>gas</strong>flowremovedcarbondioxideflow andcompositionpipelinequality <strong>gas</strong>mol % mol % mol % mol % mol %carbon monoxide 30 30 - - - - - - - -Hydrogen 36 36 - - - - - - - -Methane 13 13 - - 29 45 - - 29 97carbon dioxide 20 20 - - 34 53 34 100 - -Nitrogen 1 1 - - 1 2 - - 1 3Water - - 9 100 - - - - - -net calorific value MJ/m 3 14 0 18 0 39relative volume 333 30 213 113 100heat content 466 0 383 0 390Table 22:Schematic calculation example of <strong>the</strong> conversion and upgrading of syn<strong>gas</strong> <strong>to</strong> pipelinequality <strong>gas</strong> by a pyrolysis processIn this schematic approach 84% of <strong>the</strong> energy in <strong>the</strong> clean syn<strong>gas</strong> is retained in <strong>the</strong> pipeline quality<strong>gas</strong>. In practice <strong>the</strong> efficiency will be a bit lower because of <strong>the</strong> need for compression of <strong>the</strong> <strong>gas</strong>esand <strong>the</strong> losses due <strong>to</strong> incomplete separation of carbon dioxide. As mentioned earlier, <strong>the</strong> heatevolved in <strong>the</strong> conversion reac<strong>to</strong>r may be used for drying of <strong>the</strong> <strong>biomass</strong> feed.The pyrolysis has an efficiency of at least 95%. This results in a <strong>to</strong>tal efficiency for <strong>the</strong> production ofpipeline quality <strong>gas</strong> <strong>from</strong> <strong>biomass</strong> of 80%. By lack of demonstration processes this efficiency is notproven in practice.page: 55
6 SUPPLYING GAS FROM BIOMASS TO THE GAS GRID6.1 GAS QUALITY ASPECTS6.1.1 ‘Off-spec’ and ‘on-spec’ <strong>gas</strong>esWhen bio<strong>gas</strong> is added <strong>to</strong> <strong>the</strong> <strong>gas</strong> <strong>grid</strong>, <strong>the</strong> resulting <strong>gas</strong> quality in <strong>the</strong> <strong>grid</strong> has <strong>to</strong> meet <strong>the</strong> localquality requirements. Essentially <strong>the</strong>re are two approaches. One approach is that <strong>the</strong> input <strong>gas</strong>already meets <strong>the</strong> local quality requirements. This is <strong>the</strong> addition of ‘on-spec’ <strong>gas</strong>. The o<strong>the</strong>rapproach is <strong>to</strong> arrange that <strong>the</strong> resulting, downstream, mixture meets <strong>the</strong> local quality requirements.This is <strong>the</strong> addition of ‘off-spec’ <strong>gas</strong>. The addition of on-spec <strong>gas</strong> is generally well accepted. Theaddition of off-spec <strong>gas</strong> often finds considerable resistance. End-users tend <strong>to</strong> question <strong>the</strong> qualityof <strong>the</strong> delivered <strong>gas</strong>. The mixing also requires an adequate feedback measuring and control system<strong>to</strong> compensate for flow and quality compositions in <strong>the</strong> up stream <strong>gas</strong> in <strong>the</strong> <strong>grid</strong> and <strong>the</strong> off-spec<strong>gas</strong> <strong>from</strong> <strong>biomass</strong>. Only for large flows of off-spec <strong>gas</strong>es, mixing <strong>to</strong> pipeline quality <strong>gas</strong> is a viabletechnology. Table 23 gives a survey of <strong>the</strong> strong and weak points of mixing in on-spec and off-spec<strong>gas</strong>.Mixing <strong>gas</strong>es <strong>from</strong> <strong>biomass</strong> <strong>to</strong> <strong>the</strong> <strong>gas</strong> <strong>grid</strong>Aspect On-spec <strong>gas</strong> Off-spec <strong>gas</strong>Reliability high lowFlexibility high lowCost at production high lowCost of mixing low highAcceptance high lowTable 23: Addition of on-spec and off-spec <strong>gas</strong>Both methods are being applied. In Germany <strong>the</strong>re is large experience with adding off-spec <strong>gas</strong>esusing <strong>to</strong>wn <strong>gas</strong> (carbon monoxide and hydrogen rich <strong>gas</strong>es) <strong>to</strong> <strong>the</strong> natural <strong>gas</strong> <strong>grid</strong>. In <strong>the</strong>Ne<strong>the</strong>rlands large-scale plants mix off-spec natural <strong>gas</strong>es for <strong>the</strong> production of distribution quality<strong>gas</strong>.In <strong>the</strong> Ne<strong>the</strong>rlands large quantities of landfill <strong>gas</strong> are converted <strong>to</strong> on-spec <strong>gas</strong>es before <strong>the</strong>y aredelivered <strong>to</strong> <strong>the</strong> <strong>gas</strong> <strong>grid</strong>.Distribution quality <strong>gas</strong>Both methods for adding <strong>gas</strong>es <strong>to</strong> <strong>the</strong> <strong>grid</strong> require a complete set of specifications for <strong>the</strong> <strong>grid</strong> <strong>gas</strong>quality. The requirements for <strong>the</strong> combustion properties and <strong>the</strong> compositional properties arerelated <strong>to</strong> <strong>the</strong> bulk components of <strong>the</strong> <strong>gas</strong>. The transport and environmental requirements arerelated <strong>to</strong> <strong>the</strong> minor components in <strong>the</strong> <strong>gas</strong>. There is a large worldwide consensus of <strong>the</strong> <strong>gas</strong>quality, partly formalised and partly informal, often exceeding <strong>the</strong> formal regulations.page: 56
For this report <strong>the</strong> terminology ‘pipeline quality <strong>gas</strong>’ will be used throughout <strong>to</strong> indicate a <strong>gas</strong>produced <strong>from</strong> <strong>biomass</strong> that meets <strong>the</strong> de-fac<strong>to</strong> accepted local standards for natural <strong>gas</strong>es.Except for <strong>the</strong> Wobbe number <strong>the</strong> de-fac<strong>to</strong> quality standard for all natural <strong>gas</strong>es, and <strong>the</strong>irsubstitutes, is <strong>the</strong> same. This standard is most completely described in <strong>the</strong> German publications by<strong>the</strong> Deutsche Vereinigung des Gas- und Wasserfaches (DVGW) on ’Gasbeschaffenheit’[lit.22,23,24]. These publications describe not only natural <strong>gas</strong>es, but also all <strong>gas</strong>es that can replacenatural <strong>gas</strong>. Examples of <strong>the</strong>se <strong>gas</strong>es are syn<strong>the</strong>tic natural <strong>gas</strong>, propane/air mixtures, propaneenriched<strong>gas</strong>es, addition of flue <strong>gas</strong>es for calorific value mitigation and <strong>gas</strong> <strong>from</strong> coal <strong>gas</strong>ification.Also <strong>the</strong> International Standard Organisation (ISO) has produced some standards on <strong>gas</strong> quality[lit.25,26,27]. The ISO standards are restricted <strong>to</strong> describing <strong>the</strong> format of <strong>the</strong> quality designation,often without giving quantitative limitations. The DVGW formulated some experience basedquantitative limits <strong>to</strong> <strong>the</strong> <strong>gas</strong> quality.Referencequality designationISO 13868ISO 13443ISO 15403quality requirementsDVGW 260DescriptionNatural <strong>gas</strong> - Quality designationNatural <strong>gas</strong> - Standard reference conditionsNatural <strong>gas</strong> - Designation of <strong>the</strong> quality of natural <strong>gas</strong> foruse as a compressed fuel for vehiclesGasbeschaffenheitTable 24: Most relevant standards on <strong>the</strong> quality of <strong>grid</strong> distributed fuel <strong>gas</strong>esThe general outline of <strong>the</strong> standard is a strict limitation of <strong>the</strong> Wobbe index range <strong>to</strong> be delivered <strong>to</strong><strong>the</strong> end-user and restrictions on individual component concentrations as far as necessary andpractically (technically and economically) achievable.Combustion propertiesThere are two kinds of natural <strong>gas</strong>es: high calorific (group H) and low calorific (group L) <strong>gas</strong>es. Thehigh calorific <strong>gas</strong>es consist mainly of methane and will often contain some o<strong>the</strong>r hydrocarbons. Thelow calorific <strong>gas</strong>es contain less methane and contain considerable amounts of nitrogen or carbondioxide. The Wobbe number W is defined by <strong>the</strong> calorific value (H) divided by <strong>the</strong> square root (√ d)<strong>from</strong> <strong>the</strong> density.HW =√ dMixtures with <strong>the</strong> same Wobbe number will have <strong>the</strong> same combustion properties. Only <strong>the</strong> flamestability requires adaptation <strong>to</strong> <strong>the</strong> combustion speed of <strong>the</strong> <strong>gas</strong>es. All natural <strong>gas</strong>es have nearly <strong>the</strong>same combustion speed.page: 57
In Europe only two kinds of natural <strong>gas</strong> are distributed. These kinds are indicated with L and Hconform <strong>the</strong> prevailing German publication G 260. The L <strong>gas</strong>es originate only <strong>from</strong> <strong>the</strong> Dutch natural<strong>gas</strong> <strong>from</strong> <strong>the</strong> Groningen <strong>gas</strong> fields with its high content of nitrogen. Nearly all o<strong>the</strong>r natural <strong>gas</strong>es inEurope are within <strong>the</strong> H quality limits. Table 25 gives an indication of <strong>the</strong> combustion properties in Hand L natural <strong>gas</strong>es.Locally <strong>the</strong>re are often stricter requirements on <strong>the</strong> Wobbe number. A recent IGU publication [lit.28]gives details on this practice. The ra<strong>the</strong>r complex European standard EN 437 [lit.29] describes thissituation in detail.Parameter Unit L H RemarksWobbe number MJ/m 3 38 - 47 46 – 57 Locally stricter conditionsare usedcalorific value MJ/m 3 30 – 47 Deviations are allowedrelative density - 0.55 - 0.70 Deviations are allowedTable 25: Combustion properties of H and L <strong>gas</strong>es conform <strong>the</strong> German publication DVGW 260Transport, safety, utilisation and environmental requirementsThe transport, safety, utilisation and environmental requirements are related <strong>to</strong> <strong>the</strong> minorcomponents in <strong>the</strong> distribution <strong>gas</strong>es. They are <strong>the</strong> same worldwide. Table 26 includes <strong>the</strong>serequirements.Component or quality Unit Limit or range RemarksHydrogen % < 12carbon monoxide % < 1oxygen in dry <strong>gas</strong> <strong>grid</strong>s % < 4oxygen in wet <strong>gas</strong> <strong>grid</strong>s % < 0,5 corrosionwater and o<strong>the</strong>r liquids - not any liquid at any pressureor temperature in <strong>the</strong> <strong>grid</strong>also retrogradecondensation is notallowedsulphur and sulphur mg/m 3 (S) < 120 corrosion, environmentcontaining componentshydrogen sulphide mg/m 3 (S) < 6Mercaptans mg/m 3 (S) < 5solids, dust - None no quantificationMercury micro g/m 3 no dataaromatic components g/m 3 < 10Ammonia mg/m 3 < 3hydrogen cyanide mg/m 3 150Table 26: Conventional requirements on distribution <strong>gas</strong> composition and propertiesNew requirementsNew developments and special applications create additional requirements for <strong>the</strong> <strong>gas</strong>. Theseadditional requirements are:page: 58
Alkali metalsAt high temperatures some alkali metal components vaporize and can be transported <strong>to</strong> <strong>the</strong>appliances, some of <strong>the</strong>m are vulnerable <strong>to</strong> alkali metal components. Gas turbines require a feedwithout alkali metal components.AromaticsAromatics like benzene and <strong>to</strong>luene are present in some natural <strong>gas</strong> and can induce stresscorrosion cracking in some plastic pipelines. New plastic pipeline materials are ra<strong>the</strong>r resistant <strong>to</strong>stress corrosion by aromatic components. Some limitation of <strong>the</strong> concentration of aromaticcomponents in <strong>the</strong> product <strong>gas</strong> can be needed.Carbon monoxideCarbon monoxide containing <strong>to</strong>wn <strong>gas</strong> is distributed for decennia all over <strong>the</strong> world. Properodorisation is used <strong>to</strong> reach an early warning in case of a leakage. A potential problem arises with<strong>the</strong> increasing use of stainless steel in appliances. The nickel, if present, in <strong>the</strong> stainless steel reactsat room temperature with <strong>the</strong> carbon monoxide <strong>to</strong> form <strong>gas</strong>eous carbonyl compounds.HalogensMost chlorine and fluorine (halogens) originate <strong>from</strong> waste materials, often co-processed with<strong>biomass</strong>. But also some <strong>biomass</strong> can contain considerable amounts of halogens. Limitations exist<strong>to</strong> avoid <strong>the</strong> formation of halogen acids and o<strong>the</strong>r adverse halogenated products during combustion.Methane numberCurrently all reciprocal <strong>gas</strong> engines are adapted <strong>to</strong> <strong>the</strong> actual range of methane numbers in <strong>the</strong><strong>gas</strong>es <strong>to</strong> be fed <strong>to</strong> <strong>the</strong> installation. The distribution of a <strong>gas</strong> with a methane number outside <strong>the</strong>current range can impose serious problems <strong>to</strong> <strong>the</strong> <strong>gas</strong> engine. Fluctuations within <strong>the</strong> actual rangereduce <strong>the</strong> averaged energy conversion efficiency of <strong>the</strong> <strong>gas</strong> engine. It is possible <strong>to</strong> have a controlsystem on <strong>the</strong> <strong>gas</strong> engine <strong>to</strong> adapt <strong>to</strong> <strong>the</strong> actual methane number. Currently most European <strong>gas</strong>eshave a methane number between 70 and 100 [lit.31]. The International Standard Organisation hasproduced a draft standard on <strong>the</strong> use of natural <strong>gas</strong> as vehicle fuel [lit.32].SiloxanesSiloxanes are large, but still volatile, organic silicium containing components present in wastestreams. On combustion <strong>the</strong>y form silicium oxide building up an abrasive layer in a <strong>gas</strong> engine.Often it is possible <strong>to</strong> trace <strong>the</strong> source of <strong>the</strong> siloxanes and <strong>to</strong> s<strong>to</strong>p this contamination.In Austria explicit limits are given in <strong>the</strong>ir standard ‘Deponie<strong>gas</strong>’ [lit.30] on chlorine and fluorineconcentrations.page: 59
Component or quality Unit Limit or range Remarksalkali metals ppm mol n.a. <strong>gas</strong> turbinesAromatic components mol% n.a. -carbon monoxide mol% < 1 -Chlorine containing components mg/m 3 < 50 environment, corrosion(halogen)fluorine containing components mg/m 3 < 25 Environment(halogen)Methane number - 70 - 100Siloxanes - not detectable deteriorating <strong>gas</strong> enginesand turbinesTable 27: New requirements on distribution <strong>gas</strong> composition and propertiesConsequences of <strong>gas</strong> quality aspectsCleaningAll <strong>gas</strong>es added <strong>to</strong> <strong>the</strong> <strong>gas</strong> <strong>grid</strong> should be cleaned <strong>from</strong> contaminating components: liquids, dust,sulphurous components, trace components. Cleaning processes are mature and ra<strong>the</strong>r standard.Selection of <strong>the</strong> most economic cleaning process is a matter of routine engineering.Treatment and conversionIn some cases also <strong>the</strong> Wobbe index and methane number needs adjustment <strong>to</strong> prevailingstandards. This adjustment requires specific physical (treatment) or chemical processes(conversion). The technology for treatment and conversion of <strong>gas</strong>es is available but only incidentallyapplied on <strong>gas</strong>es obtained <strong>from</strong> <strong>biomass</strong>. Therefore each application requires innovativeengineering solutions for treatment and conversion of <strong>the</strong> <strong>gas</strong>es. The strictest conditions prevail for<strong>the</strong> H natural <strong>gas</strong>es. In <strong>the</strong>se <strong>gas</strong>es only a low concentration of non-hydrocarbon components (up <strong>to</strong>3 - 5%) may be present in <strong>the</strong> <strong>gas</strong> due <strong>to</strong> <strong>the</strong> Wobbe index limitation. L natural <strong>gas</strong>es may containlarger amounts of non-hydrocarbon (15 - 20%) components. Treatment and conversion of <strong>gas</strong>esdestined for an L <strong>gas</strong> <strong>grid</strong> will be much easier feasible than for <strong>gas</strong>es dedicated <strong>to</strong> <strong>the</strong> H <strong>gas</strong> <strong>grid</strong>.6.2 LEGISLATIONOne prerequisite for <strong>the</strong> transport of bio<strong>gas</strong> on <strong>the</strong> European natural <strong>gas</strong> <strong>grid</strong> is that <strong>the</strong> legalframework for access <strong>to</strong> <strong>the</strong> natural <strong>gas</strong> <strong>grid</strong> is designed in a way that makes it possible for smaller<strong>gas</strong> producers <strong>to</strong> transport <strong>the</strong>ir <strong>gas</strong> on <strong>the</strong> <strong>grid</strong>.This legal framework is not only necessary for <strong>the</strong> bio<strong>gas</strong> producers, but also necessary for <strong>the</strong> freetrade of different natural <strong>gas</strong> qualities within <strong>the</strong> EU. The basis for this framework is <strong>the</strong> directive<strong>from</strong> <strong>the</strong> EC concerning free trade of <strong>gas</strong> within <strong>the</strong> EU.The <strong>gas</strong> industry is regulated by a large number of laws and regulations. Some of <strong>the</strong>m are national,o<strong>the</strong>rs are international.page: 60
The laws and rules that provide <strong>the</strong> framework for <strong>the</strong> <strong>gas</strong> industry can be categorised in<strong>to</strong> rulescontrolling:• Gas trade• Gas quality <strong>to</strong> end-user• Gas quality/quantity measurement• Gas requirement <strong>from</strong> safety aspects6.2.1 Gas tradeThe main legal document that provides <strong>the</strong> framework for <strong>the</strong> <strong>gas</strong> trade within <strong>the</strong> European Union,is <strong>the</strong> directive 98/30/EG [lit.33] <strong>from</strong> <strong>the</strong> European Commission that was approved by <strong>the</strong> EuropeanParliament on <strong>the</strong> 22 nd of June 1998. This directive is now being implemented in <strong>the</strong> nationallegislation in <strong>the</strong> member countries and should be integrated in <strong>the</strong> legislation by <strong>the</strong> year 2000. Thedirective is based on <strong>the</strong> general principle within <strong>the</strong> EU, i.e. <strong>the</strong>re shall be no obstacles within <strong>the</strong>EU prohibiting a free movement of goods, persons, services or capital. The directive states that:• "The technical framework for operation of <strong>gas</strong> systems must be clear and provide operationcompatibility."• "Distribution companies must in no case discriminate users of <strong>the</strong> system, especially not infavour of own cus<strong>to</strong>mers or suppliers <strong>to</strong> <strong>the</strong> system."• "Every distribution company shall provide any o<strong>the</strong>r distribution company with sufficientinformation in order <strong>to</strong> ascertain a safe and efficient operation of <strong>the</strong> interconnected systems."• "Access <strong>to</strong> <strong>the</strong> <strong>grid</strong>…shall be approved in accordance with national legislation. The legislationshall be fair and open. The following may be considered: a) The need <strong>to</strong> reject access wherediscrepancies between technical specifications in a reasonable way not may be overcome."The general intention of <strong>the</strong> directive 98/30/EG is <strong>to</strong> provide an open market that does notdiscriminate any supplier of <strong>gas</strong>. An interesting detail in <strong>the</strong> directive is a lack of definition of natural<strong>gas</strong>. The directive not even states that natural <strong>gas</strong> should be a <strong>gas</strong> containing mainly methane. Thishas been added in some of <strong>the</strong> national legislation but natural <strong>gas</strong> is here normally only defined as"a <strong>gas</strong> containing mainly methane" which in most cases is also a definition that covers <strong>gas</strong> <strong>from</strong>anaerobic digestion. The definition of natural <strong>gas</strong> is according <strong>to</strong> ISO [lit.34] “complex mixture ofhydrocarbons, primarily methane, but generally also including ethane, propane and higherhydrocarbons in much smaller amounts and some non-combustible <strong>gas</strong>es, such as nitrogen andcarbon dioxide”. Note 4 in <strong>the</strong> standard states: "Natural <strong>gas</strong> consists predominantly of methane(mole fraction greater than 0,7 12 ) and has a superior calorific value normally within <strong>the</strong> range 30MJ/m 3 <strong>to</strong> 45 MJ/m 3 ". Syn<strong>gas</strong>, for example obtained by <strong>the</strong>rmal <strong>gas</strong>ification of <strong>biomass</strong>, is <strong>the</strong>rebyexcluded.12A mole fraction 0.7 equals closely a volume percentage of 70page: 61
The directive thus also provides possibilities for new suppliers <strong>to</strong> enter new markets. The problemwith interoperability of <strong>the</strong> <strong>gas</strong> networks within <strong>the</strong> EU countries has caused <strong>the</strong> Commission <strong>to</strong>study <strong>the</strong> subject and a final report [lit.35] was ready in 1999. The conclusions <strong>from</strong> this reportconcerning <strong>the</strong> need for an updated legal framework is cited below:"The legal framework concerning natural <strong>gas</strong> transportation, s<strong>to</strong>rage and trade is very differentwithin <strong>the</strong> EU member states. The range covers strict regulations, monopoly rights for state-ownedcompanies up <strong>to</strong> completely deregulated markets. In some countries, regulation of <strong>the</strong> <strong>gas</strong> supply iscompletely delegated <strong>to</strong> <strong>the</strong> <strong>gas</strong> industry.To enable interoperability of <strong>the</strong> networks and <strong>to</strong> allow third party access, it is essential that somecountries substantially change <strong>the</strong>ir legal framework. While <strong>the</strong>se changes in some countriesalready have started, o<strong>the</strong>rs have been granted a deferment due <strong>to</strong> <strong>the</strong>ir classification as emergingmarkets."The general conclusion concerning <strong>the</strong> development of <strong>the</strong> legal framework for <strong>gas</strong> trade within <strong>the</strong>EU is that <strong>the</strong> directive 98/30/EG will make it easier for small <strong>gas</strong> producers and <strong>gas</strong> distributioncompanies <strong>to</strong> gain access <strong>to</strong> <strong>the</strong> natural <strong>gas</strong> <strong>grid</strong>. The lack of definition of natural <strong>gas</strong> in <strong>the</strong> directive(or very wide definition in national legislation) may make it possible for <strong>gas</strong> <strong>from</strong> anaerobic digestion<strong>to</strong> be transported on <strong>the</strong> natural <strong>gas</strong> <strong>grid</strong> in <strong>the</strong> future. The pipeline companies or distributioncompanies can refuse access <strong>to</strong> <strong>the</strong> <strong>grid</strong> only if technical and administrative problems cannot beovercome in a reasonable way. Gases containing carbon monoxide and hydrogen and less <strong>the</strong>n70% methane will probably have more difficulties in gaining access <strong>to</strong> <strong>the</strong> <strong>grid</strong>, being ‘non methane’<strong>gas</strong>es. For <strong>gas</strong>es containing lower fractions of carbone monoxide and hydrogen it may be moreeasy <strong>to</strong> find access <strong>to</strong> <strong>the</strong> <strong>grid</strong>.6.2.2 Gas quality <strong>to</strong> end-userThe <strong>gas</strong> qualities that are delivered <strong>to</strong> end-users in Europe vary between different countries andsometimes even within individual countries. The quality specifications are normally not incorporatedin <strong>the</strong> legislation but are defined in national and international standards and regulations. The mostused standards and regulations in Europe are based on <strong>the</strong> European standard EN 437 and <strong>the</strong>DVGW 260.All fuel <strong>gas</strong>es that are distributed in Europe are categorised in three ‘families’. The first comprisesfuel <strong>gas</strong>es with high hydrogen content, e.g. <strong>to</strong>wn <strong>gas</strong>es. The second family comprises methane<strong>gas</strong>es with, for example, natural <strong>gas</strong> and bio<strong>gas</strong>. The third family comprises liquid <strong>gas</strong>es, e.g.propane/butane mixtures. The second <strong>gas</strong> family is divided in<strong>to</strong> two groups L and H according <strong>to</strong>Wobbe index.The standards EN 437 [lit.29] and DVGW 260 [lit.22] are compared <strong>to</strong> <strong>the</strong> national regulations for Lpage: 62
and H <strong>gas</strong> in figures 12 and 13.Figure 12: Maximum range of permitted Wobbe index in Europe, L <strong>gas</strong>From <strong>the</strong> figure above it can be concluded that <strong>the</strong> permitted Wobbe values for L <strong>gas</strong> in Europeancountries all lie within <strong>the</strong> limits stated in EN 437. Only <strong>the</strong> German L <strong>gas</strong> may vary outside <strong>the</strong>limits set by EN 437. Unpurified bio<strong>gas</strong> with 60% methane has a Wobbe index of 24.6 MJ/m 3 andpurified bio<strong>gas</strong> with 90% methane has a Wobbe index of 44,4 MJ/m 3 . Purified bio<strong>gas</strong> <strong>the</strong>reforecould be used directly in <strong>the</strong> L <strong>gas</strong> <strong>grid</strong> in <strong>the</strong> Ne<strong>the</strong>rlands, providing o<strong>the</strong>r purity demands arefulfilled.page: 63
Figure 13: Maximum range of permitted Wobbe index in Europe, H <strong>gas</strong>The allowed H <strong>gas</strong> compositions vary between different countries, some countries follow<strong>the</strong> recommendations in DVGW 260 and some <strong>the</strong> EN 437 (with minor variations).The actual <strong>gas</strong> compositions in <strong>the</strong> European countries, compared <strong>to</strong> EN 437 and DVGW 260 arepresented in figures 14 and 15.Figure 14: Maximum range of delivered Wobbe index in Europe, L <strong>gas</strong>page: 64
Figure 15: Maximum range of delivered Wobbe index in Europe, H <strong>gas</strong>From <strong>the</strong>se figures it can be concluded that <strong>the</strong> <strong>gas</strong> that actually is delivered <strong>to</strong> <strong>the</strong> cus<strong>to</strong>mer showsmuch smaller variations than is allowed in <strong>the</strong> national regulations. Bio<strong>gas</strong> has <strong>to</strong> be purified <strong>to</strong>> 92% methane in order <strong>to</strong> fit in<strong>to</strong> <strong>the</strong> Wobbe index demands stated in DVGW 260.Conform DVGW 260 it is important that <strong>the</strong> variations in <strong>gas</strong> quality in a specific distribution <strong>grid</strong> donot vary <strong>to</strong>o much. Large variations will cause problems in <strong>the</strong> combustion equipment. Variationsbetween + 0.6 / -1.4 kWh/m 3 are allowed for L <strong>gas</strong> and + 0.7 / -1.4 kWh/m 3 for H <strong>gas</strong>. Some nationalregulations are even stricter.O<strong>the</strong>r demands on natural <strong>gas</strong> that is delivered <strong>to</strong> cus<strong>to</strong>mers are:• Dewpoint at actual pressure of delivery shall be lower than <strong>the</strong> ground temperature• The <strong>gas</strong> must be free <strong>from</strong> mist, dust or liquids• Oxygen content < 3 %• Total sulphur < 120 mg/m 3• Hydrogen sulphide < 5 mg/m 3• Mercaptane sulphur < 6 mg/m 3It is important that any introduction of bio<strong>gas</strong> in<strong>to</strong> <strong>the</strong> natural <strong>gas</strong> <strong>grid</strong> does not change <strong>the</strong> <strong>gas</strong>composition in a way that may affect <strong>the</strong> safe operation of <strong>the</strong> cus<strong>to</strong>mer installation. The maximumamount of bio<strong>gas</strong> that can be injected in<strong>to</strong> <strong>the</strong> <strong>grid</strong> <strong>the</strong>refore has <strong>to</strong> be thoroughly calculated and notexceeded.The injection equipment has <strong>to</strong> be equipped with safety devices that shut down <strong>the</strong> bio<strong>gas</strong> injectionif <strong>the</strong>re is a risk that <strong>the</strong> <strong>gas</strong> composition on <strong>the</strong> <strong>grid</strong> reaches values that lie outside <strong>the</strong> designvalues for <strong>the</strong> cus<strong>to</strong>mer installations.As an example, <strong>the</strong> maximum addition of upgraded <strong>gas</strong> <strong>from</strong> anaerobic digestion <strong>to</strong> H <strong>gas</strong> (Danishnatural <strong>gas</strong>) is presented in figure 16.page: 65
Figure 16: Wobbe index for different mixtures of upgraded bio<strong>gas</strong> and Danish natural <strong>gas</strong>Figure 16 shows that 50% bio<strong>gas</strong>, purified <strong>to</strong> 90% methane or 85% bio<strong>gas</strong>, purified <strong>to</strong> 95%methane, can be added <strong>to</strong> <strong>the</strong> natural <strong>gas</strong> without affecting <strong>the</strong> Wobbe index in a way thatendangers <strong>the</strong> safe operation of combustion equipment. It is <strong>the</strong> responsibility of <strong>the</strong> supplier of <strong>the</strong>bio<strong>gas</strong> <strong>to</strong> guarantee a stable and approved composition of <strong>the</strong> <strong>gas</strong>. It is <strong>the</strong> responsibility of <strong>the</strong> <strong>grid</strong>opera<strong>to</strong>r <strong>to</strong> restrict <strong>the</strong> amount of bio<strong>gas</strong> in<strong>to</strong> <strong>the</strong> <strong>grid</strong> <strong>to</strong> levels that do not endanger <strong>the</strong> safeoperation of equipment connected <strong>to</strong> <strong>the</strong> <strong>grid</strong>. The <strong>grid</strong> opera<strong>to</strong>rs are obliged <strong>to</strong> provide any supplierof <strong>gas</strong> with sufficient information in order <strong>to</strong> ascertain a safe and reliable operation of <strong>the</strong> system.The demand of a constant <strong>gas</strong> quality may be greater than stated above if o<strong>the</strong>r equipment thancombustion equipment is connected <strong>to</strong> <strong>the</strong> natural <strong>gas</strong> <strong>grid</strong>, e.g. <strong>gas</strong> engines, NGV´s, fuel cells,chemical processes. The demands for <strong>gas</strong> supplied <strong>to</strong> NGV´s has been stated by ISO [lit.32]:• < 0.03 g/m 3 water (dewpoint -13 °C at 250 bar)• < 120 mg/m 3 sulphur• < 3 % oxygen• < 3 % carbon dioxideEngines may be very sensitive <strong>to</strong> variations in <strong>gas</strong> quality and especially lean burn engines withouta feed back control system may demand very stable <strong>gas</strong> compositions. Variations of + 0,9 / - 0,8MJ/m 3 are stated in a Swedish standard [lit.36] as acceptable for vehicles with lean burn engines.6.2.3 Gas quality and quantity measurementpage: 66
Bio<strong>gas</strong> that is injected in<strong>to</strong> <strong>the</strong> natural <strong>gas</strong> <strong>grid</strong> will always affect <strong>the</strong> quality of <strong>the</strong> <strong>gas</strong> in <strong>the</strong> <strong>grid</strong>and variations in <strong>gas</strong> quality will au<strong>to</strong>matically affect <strong>the</strong> energy measurement accuracy if heatingvalue and <strong>gas</strong> flow are not measured simultaneously.The directive 98/30/EG does however not state <strong>the</strong> measurement procedure for <strong>gas</strong> that isdelivered <strong>to</strong> <strong>the</strong> <strong>grid</strong>; this is clarified when <strong>the</strong> directive is implemented in<strong>to</strong> <strong>the</strong> national legislation.Some general principles in <strong>the</strong> national legislations are:• The supplier of <strong>gas</strong> is responsible for <strong>the</strong> measurement of <strong>gas</strong> supplied <strong>to</strong> <strong>the</strong> <strong>grid</strong>• Suppliers of <strong>gas</strong> must measure <strong>the</strong> delivered quantity with an accuracy that is stated in <strong>the</strong>national legislation. The accuracy is generally expressed as % of <strong>the</strong> volume flow, not <strong>the</strong>energy flow.• The supplier of <strong>gas</strong> must report <strong>the</strong> amount of supplied <strong>gas</strong> (m 3 and kWh) <strong>to</strong> <strong>the</strong> <strong>grid</strong> <strong>to</strong> <strong>the</strong>owner of <strong>the</strong> <strong>grid</strong>. Reporting should be performed with an interval stated in <strong>the</strong> nationallegislation, normally once every 24 hours.• The measurement system that is used <strong>to</strong> measure <strong>the</strong> <strong>gas</strong> that is supplied <strong>to</strong> <strong>the</strong> <strong>grid</strong> should becalibrated and documented according <strong>to</strong> national legislation.The directive 98/30/EG does not state any differences in legislation concerning <strong>the</strong> measurement ofbio<strong>gas</strong> compared <strong>to</strong> <strong>the</strong> measurement of natural <strong>gas</strong> and it must <strong>the</strong>refore be assumed that <strong>the</strong>same measurement principles should apply <strong>to</strong> bio<strong>gas</strong> as <strong>to</strong> natural <strong>gas</strong>. This will probably make itdifficult for <strong>the</strong> bio<strong>gas</strong> plant <strong>to</strong> administrate <strong>the</strong> measurement and reporting of delivered <strong>gas</strong> quantityand quality. These tasks should <strong>the</strong>refore be handed over <strong>to</strong> <strong>the</strong> <strong>grid</strong> opera<strong>to</strong>r or <strong>the</strong> natural <strong>gas</strong>distribution company.6.2.4 Gas requirement <strong>from</strong> safety aspectsThe <strong>gas</strong> that is transported in <strong>the</strong> natural <strong>gas</strong> <strong>grid</strong> and used by cus<strong>to</strong>mers connected <strong>to</strong> <strong>the</strong> natural<strong>gas</strong> <strong>grid</strong> must fulfil a number of safety requirements and <strong>the</strong> most important are linked <strong>to</strong> <strong>the</strong> safeoperation of <strong>the</strong> cus<strong>to</strong>mer application. These properties are discussed in § 6.2.2. O<strong>the</strong>r <strong>gas</strong>properties that must be considered <strong>from</strong> a safety aspect, are <strong>the</strong> properties that may affect <strong>the</strong> safeoperation of <strong>the</strong> <strong>grid</strong>, e.g. content of corrosive and erosive components and odorisation of <strong>the</strong> <strong>gas</strong>.All <strong>the</strong>se requirements are generally not quantified in <strong>the</strong> legislation but belong <strong>to</strong> a task that <strong>the</strong>owner of <strong>the</strong> <strong>grid</strong> must fulfil. The legislation states that <strong>the</strong> owner of <strong>the</strong> <strong>grid</strong> is responsible for <strong>the</strong>safe operation of <strong>the</strong> <strong>grid</strong> and <strong>the</strong>refore must develop operating procedures and quality assurancesystems that guarantees that no <strong>gas</strong> that can harm <strong>the</strong> <strong>grid</strong> is introduced in<strong>to</strong> <strong>the</strong> <strong>grid</strong>. Limits forspecific compounds are generally not included in <strong>the</strong> legislation, but are stated in <strong>the</strong> proceduresand standards that are used nationally. In order <strong>to</strong> make it possible for <strong>the</strong> <strong>grid</strong> opera<strong>to</strong>r <strong>to</strong>guarantee a safe operation of <strong>the</strong> <strong>grid</strong>, he has <strong>to</strong> demand that <strong>the</strong> quality of <strong>the</strong> <strong>gas</strong> is measuredand controlled in a way that ascertains a safe operation of <strong>the</strong> <strong>grid</strong>. This task is also betterperformed <strong>to</strong>ge<strong>the</strong>r with (or by) <strong>the</strong> local owner of <strong>the</strong> <strong>grid</strong> (see § 6.2.3).page: 67
6.2.5 Discrepancies between standards and technical and economical feasibilityAll standards and regulations for distribution of <strong>gas</strong> on <strong>the</strong> natural <strong>gas</strong> <strong>grid</strong> in Europe are developedfor natural <strong>gas</strong>, even if it is not explicitly expressed. This means that bio<strong>gas</strong>, and especially <strong>gas</strong> <strong>from</strong><strong>the</strong>rmal <strong>gas</strong>ification may have difficulties in fulfilling <strong>the</strong> demands in <strong>the</strong>se standards andspecifications and in some cases fulfilment is impossible. This can cause economical and technicalproblems for <strong>the</strong> company that want <strong>to</strong> introduce bio<strong>gas</strong> in<strong>to</strong> <strong>the</strong> <strong>grid</strong>.There will always be a balance between upgrading costs and market value for <strong>the</strong> <strong>gas</strong>. A bio<strong>gas</strong> canbe upgraded <strong>to</strong> exactly fit <strong>the</strong> <strong>gas</strong> composition in <strong>the</strong> natural <strong>gas</strong> <strong>grid</strong>, but <strong>the</strong> cost for <strong>the</strong> upgradingwill probably be very high. Less upgrading will result in a product that may not be as valuable on <strong>the</strong>market, but on <strong>the</strong> o<strong>the</strong>r hand is less costly <strong>to</strong> produce.Wobbe indexOne of <strong>the</strong> basic demands is <strong>the</strong> Wobbe index. A bio<strong>gas</strong> must generally be upgraded in order <strong>to</strong>reach a sufficient Wobbe index <strong>to</strong> be injected in<strong>to</strong> <strong>the</strong> natural <strong>gas</strong> <strong>grid</strong> without causing <strong>to</strong>o largedisturbances in <strong>the</strong> natural <strong>gas</strong> quality. Upgrading costs money and energy and should thus beminimised. Problems may <strong>the</strong>n occur with <strong>the</strong> distribution company that will have <strong>to</strong> deal with amixed <strong>gas</strong> of lower Wobbe index and lower heating value. Fluctuations will occur if <strong>the</strong> <strong>gas</strong> qualityand <strong>the</strong> <strong>gas</strong> flow are not constant <strong>from</strong> <strong>the</strong> bio<strong>gas</strong> plant. These fluctuations may be neglectable if<strong>the</strong> natural <strong>gas</strong> flow is sufficient, but has <strong>to</strong> be considered when <strong>the</strong> load is low. There are severaldifferent ways of solving <strong>the</strong> problem: addition of propane <strong>to</strong> <strong>the</strong> bio<strong>gas</strong>, flow control of <strong>the</strong> bio<strong>gas</strong>etc. A good co-operation between <strong>the</strong> bio<strong>gas</strong> plant and <strong>the</strong> opera<strong>to</strong>r of <strong>the</strong> <strong>grid</strong> is in all cases aprerequisite for an economical system design.Wobbe index may be adjusted by <strong>the</strong> addition of LPG <strong>to</strong> <strong>the</strong> bio<strong>gas</strong> but this addition has <strong>to</strong> be kep<strong>to</strong>n a low level in order <strong>to</strong> avoid condensation of hydrocarbons in <strong>the</strong> <strong>grid</strong> and also <strong>to</strong> keep <strong>the</strong> costfor LPG-addition on a low level.NitrogenNitrogen is a component that may be very costly <strong>to</strong> remove <strong>from</strong> bio<strong>gas</strong> if it is present in largerquantities, such as in <strong>gas</strong> <strong>from</strong> air <strong>gas</strong>ification of bio fuels. Current standards do not require <strong>the</strong>removal of nitrogen. In case <strong>the</strong> new standards mention an upper limit for nitrogen, removal may bedone by PSA or membrane technology but <strong>the</strong>se processes are generally not economically feasible.OxygenOxygen is a compound that normally is not present in <strong>gas</strong> <strong>from</strong> <strong>gas</strong>ification or anaerobic digestion,but in some cases considerable amounts have been found in <strong>gas</strong> <strong>from</strong> anaerobic digestion whereair leaks have been detected in <strong>the</strong> digester or in <strong>the</strong> bio<strong>gas</strong> system. Oxygen can be removed in asimilar way as nitrogen, but <strong>the</strong> best way avoiding oxygen in <strong>the</strong> bio<strong>gas</strong>, is <strong>to</strong> equip <strong>the</strong> digestionprocess with a process supervision- and control system that au<strong>to</strong>matically shuts down <strong>the</strong> system ifpage: 68
an oxygen leak is detected. This requirement is often also set by <strong>the</strong> national legislation, in order <strong>to</strong>avoid explosions in digestion reac<strong>to</strong>rs.Gas quality measurement- and data acquisition systemsGas quality measurement- and data acquisition systems are necessary <strong>to</strong> check and report <strong>the</strong>delivered <strong>gas</strong> quantity and quality <strong>to</strong> <strong>the</strong> <strong>grid</strong> opera<strong>to</strong>r. These systems may be costly for a smallsupplier of <strong>gas</strong> and it is <strong>the</strong>refore recommended that <strong>the</strong>se systems are standardised and integratedwith <strong>the</strong> systems operated by <strong>the</strong> <strong>grid</strong> opera<strong>to</strong>r.6.2.6 ‘Responsible Bodies’ for <strong>gas</strong> qualityThe European legislation generally states that <strong>the</strong> opera<strong>to</strong>r of <strong>the</strong> <strong>grid</strong> is responsible for <strong>the</strong> safeoperation of <strong>the</strong> <strong>grid</strong> and he <strong>the</strong>reby has <strong>to</strong> set <strong>the</strong> standards for <strong>the</strong> <strong>gas</strong> that is introduced in<strong>to</strong> <strong>the</strong><strong>grid</strong>. The <strong>grid</strong> opera<strong>to</strong>r is also responsible for <strong>the</strong> quality of <strong>the</strong> <strong>gas</strong> in <strong>the</strong> <strong>grid</strong>. The demands on <strong>gas</strong>quality is <strong>the</strong>n fur<strong>the</strong>r specified by <strong>the</strong> national authorities that control <strong>the</strong> natural <strong>gas</strong> sec<strong>to</strong>r in <strong>the</strong>individual countries and <strong>the</strong>se demands vary between ra<strong>the</strong>r detailed definitions of <strong>the</strong> natural <strong>gas</strong>quality <strong>to</strong> definitions like "<strong>gas</strong> containing mainly methane".The European body that handles <strong>the</strong> discussions within <strong>the</strong> <strong>gas</strong> industry about <strong>gas</strong> qualityquestions, is Marcogaz. Twelve European countries are represented in Marcogaz and <strong>the</strong> workwithin Marcogaz is performed within three different committees. It is important that <strong>the</strong> partnerswithin Marcogaz bring up <strong>the</strong> discussion on how <strong>to</strong> handle bio<strong>gas</strong> injection in<strong>to</strong> <strong>the</strong> <strong>grid</strong>. This ishowever a matter that must be co-ordinated with <strong>the</strong> organisations producing bio<strong>gas</strong> or representing<strong>the</strong> bio<strong>gas</strong> industry. It may be feasible <strong>to</strong> set up a joint working group with representatives <strong>from</strong> <strong>the</strong>bio<strong>gas</strong> industry and <strong>the</strong> natural <strong>gas</strong> industry <strong>to</strong> draw up a proposal for standards that can be usedwithin <strong>the</strong> European countries. These standards should include recommendations for:• quality assurance systems for bio<strong>gas</strong> injection• measurement procedures for bio<strong>gas</strong> injection• quality requirements for bio<strong>gas</strong> injected in<strong>to</strong> natural <strong>gas</strong> <strong>grid</strong>s.These recommendations can <strong>the</strong>n be discussed in CEN/TC 234 ‘Gas supply’ in order <strong>to</strong> formEuropean guidelines for <strong>the</strong> handling of bio<strong>gas</strong>es on <strong>the</strong> natural <strong>gas</strong> <strong>grid</strong>.page: 69
6.2.7 Description of national or de-fac<strong>to</strong> industrial directivesBio<strong>gas</strong> has been introduced in <strong>the</strong> natural <strong>gas</strong> network at a number of locations in Europe. Fiveplants are in operation in Holland, three in Switzerland and two in Sweden. More plants have beencommissioned but some are not in operation for different reasons. The different requirements for <strong>the</strong>bio<strong>gas</strong> that is injected in <strong>the</strong> <strong>grid</strong> are presented in <strong>the</strong> table below.Component Switzerland France SwedenMethane (distribution <strong>grid</strong>) % > 96 > 88 > 97Methane (high pressure % > 60transmission <strong>grid</strong>)Water mg/m 3 5 100 32Carbon dioxide % < 3Oxygen % < 0.5 < 3.5 < 1Sulphur mg/m 3 < 14.3 < 23Hydrogen sulphide mg/m 3 < 5 < 7Table 28: National requirements for bio<strong>gas</strong> that is <strong>to</strong> be injected in<strong>to</strong> <strong>the</strong> natural <strong>gas</strong> <strong>grid</strong>In Holland, <strong>gas</strong> that is injected in<strong>to</strong> <strong>the</strong> L-<strong>gas</strong> <strong>grid</strong> is upgraded <strong>to</strong> a quality corresponding <strong>to</strong> <strong>the</strong>requirements stated in DVGW 260.It is quite obvious that <strong>the</strong> demands in different countries are different. The demands on <strong>the</strong> <strong>gas</strong> thatis injected in<strong>to</strong> <strong>the</strong> national <strong>grid</strong>s have <strong>to</strong> follow <strong>the</strong> requirements that are valid for <strong>the</strong> natural <strong>gas</strong>that is transported on <strong>the</strong> <strong>grid</strong>. The <strong>gas</strong> always has <strong>to</strong> be upgraded <strong>to</strong> a standard that it:• does not cause any problems in <strong>the</strong> cus<strong>to</strong>mer’s installation• does not harm <strong>the</strong> transmission or distribution network6.2.8 Tax legislation and incentivesOne of <strong>the</strong> major incentives <strong>to</strong> introduce bio<strong>gas</strong> in<strong>to</strong> <strong>the</strong> natural <strong>gas</strong> <strong>grid</strong> is <strong>the</strong> favourable taxlegislation for bio<strong>gas</strong>. Bio<strong>gas</strong> has a very strong status in EU as an environmentally sound fuel andhas thus no tax if it is used as a vehicle fuel. The taxation as fuel for production of heat and powervaries between different countries, but <strong>the</strong>re is no tax on bio<strong>gas</strong> used as vehicle fuel in any EUcountry.In Switzerland, bio<strong>gas</strong> used for heat production carries a tax whereas bio<strong>gas</strong> used as vehicle fuel is‘taxfree’. This has been <strong>the</strong> incentive <strong>to</strong> develop <strong>the</strong> concept known as Kompo<strong>gas</strong> [lit.37] wherebio<strong>gas</strong> is cleaned, injected in<strong>to</strong> <strong>the</strong> <strong>gas</strong> <strong>grid</strong> and distributed via <strong>the</strong> natural <strong>gas</strong> <strong>grid</strong> as a newproduct, Kompo<strong>gas</strong>.By distributing <strong>the</strong> bio<strong>gas</strong> on <strong>the</strong> natural <strong>gas</strong> <strong>grid</strong>, bio<strong>gas</strong> not only is distributed <strong>to</strong> a market where ahigher price can be acquired for <strong>the</strong> product, <strong>the</strong> natural <strong>gas</strong> can also be used as back up if <strong>the</strong>bio<strong>gas</strong> production is reduced. By introducing <strong>gas</strong> <strong>to</strong> <strong>the</strong> <strong>grid</strong>, all <strong>gas</strong> can be used even if <strong>the</strong> amountpage: 70
exceeds <strong>the</strong> consumption near <strong>the</strong> location of <strong>the</strong> production. Similar systems are applied inSweden. In Go<strong>the</strong>nburg, unpurified bio<strong>gas</strong> is injected in<strong>to</strong> <strong>the</strong> <strong>to</strong>wn <strong>gas</strong> <strong>grid</strong>, which normally issupplied <strong>from</strong> a mixing station where natural <strong>gas</strong> and air is mixed <strong>to</strong> <strong>to</strong>wn <strong>gas</strong> specifications.The Wobbe index of <strong>the</strong> bio<strong>gas</strong> and <strong>the</strong> <strong>to</strong>wn <strong>gas</strong> is almost <strong>the</strong> same and <strong>the</strong> bio<strong>gas</strong> <strong>the</strong>refore doesnot have <strong>to</strong> be upgraded. An amount of natural <strong>gas</strong>, corresponding <strong>to</strong> <strong>the</strong> energy input <strong>from</strong> bio<strong>gas</strong>in<strong>to</strong> <strong>the</strong> <strong>to</strong>wn <strong>gas</strong>, is distributed <strong>from</strong> <strong>the</strong> natural <strong>gas</strong> <strong>grid</strong> as vehicle fuel. This <strong>gas</strong> <strong>the</strong>n can bedistributed without taxes as long as <strong>the</strong> corresponding amount of bio<strong>gas</strong> (on a yearly basis) isinjected in <strong>the</strong> <strong>to</strong>wn <strong>gas</strong> <strong>grid</strong>.6.3 CONTROL AND MEASUREMENT6.3.1 Gas industry organisation on control and measurementIn <strong>the</strong> natural <strong>gas</strong> transport and distribution industry it is common practice that <strong>the</strong> supplier takes allresponsibilities on control and measurement activities on <strong>the</strong> supplied <strong>gas</strong>. Detailed agreementsform <strong>the</strong> basis of this understanding, covering essentially <strong>the</strong> control of <strong>the</strong> minimum quality of <strong>the</strong><strong>gas</strong> and <strong>the</strong> measurement of <strong>the</strong> energy amount delivered.In most cases a <strong>gas</strong> that moves <strong>from</strong> source <strong>to</strong> end-user changes <strong>from</strong> ownership. At <strong>the</strong> pointwhere <strong>the</strong> cus<strong>to</strong>dy transfer takes place <strong>the</strong> <strong>gas</strong> should have <strong>the</strong> agreed quality. There will also be acorrelation between delivered energy and <strong>the</strong> money paid for <strong>the</strong> <strong>gas</strong>. The cus<strong>to</strong>dy transfer takesplace between producer and <strong>the</strong> transport company, at national borders, between transporting anddistributing companies or between suppliers and end-users.Quality measurements are performed as far as possible upstream, <strong>the</strong>reby reducing <strong>the</strong> number ofmeasurements as much as possible. Energy flow measurements are mostly performed at <strong>the</strong> pointsof cus<strong>to</strong>dy transfer.6.3.2 Quality controlDue <strong>to</strong> <strong>the</strong> dispersed location of bio<strong>gas</strong> production, plants will be quite small. To reduce <strong>the</strong>instrumentation cost, <strong>the</strong> process control and <strong>gas</strong> quality measurements are often combined. Figure17 shows <strong>the</strong> typical design of <strong>the</strong> instrumentation for a bio<strong>gas</strong> production plant. A single set ofinstruments performs three tasks: process control, shut of and flaring of off-spec <strong>gas</strong>es and <strong>the</strong>quality control of <strong>the</strong> delivered <strong>gas</strong>.page: 71
Figure 17:Arrangement of <strong>the</strong> control and measurement instrumentation in installations for adding<strong>gas</strong>es <strong>to</strong> <strong>the</strong> <strong>grid</strong>. One set of instruments performs all process control, energy measurementand final control/safety shut-off functions.On-line measurementsThe Wobbe index is in most cases <strong>the</strong> only parameter <strong>to</strong> be moni<strong>to</strong>red on-line in <strong>the</strong> quality of <strong>the</strong>delivered <strong>gas</strong>. This Wobbe index is measured in four ways by:• dedicated Wobbe analysers• combined measurements by calorific value and density analysers• compositional measurement with non-dispersive infra-red moni<strong>to</strong>rs (IR analysis)• compositional measurements with <strong>gas</strong> chroma<strong>to</strong>graphs (GC analysis)Even in situations where only a narrow Wobbe index range is allowed, all <strong>the</strong>se measuring methodscan be used with sufficient accuracy. Applying compositional measurements on fuel <strong>gas</strong>esproduced by biological processes, only methane and carbon dioxide are <strong>to</strong> be measured on-line.Only if intrusion of air is possible, an oxygen measurement should also be included. Thermal<strong>gas</strong>ification processes also require <strong>the</strong> on-line measurement of hydrogen, oxygen and carbonmonoxide.Biologically generated <strong>gas</strong>es can be moni<strong>to</strong>red by IR and GC analysis. Thermally generated <strong>gas</strong>esare <strong>to</strong> be moni<strong>to</strong>red by GC analysis. Table 29 gives a survey of <strong>the</strong> current continuousmeasurement practice.page: 72
Measuring methodContinuous Wobbe indexmeasurementContinuous calorific valueMeasurementContinuous relative densitymeasurementIR analysis: composition,calorific value, density andmethane numberCalculation <strong>from</strong> compositionGC analysis: composition,calorific value, density andmethane numberCalculation <strong>from</strong> compositionUnit TypicalaccuracyRemarksMJ/m 3 0.4% On-line Wobbe meters arebecoming obsolete. Some low costmeasuring systems use Wobbemeters.Combined with on-line densitymeasurement <strong>the</strong>y provide calorificvalues.MJ/m 3 0.4% On-line calorific value measurementequipment is becoming obsolete.Some large transport pipelines arestill metered by direct recordingcalorimeters.- 0.4% On-line density meters are availableand quite versatile.mol% 2% relative Typical components measured:onmethane, carbon monoxide, andcomposition carbon dioxide.mol%1% relativeoncompositionOxygen mol% 10% relativeoncompositionNot measured by IR analysis:hydrogen, nitrogen and oxygenFrequent but discontinuouscompositional measurementsIn some processes oxygenmeasurements are essential for <strong>the</strong>process control.Water dewpoint °C +/- 2 °C Accuracy only essential nearcontract limit (typical - 8 °C at 4 bar)values.Table 29: On-line measurements applied in <strong>the</strong> process and quality control of <strong>gas</strong>es obtained <strong>from</strong><strong>biomass</strong>Spot checksO<strong>the</strong>r quality parameters are controlled by spot checks in a frequency depending on <strong>the</strong> expectedvariations in <strong>the</strong> feeds<strong>to</strong>ck and <strong>the</strong> design of <strong>the</strong> conversion installation.page: 73
Measurement methodDetection tubes for hydrogensulphide, mercaptans, ammonia,halogenated hydrocarbonSulphurous componentsGC analysisHalogen containing componentsGC analysisSiloxanesGC MSD analysisOdorosity.OrgananolepticUnit TypicalaccuracyRemarksmg/m 3 50% Detection tubes can be appliedfor <strong>the</strong> semi quantitativemeasurementmg/m 3 25% Detailed information at start upand in case of problemsmg/m 3 50% Detailed information at start upand in case of problemsnone qualitative Incidental in case of complaintsnone acceptable /not acceptableIncidental measurement incompletion <strong>to</strong> an adequateodorisation systemTable 30: Measurement methods for spot checksThe spot checks are mainly performed on components <strong>to</strong> be removed by a long lasting sorptionmass or catalyst bed. With detection tubes it is detected whe<strong>the</strong>r <strong>the</strong> sorption mass or catalyst bedis still active or not. GC analyses are performed <strong>to</strong> gain detailed information at start-up or at lastingproblems in <strong>the</strong> process.6.3.3 Energy measurement for billing purposesThree methodologies are used <strong>to</strong> obtain <strong>the</strong> comptable data on <strong>the</strong> energy flow for billing purposes:• Volume measurement in combined with fixed data on energy content of <strong>the</strong> <strong>gas</strong>.This is <strong>the</strong> method used at small <strong>gas</strong> flows. There is a fixed price for a volume of <strong>gas</strong> during <strong>the</strong>whole payment period.• Volume measurement in combination with data on averaged energy values.This method is applied at larger <strong>gas</strong> flows with small fluctuations in <strong>the</strong> calorific value of <strong>the</strong> <strong>gas</strong>.• Volume measurement in combination with on-line measured energy values.This method is also applied at larger <strong>gas</strong> flows. Most <strong>gas</strong> production sites measure <strong>the</strong> maincomposition on-line, and <strong>the</strong>reby know <strong>the</strong> actual calorific value.Volume measurementTurbine <strong>gas</strong> meters (up <strong>to</strong> about 1000 m 3 /hour) perform most <strong>gas</strong> volume measurements. At largerflows accuracy becomes more important. On-line applying electronic pressure and temperaturesensors and an on-line data processor (above about 1000 m 3 /hour) perform corrections for pressureand temperature.At still larger flows and higher pressures also a correction for <strong>the</strong> compressibility is performed. Thiscompressibility is calculated <strong>from</strong> <strong>the</strong> expected <strong>gas</strong> composition. In most situations <strong>the</strong> additionalpage: 74
compressibility data are provided once a month by setting switches connected <strong>to</strong> <strong>the</strong> data processor(‘flow computer’).Only at very high <strong>gas</strong> flows (about above 100,000 m 3 /hour) an on-line signal is provided <strong>to</strong> <strong>the</strong> dataprocessor. These data can be supplied by <strong>the</strong> central control post, or derived <strong>from</strong> localcompositional measurements.Energy measurementThe energy content of <strong>the</strong> <strong>gas</strong> is obtained by on-line calorimeters or calculated <strong>from</strong> compositionaldata obtained by IR or GC analysis. Since compositional data are already indispensable for <strong>the</strong>process control, calorimeters are becoming obsolete.6.3.4 Standards and regulationsThe measurement methods are described in a large array of national and international standards.All measurements for <strong>the</strong> cus<strong>to</strong>dy transfer (e.g. volume flow, calorific value, composition analysis,and calculation methods) are standardised by <strong>the</strong> International Standard Organisation (ISO). Thedetermination of <strong>the</strong> o<strong>the</strong>r parameters is partly described in ISO standards. Most of <strong>the</strong> remainingdeterminations are described in DIN or ASTM standards. Table 31 lists <strong>the</strong> most importantstandards on <strong>gas</strong> quality control.Particles and impuritiesThe <strong>gas</strong> that is injected in<strong>to</strong> <strong>the</strong> <strong>grid</strong> must be ‘technically free’ <strong>from</strong> impurities and particles. Theterm ‘technically free’ means that <strong>the</strong> <strong>gas</strong> must be upgraded <strong>to</strong> a quality that does not cause anyoperation problems if it used in certified equipment. It is difficult <strong>to</strong> set any limits for impurities andparticles since <strong>the</strong>se parameters often are very difficult <strong>to</strong> measure. Therefore in some cases afiltration of <strong>the</strong> <strong>gas</strong> is prescribed and <strong>the</strong> mesh size of <strong>the</strong> filter is defined. In <strong>the</strong> Swedish standardfor bio<strong>gas</strong> as vehicle fuel, a filter with maximum 5 micron mesh size is prescribed and this filter mustbe placed as close as possible <strong>to</strong> <strong>the</strong> point of injection.page: 75
Descriptioncalculation of properties <strong>from</strong> compositionISO 6976 [lit.38] Natural <strong>gas</strong> - Calculation of calorific values, density, relativedensity and Wobbe index <strong>from</strong> composition.determination of compositionISO 6974 [lit.39] Natural <strong>gas</strong> – Determination of composition with defineduncertainty by <strong>gas</strong> chroma<strong>to</strong>graphyISO 6975 [lit.40] Natural <strong>gas</strong> - Extended analysisdetermination of sulphur compoundsISO 6326 [lit.41] Natural <strong>gas</strong> – Determination of sulphur compoundson-line measurement systemsISO 10723 [lit.42] Natural <strong>gas</strong> - Performance evaluation for on-line analyticalsystemsgeneral documents on <strong>gas</strong> measurementsDVGW G 261 [lit.23] Prüfung der Gasbeschaffenkeit (different parts)flow measurementDVGW G 492 [lit.43] Anlagen für die Gasmengenmessung (different parts)measurements for cus<strong>to</strong>dy transferDVGW G 685 [lit.44] Gasabrechnungmeasurement of propertiesISO 15970 [lit.45] Natural <strong>gas</strong> – Measurement of properties - VolumetricpropertiesISO 15971 [lit.46] Natural <strong>gas</strong> – Measurement of properties - CombustionpropertiesISO 15972 [lit.47] Natural <strong>gas</strong> – Measurement of properties - Single componentsand condensation propertiesTable 31:Most relevant standards used in Europe on <strong>the</strong> measurement of <strong>gas</strong>quantity and quality6.4 PROSPECTSThe major component of bio<strong>gas</strong> <strong>from</strong> anaerobic digestion is methane, <strong>the</strong> rest being primarilycarbon dioxide. The technical measures <strong>to</strong> upgrade, compress etc. this type of <strong>gas</strong> <strong>to</strong> a quality andstate which allows it <strong>to</strong> be safely introduced in<strong>to</strong> natural <strong>gas</strong> <strong>grid</strong>s are well established and proven.The required processes are removal of trace components and separation of methane and carbondioxide, respectively. Hence, <strong>the</strong>re are no technical roadblocks for upgrading this type of bio<strong>gas</strong>.Gas <strong>from</strong> <strong>gas</strong>ification processes (syn<strong>gas</strong>) contains only a minor amount of methane. Hence, before<strong>the</strong> upgrading process, <strong>the</strong> carbon monoxide and hydrogen components of <strong>the</strong> <strong>gas</strong> must bepage: 76
converted <strong>to</strong> a methane rich <strong>gas</strong>. After <strong>the</strong> conversion, <strong>the</strong> <strong>gas</strong> can be upgraded with <strong>the</strong> sameprocesses as <strong>gas</strong> <strong>from</strong> anaerobic digestion. All of <strong>the</strong> required sub-processes of converting syn<strong>gas</strong><strong>to</strong> pipeline quality <strong>gas</strong> are well established, but <strong>the</strong> entire process has not yet been demonstrated.Demonstration of this concept is required <strong>to</strong> pave <strong>the</strong> way for a future development <strong>to</strong>wards itsutilisation.The profitability of bio<strong>gas</strong> introduction in<strong>to</strong> <strong>the</strong> natural <strong>gas</strong> <strong>grid</strong> depends on a large number ofparameters like: operating costs and investment of <strong>the</strong> upgrading plant; <strong>the</strong> added value (sellingprice) of <strong>the</strong> upgraded <strong>gas</strong>; taxation policy; subsidies; and alternative options for utilisation of <strong>the</strong>bio<strong>gas</strong> (boiler, CHP, use in separate <strong>gas</strong> networks etc.). The possible lack of an economic incentivemight be one of <strong>the</strong> major roadblocks for a substantial utilisation of bio<strong>gas</strong> introduction in<strong>to</strong> <strong>the</strong>natural <strong>gas</strong> <strong>grid</strong>, since alternative options for utilisation in many cases will be more profitable.Taxation and subsidisation are possible <strong>to</strong>ols <strong>to</strong> promote bio<strong>gas</strong> introduction in<strong>to</strong> <strong>the</strong> natural <strong>gas</strong><strong>grid</strong>.Reluctance <strong>from</strong> <strong>gas</strong> cus<strong>to</strong>mers against <strong>gas</strong> originating <strong>from</strong> e.g. landfills, sewage or manure is apotential roadblock for adding upgraded <strong>gas</strong> <strong>to</strong> natural <strong>gas</strong> <strong>grid</strong>s. The reluctance can be based ontechnical or emotional arguments <strong>from</strong> e.g. private consumers using <strong>the</strong> <strong>gas</strong> in s<strong>to</strong>ves, or industrialclients using <strong>the</strong> <strong>gas</strong> for e.g. food production.Bio<strong>gas</strong> introduction in<strong>to</strong> <strong>the</strong> natural <strong>gas</strong> <strong>grid</strong> requires that <strong>the</strong> bio<strong>gas</strong> production is located near a<strong>gas</strong> pipeline. Transportation of <strong>the</strong> feeds<strong>to</strong>ck, of which <strong>the</strong> bio<strong>gas</strong> is produced, over large distancesis not suitable for economic and environmental reasons. A major share of <strong>the</strong> potential bio<strong>gas</strong>production is based on manure and waste products <strong>from</strong> <strong>the</strong> agricultural industry. Due <strong>to</strong> <strong>the</strong> natureof this industry, <strong>the</strong> bio<strong>gas</strong> production is often located in sparsely populated areas, which meansthat introduction of bio<strong>gas</strong> <strong>from</strong> <strong>the</strong>se sources in significant volumes requires a widely distributednatural <strong>gas</strong> <strong>grid</strong>, which is not present in all European countries.Even in cases where bio<strong>gas</strong> introduction in<strong>to</strong> <strong>the</strong> natural <strong>gas</strong> <strong>grid</strong> will <strong>the</strong> best option of utilisation for<strong>the</strong> bio<strong>gas</strong> plant, <strong>the</strong> incentive of <strong>the</strong> owner/opera<strong>to</strong>r of <strong>the</strong> natural <strong>gas</strong> <strong>grid</strong> might not be present.Missing regulation and legislation of access rights, transparent methods <strong>to</strong> calculate <strong>the</strong> networkopera<strong>to</strong>r’s costs etc. can also inhibit bio<strong>gas</strong> introduction in some cases.In order <strong>to</strong> promote investments in bio<strong>gas</strong> upgrading plants <strong>the</strong>re is a need <strong>to</strong> establish clearguidelines and regulations for <strong>the</strong> rights and obligations for <strong>the</strong> involved organisations, including <strong>the</strong>owners of <strong>the</strong> upgrading plants, <strong>grid</strong> owners, cus<strong>to</strong>mers (who buy <strong>the</strong> upgraded <strong>gas</strong>) etc. Thesemeasures are seen as parallel <strong>to</strong> <strong>the</strong> similar regulation for introduction of ‘green’ electricity <strong>to</strong> <strong>the</strong>power <strong>grid</strong>.page: 77
The possibility of adding off-spec <strong>gas</strong> <strong>to</strong> <strong>the</strong> <strong>grid</strong> lowers <strong>the</strong> upgrading costs significantly, and<strong>the</strong>refore promotes upgrading. However, off-spec delivery requires <strong>gas</strong> quality tracking and a closecommunication between <strong>the</strong> upgrading plant opera<strong>to</strong>r and <strong>the</strong> <strong>grid</strong> owner. Therefore, off-specdelivery is most suitable when <strong>the</strong> upgrading plant is owned and operated by <strong>the</strong> <strong>grid</strong> owner.page: 78
7 INTERNATIONAL PERSPECTIVE7.1 AVAILABILITY OF BIOMASS7.1.1 AustriaThe most common type of plants for bio<strong>gas</strong> production in Austria are digesters at municipal sewagewater cleaning facilities. Since it has become obvious that methane is accountable for a significantpart (13%) of <strong>the</strong> greenhouse effect caused by human activity, <strong>the</strong> recovery of bio<strong>gas</strong> gains specialimportance. Both recovery of landfill <strong>gas</strong> and <strong>the</strong> conversion of organic materials <strong>to</strong> bio<strong>gas</strong> areimportant for minimising methane emissions <strong>to</strong> <strong>the</strong> athmosphere. After a series of setbacks withbio<strong>gas</strong> plants in <strong>the</strong> early seventies <strong>the</strong>re have been several successful applications in Austria inrecent years which have contributed <strong>to</strong> <strong>the</strong> increased importance which bio<strong>gas</strong> technology enjoys<strong>to</strong>day.Bio<strong>gas</strong> in agricultureThe advantages of bio<strong>gas</strong> utilisation in agriculture are numerous: it represents a renewable energysource, an environmentally sound way of organic waste disposal and organic fertiliser production,and significantly reduces bad smell. Bio<strong>gas</strong> is typically utilised in combined heat and powerinstallations, whose excess power is fed in<strong>to</strong> <strong>the</strong> <strong>grid</strong>. Occasionally substances such as vegetableand o<strong>the</strong>r food residues or oil are added. In order <strong>to</strong> encourage <strong>the</strong> fur<strong>the</strong>r development of thispotential a fund has been set up <strong>to</strong> subsidise <strong>the</strong> installation of bio<strong>gas</strong> systems by agriculturalopera<strong>to</strong>rs.Landfill <strong>gas</strong> recoveryEven though <strong>the</strong> existing potential is far <strong>from</strong> being exhaustively utilised, landfill <strong>gas</strong> is continuallygaining in importance. Besides several smaller installations, <strong>the</strong> <strong>gas</strong> <strong>from</strong> Vienna's largest landfill atRautenweg has been recovered for energy production since 1991. This plant with an electric powercapacity of 8 MW is currently (1996) <strong>the</strong> largest in Europe [lit.48]. Bio<strong>gas</strong> is produced in 196 plantsof different kinds (1996). The distribution of plant types is shown in table 32.Plant typeNumberFarm plants 58Co-digestion plants 3Industrial plants 6Municipal sludge digesters 118Landfill <strong>gas</strong> recovery plants 11Total 196Table 32: Bio<strong>gas</strong> plants in Austria (1996)The most important renewable sources of energy are hydropower with a share of 13%, and <strong>the</strong> socalledo<strong>the</strong>r energy sources, which is mainly <strong>biomass</strong>, with also 13%. This puts Austria third inpage: 79
Europe among countries relying on environmentally sound energy sources. Within <strong>the</strong> EuropeanUnion only Finland and Sweden exceed Austria in <strong>the</strong> proportion of <strong>biomass</strong> used.Nearly 50% of <strong>the</strong> land area in Austria is forest and <strong>the</strong> amount of <strong>biomass</strong> per capita is very high.Biomass is widely used and <strong>the</strong> potential for <strong>biomass</strong> utilisation is increasing. The cost of woodchips in Austria is about 0.025 €/kWh.Production 2000ProductionResourcePJ/yearpotential 2005PJ/yearLandfill <strong>gas</strong>, bio<strong>gas</strong> 2 18Wood residues 26 46Black liquors 18 20Fire wood 95 95Straw 1 2Sewage sludge, household wastes 8 14Energy crops - 15Total <strong>biomass</strong> 150 210Table 33: Biomass potential in AustriaThe <strong>to</strong>tal <strong>biomass</strong> potential for Austria, based on annual growth and available collecting methods, isestimated at 692 PJ/year. This should be compared <strong>to</strong> <strong>the</strong> <strong>to</strong>tal energy consumption for Austria,which in 1995 was 1286 PJ. The <strong>to</strong>tal amount of imported energy, mainly as oil, was 829 PJ. Only0.3 PJ of <strong>biomass</strong> was imported. The distribution of types of land for <strong>biomass</strong> production is shown intable 34.Biomass potentialType of landPJ/yearForests 219Farmland 173Meadows and greenlands 300Total 692Table 34: Biomass potential <strong>from</strong> different land types in Austria2005UtilisationPJ/yearResidential heating 134District heating 17Industry 27Condensing power 13Au<strong>to</strong>motive fuels 4Total 195Table 35:Utilisation potentials of <strong>biomass</strong> in Austria for 2005 (not including sewage sludge andhousehold wastes)page: 80
7.1.2 DenmarkThe production of <strong>biomass</strong> in Denmark is indicated in table 36.PJ/yearContribution of<strong>biomass</strong> %Inputs <strong>to</strong> power generation 42 10Final energy consumption 23 6Total 65 7Table 36: Biomass production in Denmark (1997) [lit.49]Bio<strong>gas</strong> is produced at 20 large-scale plants and approximately 20 minor farm plants. The largescaleplants produced approximately 50 million m 3 of bio<strong>gas</strong> in 1998, corresponding <strong>to</strong> an energyproduction of approximately 1.2 PJ. The feeds<strong>to</strong>ck is primarily manure (82%) and industrial waste(16%) [lit.50].According <strong>to</strong> ‘Energy 21’ [lit.51], <strong>the</strong> use of <strong>biomass</strong> for energy purposes was expected <strong>to</strong> increase<strong>from</strong> 50 PJ <strong>to</strong> some 75 PJ in 1999. Biomass would <strong>the</strong>n comprise almost 10% of <strong>the</strong> <strong>to</strong>talconsumption of fuel in <strong>the</strong> year 2000.By 2012 sustainable energy resources are expected <strong>to</strong> account for approximately 120 PJ,corresponding <strong>to</strong> 15% of Denmark’s primary energy consumption of approximately 820 PJ. Among<strong>the</strong> sustainable energy resources, <strong>the</strong> consumption of solid <strong>biomass</strong>, i.e. straw (appr. 23 PJ), waste(appr. 32 PJ) and wood (appr. 23 PJ), is expected <strong>to</strong> make up approximately 80 PJ. According <strong>to</strong>‘Energy 21’, <strong>the</strong> consumption of renewable energy is expected <strong>to</strong> expand <strong>to</strong> approximately 100 PJ,corresponding <strong>to</strong> approximately 13% of <strong>the</strong> <strong>to</strong>tal energy consumption in 2005.The main part of <strong>the</strong> present exploitation of <strong>biomass</strong> takes place in plants which only produce heat.The objective of <strong>the</strong> development in <strong>the</strong> coming years is <strong>to</strong> increase <strong>the</strong> use of <strong>biomass</strong> in powerproducing plants. At <strong>the</strong> end of 2000 <strong>the</strong>re would still be large, unexploited quantities of raw materialfor use in plants using bio<strong>gas</strong>, landfill <strong>gas</strong>, and straw. The main part of <strong>the</strong> present wood resourceswill be exhausted, but it has been decided <strong>to</strong> increase Danish wood resources by afforestation. Inaddition, increased production of bio-energy, including energy crops, will be required <strong>to</strong> meet <strong>the</strong>demand for <strong>biomass</strong> after 2005. In <strong>the</strong> long term, stable supplies of <strong>biomass</strong> will depend on landuse.In <strong>the</strong> ‘Follow-up on Energy 21’ [lit.52] <strong>the</strong> new projection of energy consumption and CO 2emissions shows that <strong>the</strong>re is a deficit of some 3.5% in <strong>the</strong> national target (a 20% reduction in CO 2emissions in 2005 in relation <strong>to</strong> 1988 levels). In order <strong>to</strong> achieve <strong>the</strong> target in 2005, it is <strong>the</strong>reforenecessary <strong>to</strong> implement fur<strong>the</strong>r initiatives. According <strong>to</strong> <strong>the</strong> projected figures, <strong>the</strong> expansion of windturbines will be greater than expected, whereas <strong>the</strong> use of <strong>biomass</strong> will be somewhat less than inEnergy 21.page: 81
7.1.3 FinlandBio<strong>gas</strong> is mainly produced <strong>from</strong> water treatment plants in Finland. The animal raising farms arera<strong>the</strong>r small and located with fairly long distances between. Bio<strong>gas</strong> production <strong>from</strong> manure is<strong>the</strong>refore almost non-existent because of <strong>the</strong> current legislation, that allows cheaper ways <strong>to</strong> handleanimal manure. The common method of manure treatment is composting. ASJ S<strong>to</strong>rmossen bio<strong>gas</strong>plant in Vaasa, produces about 1.7 million m 3 bio<strong>gas</strong> per year (10,200 MWh) by processing<strong>biomass</strong>. Some experimental farm-scale bio<strong>gas</strong> plants processing animal manure are operating aswell.Plant typeNumberMunicipal sludge digesters 14Industrial plants 4Solid waste 1Landfill <strong>gas</strong> recovery plants 5Total 24Table 37: Bio<strong>gas</strong> plants in FinlandFinland possesses extensive <strong>biomass</strong> resources. They consist of forest-, peat- and agro-based<strong>biomass</strong>. Table 38 gives a summary of <strong>the</strong>se resources.ResourceProduction potentialPJ/yearFuel peat 169.6Forest residues 27.2Thinnings 25.5Bark 29.3 - 46.1Wood residues 12.6 - 16.7Black liquors 92.1 - 159.1Fire wood 50.2Reed canary grass 5.4Straw 5.9Wastes 20.9Total <strong>biomass</strong> 439 - 527Table 38: Biomass resources in FinlandUtilisation 2000(PJ/year)2010(PJ/year)Residential heating 43.4 41.8District heating 51.4 56.4Industry 207 247Condensing power 18.4 20.5Total 320 366Table 39: Annual utilisation potentials of <strong>biomass</strong> in FinlandThe <strong>to</strong>tal energy consumption in Finland (1998) was 1298 PJ. From this amount 70% was imported,mainly as coal, oil and natural <strong>gas</strong>. The cost of wood chips in Finland is 0.012 €/kWh.page: 82
7.1.4 FranceThe production of <strong>biomass</strong> in France is indicated in table 40.PJ/year Contribution of<strong>biomass</strong> %Production = Gross Inland440 4ConsumptionInputs <strong>to</strong> power generation 49 1Final energy consumption 391 6Table 40: Biomass production in France (1997)In France, 52 million <strong>to</strong>ns of slurry is produced annually by cattle (53%), pigs (42%) and poultry(5%). Currently, <strong>the</strong>re are only few manure based bio<strong>gas</strong> plants. The potential bio<strong>gas</strong> production is1 billion m 3 of methane, corresponding <strong>to</strong> 2% of <strong>the</strong> French natural <strong>gas</strong> consumption. Theexploitation of this potential requires <strong>gas</strong>-tight coverings <strong>to</strong> be installed on <strong>the</strong> slurry tanks. Thesetechniques are presently not utilised in France, but have been applied in Europe, particularly inDenmark, Germany and Italy. If all tanks have <strong>gas</strong>-tight coverings, 40% of <strong>the</strong> potential will beproduced [lit.53].There is a single bio<strong>gas</strong> plant based on domestic waste (at Amiens). In 2003, at least three moreplants are expected. The French policy is that waste <strong>biomass</strong> will not be landfilled beyond 2002[lit.54].7.1.5 GermanyThe production of <strong>biomass</strong> in Germany is indicated in table 41.PJ/year Contribution of<strong>biomass</strong> %Production = Gross Inland248 2ConsumptionInputs <strong>to</strong> power generation 74 2Final energy consumption 174 2Table 41: Biomass production in Germany (1997)Bio<strong>gas</strong> is produced at about 30 large-scale plants and approximately 770 small- <strong>to</strong> medium-scalefarm plants. About 350 small- <strong>to</strong> medium-scale plants are located in Bavaria, about 130 in Baden-Württemberg. The electricity <strong>from</strong> <strong>the</strong> large-scale plants fed in<strong>to</strong> <strong>the</strong> public <strong>grid</strong> amounts <strong>to</strong> over 300million kWh (1.1 PJ) per year, corresponding <strong>to</strong> about 100 *10 6 m 3 bio<strong>gas</strong>. The average installedpower in all bio<strong>gas</strong> plants is 60 kW el and <strong>the</strong> average digester volume 600 m 3 per bio<strong>gas</strong> plant,providing a <strong>to</strong>tal installed power of about 48 MW el . All digesters produce about 250 * 10 6 m 3 bio<strong>gas</strong>per year. Most of <strong>the</strong> engineers, construction companies, bio<strong>gas</strong> plant opera<strong>to</strong>rs, many interestedscientists and private persons are organised in <strong>the</strong> Fachverband Bio<strong>gas</strong>.page: 83
Figure 18: Distribution of capacity of installed electrical power by scaleSource: Fachverband Bio<strong>gas</strong> e.V.The German Federal Office for Agriculture & Food (FOAF) has agreed on practicable legalrequirements <strong>to</strong> grow energy crops on set-aside-land (Stillegungsflächen). FOAF finally approved aprocedure of scrutinization of non-food utilization, which was acceptable <strong>to</strong> <strong>the</strong> farmers. In 2000,about 164 farmers digested energy crops (80% of it is silo maize) grown on a <strong>to</strong>tal area of 970 ha.Compared <strong>to</strong> 1999, <strong>the</strong> increase is about 400%. A fur<strong>the</strong>r steep growth may be anticipated [lit.55].The potential bio<strong>gas</strong> production <strong>from</strong> anaerobic digestion is indicated in table 42. The feeds<strong>to</strong>cksources <strong>from</strong> manure, waste and energy crops are shown in detail in table 43.Source10 9 m 3 per year PJ/year 1)Agriculture 15.05 324Sewage sludge 1.05 23Communal biowaste 1.23 26Industry trade 0.18 4Total 17.50 3761): Assuming an average lower heating value of 21.5 MJ/m 3 (60% CH 4 , 40% CO 2 ).Table 42: Potential bio<strong>gas</strong> production <strong>from</strong> anaerobic digestion in Germany [lit.56]page: 84
Source10 9 m 3 per yearPJ/year 1)Manure 3.40 73Waste <strong>from</strong> agro-industrial sec<strong>to</strong>r 2.00 43Biowaste, domestic 0.85 18Biowaste, industrial 0.42 9Energy crops (300,000 ha, 36 t/ha) 1.60 34Total 8.27 1781): Assuming an average lower heating value of 21.5 MJ/m 3 (60% CH 4 , 40% CO 2 ).Table 43: Potential bio<strong>gas</strong> production <strong>from</strong> manure, waste and energy crops in Germany [lit.56]The German Bio<strong>gas</strong> Association estimates that a bio<strong>gas</strong> potential of 10 GWh in 2020 is realistic[lit.57].7.1.6 The Ne<strong>the</strong>rlandsIn <strong>the</strong> Ne<strong>the</strong>rlands most economically viable sources are used. Established application areas are:• Cleaning of industrial waste stream containing organic material• Sewage treatment plants• Landfills• Refuse burning facilities• Co-firing at power production• Production of syn<strong>gas</strong> for power productionIn 1998, nearly 38 PJ of energy was produced by anaerobic digestion in 225 installations. Also inthis year 44 landfill locations produced 1,3 PJ of energy.There are about fifty projects in study, often enlarging <strong>the</strong> current scope on <strong>biomass</strong> utilisation forenergy production. Since most easy <strong>to</strong> use <strong>biomass</strong> sources are depleted, new technologies are <strong>to</strong>be developed <strong>to</strong> utilise <strong>biomass</strong> and waste of a lower quality.NOVEM maintains since Oc<strong>to</strong>ber 1999 an internet site (www.biomaster.nl) for indicating <strong>the</strong>available amounts and prices of <strong>biomass</strong> and organic waste as far as available in <strong>the</strong> Ne<strong>the</strong>rlands.This site gives also entrance <strong>to</strong> an experimental <strong>biomass</strong> exchange bourse.Table 44 shows <strong>the</strong> costs of <strong>biomass</strong> by 2000. The current trade value of natural <strong>gas</strong> and <strong>the</strong>potential value of sustainable <strong>gas</strong> are also inserted in this table. Biomass that is more expensivethan natural <strong>gas</strong> cannot compete with natural <strong>gas</strong>. The higher price paid for sustainable <strong>gas</strong> resultsonly in a slight increase in <strong>the</strong> availability of <strong>biomass</strong> for an economical utilisation.page: 85
Calorific Availability Market priceValueGJ/<strong>to</strong>n k<strong>to</strong>n/year PJ/year €/<strong>to</strong>n €/GJMaterialSewage residues 1.5 630 0.9 -50 -34Industrial waste 5.3 2079 10.9 -82 -16Building and demolition residues 5.4 1275 6.9 -82 -15Sanitation residues 3.0 41 0.1 -32 -11Swill 3.4 0 0.0 -32 -9Kitchen and garden residues 3.4 100 0.3 -32 -9Office, shops and services waste 9.5 1949 18.6 -82 -9Residential waste 9.9 3495 34.7 -82 -8Oversized household garbage 10.8 643 7.0 -82 -8Roadside grass 5.3 468 2.5 -36 -7Shredder refuse 15.7 177 2.8 -68 -4Rags 14.3 15 0.2 -45 -3Plastics 34.4 0 0.0 -90 -3Car tires 35.2 27 1.0 -57 -2Waste paper 10.0 0 0.0 -16 -2Chicken manure 6.6 1500 10.0 -10 -2Clean wood residues 15.6 270 4.2 -14 -1Hemp and flax residues 11.3 29 0.1 0 0Wood <strong>from</strong> horticulture 10.2 100 1.0 0 0Used wood 15.4 400 6.2 11 1Animal residues <strong>from</strong> <strong>the</strong> food4.0 1486 5.9 5 1industryForestry wastes 10.2 425 4.3 14 1Non animal wastes <strong>from</strong> <strong>the</strong> food3.9 48 0.2 14 4industryHay <strong>from</strong> grass seed cultivation 12.7 0 0.0 65 5Miscanthus 13.2 1 0.0 72 5Short rotational wood 10.2 2 0.0 57 6Rape seed residues 13.6 150 0.0 100 7Straw <strong>from</strong> oat cultivation 13.3 1500 0.0 100 8Rape seed 15.8 - - 718 45Sub-<strong>to</strong>tal 15,136 115.9Manure <strong>from</strong> cattle and pigs -1.0 15,000 n.a. -11 n.a.<strong>to</strong>tal 30,136Table 44: Biomass production in <strong>the</strong> Ne<strong>the</strong>rlands (TNO-report) in 2000. Data in this table are takenas neat heating value. Therefore a negative figure is obtained for manure.A recent report [lit.58] summarises <strong>the</strong> availability of <strong>biomass</strong> for energy production in <strong>the</strong>Ne<strong>the</strong>rlands. The gross production of <strong>biomass</strong> and organic waste in <strong>the</strong> year 2000 amounts <strong>to</strong> 222PJ (neat heating value). This <strong>to</strong>tal production will not show an important change in <strong>the</strong> future. In <strong>the</strong>utilisation <strong>the</strong>re is a tendency that low value biological materials are used for high value applicationsas packaging or construction material. Also recycling, for example of paper and chipboard, reduces<strong>the</strong> availability for energy production.page: 86
The availability of <strong>biomass</strong> <strong>to</strong> produce <strong>gas</strong> for addition <strong>to</strong> <strong>the</strong> <strong>grid</strong> is also reduced by competing<strong>biomass</strong> <strong>to</strong> energy conversion options. For example co-firing of <strong>biomass</strong> with coal or natural <strong>gas</strong> ishighly attractive by <strong>the</strong> low investment and maintenance cost while <strong>the</strong>re is an attractive market forgreen electricity.AmountPJ/yearyear 2000 2020Total produced <strong>biomass</strong> and organic waste 222 notindicatedUsed o<strong>the</strong>rwise or not fit for conversion <strong>to</strong> energy 106 notindicatedAvailable for energy production 116 235Utilised for energy production 65 164Unused potential for energy production 51 71Net import of energy <strong>from</strong> <strong>biomass</strong> 0 0Table 45: Current (2000) and projected (2020) <strong>biomass</strong> utilisation in <strong>the</strong> Ne<strong>the</strong>rlands [lit.58]Future availability of <strong>biomass</strong> for energy productionThe available amount of <strong>biomass</strong> completely allows <strong>the</strong> production of energy <strong>from</strong> <strong>biomass</strong> asprojected by <strong>the</strong> government (in <strong>the</strong> year 2020 of 120 PJ - on <strong>the</strong> basis of avoided primary energy)[lit.59].The import of <strong>biomass</strong> opens a still wider perspective for <strong>the</strong> production of sustainable energy. Thisimport can be reached by physical import of <strong>biomass</strong> <strong>from</strong> abroad. The o<strong>the</strong>r possibility is <strong>the</strong> virtualimport of <strong>biomass</strong>. The forms of this virtual import are still in development.The most convincing way for <strong>the</strong> virtual import is buying bio-energy <strong>from</strong> a foreign producer. In 2004latest it will be possible for all electricity and <strong>gas</strong> users <strong>to</strong> buy <strong>the</strong>se products <strong>from</strong> any producer.Current green energy providers in <strong>the</strong> Ne<strong>the</strong>rlands already buy green energy at foreign suppliers. Inthis case <strong>the</strong> supplier will physically feed <strong>the</strong> energy <strong>to</strong> <strong>the</strong> European <strong>grid</strong>.Ano<strong>the</strong>r form is <strong>the</strong> application of <strong>the</strong> flexible mechanisms as provided in <strong>the</strong> Kyo<strong>to</strong> pro<strong>to</strong>col. It maybe expected that <strong>the</strong> use of <strong>biomass</strong> as an energy source will be characterised as a reduction of <strong>the</strong>greenhouse <strong>gas</strong> emissions. In <strong>the</strong> flexible mechanisms <strong>the</strong>re is no need for a physical delivery ofgreen energy <strong>to</strong> <strong>the</strong> European <strong>grid</strong>.7.1.7 SwedenThe bio<strong>gas</strong> production in Sweden origins mainly <strong>from</strong> waste water treatment plants. Most of <strong>the</strong>plants are treating sewage water <strong>from</strong> households, but <strong>the</strong>re are some fairly big industrialinstallations at paper mills and sugar beet refineries.page: 87
Many landfills are equipped with <strong>gas</strong> recovery systems. The large landfill <strong>gas</strong> installations were builtin <strong>the</strong> late 1980’s for energy recovery purpose. Smaller landfills have been de<strong>gas</strong>sed during <strong>the</strong>following years <strong>to</strong> meet environmental goals.Co-digestion started with some sewage water treatment plants that were designed for <strong>the</strong> handlingof liquid industrial wastes. In <strong>the</strong> late 1990’s <strong>the</strong> interest for co-digestion of wastes and manure as awaste management method started <strong>to</strong> increase and is still growing. The number of plants hasdoubled in <strong>the</strong> last five years and many more are planned for.Type of bio<strong>gas</strong> plant Number Production(PJ/year)Waste water treatment plants 134 2.92Landfill plants 60 1.55Industrial waste treatment plants 8 0.32Centralised bio<strong>gas</strong> plants, co-digestion 8 0.15Farm-scale plants 6 < 0.04Total 215 4.98Table 46: Bio<strong>gas</strong> plants and production in SwedenSweden has large <strong>biomass</strong> resources. They consist of forest, peat and agro based <strong>biomass</strong>. Morethan 50% of <strong>the</strong> land area in Sweden is forest and almost 25% of <strong>the</strong> area consists of peat deposits.The <strong>to</strong>tal amount of peat in Sweden is calculated <strong>to</strong> more than 100 Gm 3 . This can be compared <strong>to</strong><strong>the</strong> world <strong>to</strong>tal peat production in 1996 that was 140 Mm 3 . Farming of energy crops for bio<strong>gas</strong>production is very small <strong>to</strong>day, but <strong>the</strong> potential is in <strong>the</strong> range of 20 <strong>to</strong> 55 PJ/year. Energy crops arestill <strong>to</strong>o expensive <strong>to</strong> be utilised as raw material for bio<strong>gas</strong> production. This is due <strong>to</strong> <strong>the</strong>comparatively low prices on energy, especially electricity, in Sweden. Table 47 gives a summary of<strong>the</strong>se resources.ResourceProduction potential,PJ/yearFuel peat 43Wood fuels 470Black liquors 120Manure 9Energy crops 79Straw 16Household wastes 21Wastes 54Total <strong>biomass</strong> 812Table 47: Potential <strong>biomass</strong> resources in Sweden 2020page: 88
Production potential,ResourcePJ/yearManure 9Energy crops 35Straw 1Household wastes 9Wastes 25Total bio<strong>gas</strong> 79Table 48: Potential bio<strong>gas</strong> production <strong>from</strong> anaerobic digestion in Sweden 2020The main producers of <strong>biomass</strong> as energy source are <strong>the</strong> forest related industries, that is paper andsaw mills as well as production units for furniture and construction materials. These industries alsohave <strong>the</strong> largest utilisation of <strong>biomass</strong> energy.District heating is widely spread in Sweden and an increasing amount of <strong>biomass</strong> is being utilised indistrict heating plants. His<strong>to</strong>rically, single houses in Sweden have been wood fired. This hasbecome a problem because of emissions of aromatic and o<strong>the</strong>r hydrocarbons. The traditional s<strong>to</strong>veor boiler was regulated by throttling <strong>the</strong> air supply. This results in <strong>gas</strong>ification of <strong>the</strong> fuel at reducedloads. New equipment with modern combustion systems are introduced <strong>to</strong> <strong>the</strong> market and anincreased use of wood fuels for residential heating is predicted.Utilisation1996PJ/year2010PJ/yearResidential heating 43 70District heating 83 140Industry 176 200Condensing power 11 35Total 313 445Table 49: Annual utilisation potential of <strong>biomass</strong> in SwedenThe <strong>to</strong>tal energy consumption in Sweden 1999 was 1,753 PJ. This amount equals 2,257 PJ if <strong>the</strong>heat losses <strong>from</strong> <strong>the</strong> nuclear power plants are accounted for. The Swedish wood chip price isnormally in <strong>the</strong> interval 0.010 - 0.014 €/kWh.7.1.8 SwitzerlandBio<strong>gas</strong> production in Switzerland has a relatively long tradition in waste water treatment. The firstanaerobic digesters were built in <strong>the</strong> thirties for <strong>the</strong> stabilization of sewage sludge. Initially <strong>the</strong>bio<strong>gas</strong> was flared. Sometimes perfumes had <strong>to</strong> be added in order <strong>to</strong> prevent complaints <strong>from</strong> <strong>the</strong>neighbourhood about odour nuisances.However, <strong>the</strong> first plants, operated primarely for <strong>the</strong> sake of energy production, were constructed inagriculture in <strong>the</strong> seventies. Swiss farmers were among <strong>the</strong> first in Europe who started <strong>to</strong> buildbio<strong>gas</strong> plants after <strong>the</strong> first energy crisis. Digesters were optimally farm integrated and adapted <strong>to</strong>page: 89
<strong>the</strong> type and volume of <strong>the</strong> respective farm waste. Hence, every installation was unique and pricesremained ra<strong>the</strong>r high with <strong>the</strong> consequence that with <strong>the</strong> decreasing prices of <strong>the</strong> oil <strong>the</strong>construction of new installations came <strong>to</strong> a halt.Since 1990, when Switzerland started <strong>to</strong> promote renewable energy again within <strong>the</strong> program‘Energy 2000’, a few new plants were erected digesting bio- and food wastes <strong>to</strong>ge<strong>the</strong>r with manure.Agricultural bio<strong>gas</strong> installationsThe first agricultural bio<strong>gas</strong> plants in Swiss agriculture were constructed right after <strong>the</strong> first energycrisis in <strong>the</strong> year 1973. The second crisis boosted <strong>the</strong> number of plants <strong>from</strong> 15 in 1980 up <strong>to</strong>approx. 130 in 1983. The maximum number was reached in 1985 with 140 plants. Some of <strong>the</strong>pioneer plants were closed down and a few new digesters have been built since <strong>the</strong>n.Today less than 70 farm-scale bio<strong>gas</strong> plants are in operation in Switzerland. Three installations aretreating solid waste, all <strong>the</strong> o<strong>the</strong>rs are running on liquid manure with addition of chopped straw (1.5<strong>to</strong> 3 kg per animal and day). One of <strong>the</strong> solid waste digesters is a four vessel batch system made ofprefabricated, concrete side walls with a sandwich insulation and a floating plastic cover. A secondone is an upright cylindrically shaped, continuous flow reac<strong>to</strong>r where <strong>the</strong> waste is pumped upwardsthrough an inner cylinder and flowing down by gravity through an outer cylinder. The third and lastsolid waste digester is a down-flow pilot plant of 10 m 3 operated by Nova Energie at <strong>the</strong> SwissFederal Research Station, FAT in Tänikon.Except for five, all of <strong>the</strong> liquid digesters are operated in a continuous flow mode. The predominantconstructions are ei<strong>the</strong>r upright cylinders made of concrete or glass fiber reinforced plastic, or sunkin ground concrete digesters of ei<strong>the</strong>r rectangular or cylindrical shape. The digester volumes range<strong>from</strong> 30 m 3 <strong>to</strong> over 600 m 3 . All of <strong>the</strong> digesters are stirred mechanically. Some of <strong>the</strong>m areconnected <strong>to</strong> s<strong>to</strong>rage tanks covered with <strong>gas</strong> tight plastic membranes s<strong>to</strong>ring at <strong>the</strong> same time <strong>the</strong><strong>gas</strong> <strong>from</strong> <strong>the</strong> reac<strong>to</strong>r and <strong>the</strong> <strong>gas</strong> produced during post fermentation in <strong>the</strong> s<strong>to</strong>rage tank.The five systems not fed continuously as mentioned above are so-called accumulation systemswhere <strong>the</strong> <strong>gas</strong>-tight and insulated s<strong>to</strong>rage tank is heated, thus serving at <strong>the</strong> same time as reac<strong>to</strong>r.All but one bio<strong>gas</strong> system are operated on individual farms. Centralized anaerobic digestion is notcommon at all. The only two central bio<strong>gas</strong> plants serving two respectively three farmers are codigestingslurry with vegetable and source separated organic waste and manure.Originally, <strong>the</strong> major motivation for <strong>the</strong> construction of <strong>the</strong> plants was ‘energetical independence’followed by ‘improvement of <strong>the</strong> fertilizer quality’. In recent years however, <strong>the</strong> two priorities wereexchanged. The production of electricity became important when <strong>the</strong> price was fixed <strong>to</strong> CHF 0.16per kWh for renewable energy.page: 90
Bio<strong>gas</strong> plants in SwitzerlandNumber ProductionType of bio<strong>gas</strong> plantPJ/yearWaste water treatment plants 110 2.20Biomass plants 8 0.17Industrial waste treatment plants 25 0.18Farm-scale plants 64 0.05Total 204 2.60Table 50: Bio<strong>gas</strong> plants and production in Switzerland (1998)30% Of <strong>the</strong> land area in Switzerland is forest and 38% is agricultural land. This means thatSwitzerland has a large <strong>biomass</strong> potential. The most commonly used <strong>biomass</strong> is fire wood. Fromagriculture mainly manure is utilised for bio<strong>gas</strong> production.Although Switzerland is a country with large <strong>biomass</strong> resources, <strong>biomass</strong> plays a minor role in <strong>the</strong>energy sec<strong>to</strong>r.ResourceConsumption,PJ/yearCoal 4Petroleum519Natural <strong>gas</strong> 91Hydroelectric power 100Nuclear power 72Wood 21O<strong>the</strong>r renewable 6O<strong>the</strong>r (Solar/Wind waste heat etc) 34Total 847Table 51: Primary energy consumption in Switzerland (1998)7.2 EXAMPLES OF PIPELINE QUALITY GAS FROM BIOMASS BY COUNTRY7.2.1 AustriaThere are currently no upgrading plants in operation in Austria.7.2.2 DenmarkThere are currently no upgrading plants in operation in Denmark. Pilot tests with membraneupgrading has been conducted, but <strong>the</strong> <strong>gas</strong> is not utilised [lit.17,60].7.2.3 FinlandThere are currently no upgrading plants in operation in Finland.page: 91
7.2.4 FranceThere are currently no examples of introduction of upgraded bio<strong>gas</strong> <strong>to</strong> <strong>the</strong> natural <strong>gas</strong> <strong>grid</strong>. Theupgrading plants in France are shown in table 52.LocationFeeds<strong>to</strong>ck andtechnologyCapacitym3/hStatusChambéry Sewage sludge:30 Not in operationWater scrubbinganymoreLilleSewage sludge:100 In operation sinceWater scrubbing1995ToursLandfill <strong>gas</strong>:200 In operation sinceWater scrubbing1994Montech Landfill <strong>gas</strong> 500 Established in 1998.Not in operation *)Utilisation of upgraded<strong>gas</strong>Vehicle fuelVehicle fuel (buses)Vehicle fuelInjection in natural <strong>gas</strong><strong>grid</strong>*): The French authorities have not authorised injection because of possible contamination (VOC).Table 52: Upgrading of bio<strong>gas</strong> in France [lit.13,54]7.2.5 GermanyThe his<strong>to</strong>ry of bio<strong>gas</strong> technology in Germany started with production of bio<strong>gas</strong> in sewage treatmentplants. From <strong>the</strong> middle of <strong>the</strong> 1930’s <strong>to</strong> <strong>the</strong> middle of <strong>the</strong> 1960’s bio<strong>gas</strong> in many large sewagetreatment plants was upgraded and used as ‘bio-natural <strong>gas</strong>’ as fuel in car engines. Peakproduction of upgraded bio<strong>gas</strong> for fuel and injection in<strong>to</strong> <strong>the</strong> natural <strong>gas</strong> pipeline <strong>grid</strong> was reachedduring <strong>the</strong> second world war and after 1950. Under those conditions, a high viability for upgradedbio<strong>gas</strong> was achieved. Important water associations were Emschergenossenschaft, Ruhrverband,Wupperverband, Niersverband [lit.61,62]. The Niersverband, for example, produced up <strong>to</strong> 6.7 millionm 3 bio<strong>gas</strong> per year up <strong>to</strong> 1955 for vehicle fuel and as CNG in cylinders sold <strong>to</strong> households.After a break of about 20 years, two sewage treatment plants constructed upgrading plants/<strong>gas</strong>separation plants for feeding <strong>the</strong> upgraded bio<strong>gas</strong> in<strong>to</strong> <strong>the</strong> respective natural <strong>gas</strong> <strong>grid</strong>. In Stuttgart-Muhlhausen, bio<strong>gas</strong> was upgraded <strong>to</strong> H-<strong>gas</strong>, in Viersen <strong>to</strong> L-<strong>gas</strong>. "One of <strong>the</strong> upgradingrequirements was that many consumers got access <strong>to</strong> <strong>the</strong> bio<strong>gas</strong> energy. Thus it was ensured tha<strong>to</strong>n an annual average an even and high share of <strong>the</strong> excess <strong>gas</strong> could be recovered“ [lit.63].In <strong>the</strong> central sewage plant at Stuttgart-Muhlhausen a EU demonstration project on energy savingand alternative energy sources was conducted. It was <strong>the</strong> first upgrading plant in <strong>the</strong> world usingMEA (Monoethanolamine) for absorption of CO 2 and H 2 S. The capacity was 500 m 3 crude bio<strong>gas</strong>per hour, investment was 0.77 M€, amortisation about 10 years. The <strong>gas</strong> was sold for 0.21 €/m 3 .This plant successfully operated <strong>from</strong> 1984 <strong>to</strong> <strong>the</strong> end of 1999.page: 92
The second plant using water as absorbent operated <strong>from</strong> 1982 <strong>to</strong> <strong>the</strong> end of 1998 and was locatedin <strong>the</strong> sewage treatment plant of <strong>the</strong> Niersverband in Viersen near Moenchengladbach with 700,000inhabitant equivalents. This plant, a pilot plant sponsored by <strong>the</strong> former BMFT (German FederalMinistry of Research and Technology), had a capacity of 450 m 3 crude bio<strong>gas</strong> per hour. CO 2 wasabsorbed in water at a pressure of 10 bar. The methane content of <strong>the</strong> upgraded bio<strong>gas</strong> was about91%, <strong>the</strong> H 2 S-content < 5 mg/m_, <strong>the</strong> Wobbe index W o 45,39 MJ/m_, <strong>the</strong> dewpoint - 5 °C at 1 bar.The <strong>gas</strong> was injected in<strong>to</strong> <strong>the</strong> natural <strong>gas</strong> <strong>grid</strong> of Willich municipality, which served 30,000inhabitants with 16.5 million m 3 natural <strong>gas</strong> per year.There are currently no examples of introduction of upgraded bio<strong>gas</strong> <strong>to</strong> <strong>the</strong> natural <strong>gas</strong> <strong>grid</strong>.7.2.6 The Ne<strong>the</strong>rlandsThere are five locations where <strong>gas</strong> <strong>from</strong> <strong>biomass</strong> is added <strong>to</strong> <strong>the</strong> <strong>gas</strong> <strong>grid</strong> (table 53). This additionwas quite successful at natural <strong>gas</strong> prices near 25 €ct/m 3 in <strong>the</strong> years 1986 - 1990. As aconsequence of lowering <strong>gas</strong> prices, new projects became less attractive. With <strong>the</strong> introduction of<strong>the</strong> green electricity concept in 1998 it became more profitable <strong>to</strong> convert <strong>the</strong> <strong>biomass</strong> <strong>to</strong> greenelectricity. Currently it is by far more profitable <strong>to</strong> produce green electricity than <strong>to</strong> produce a <strong>gas</strong><strong>from</strong> <strong>biomass</strong> that only replaces natural <strong>gas</strong>.Location• Opera<strong>to</strong>rTilburg• SMB• EssentNuenen• Carbio<strong>gas</strong>• EssentWijster• VAM• EssentVasse• COGASWolvega• EssentFeeds<strong>to</strong>ck and technologyCapacityStatusm 3 /houtputlandfill <strong>gas</strong>: input 1400 m 3 /h on line 1986<strong>gas</strong> <strong>from</strong> <strong>biomass</strong>: input 560 m 3 /h on line 1994sewage <strong>gas</strong>: input 40 m 3 /h also used for electricitygenerationcarbon dioxide removal with water wash 1200 on line 1986landfill <strong>gas</strong>:3000 in production since 1986carbon dioxide removal with pressureswing absorptionlandfill <strong>gas</strong>:4000 in production since 1986carbon dioxide removal with pressureswing absorptionlandfill <strong>gas</strong>:300 Producing 1992 - 1998carbon dioxide removal with membraneseparationlandfill <strong>gas</strong>:1800 Producing since 1993carbon dioxide removal with membraneseparationTable 53: Survey of <strong>the</strong> locations in <strong>the</strong> Ne<strong>the</strong>rlands where bio<strong>gas</strong> is added <strong>to</strong> <strong>the</strong> <strong>grid</strong>page: 93
7.2.7 SwedenBio<strong>gas</strong> as a fuel for vehicles has become very popular in Sweden. The reason for this is mainly that<strong>the</strong> value of bio<strong>gas</strong> is greatly increased if it is upgraded and utilised as a replacement for petrol ordiesel oil. Bio<strong>gas</strong> as a vehicle fuel is free <strong>from</strong> fuel tax and thus competitive <strong>to</strong> <strong>the</strong> traditional fuels.Many communities have invested in upgrading plants for bio<strong>gas</strong> and still more are planning forbio<strong>gas</strong> production and/or vehicle fuel production.The existing upgrading plants are shown in table 54.Plant location Upgrading process Bio<strong>gas</strong> source Capacitym 3 /hEslövWater scrubbing, Sewage sludgesingle pass process digesterGöteborg PSA Sewage sludgedigesterHelsingborg PSA Co-digestionplantJönköping Water scrubbing, Sewage sludgeKalmarsingle pass processWater scrubbing,recirculating processKristianstad Water scrubbing,single pass processLaholmSelexol scrubbingLinköping Water scrubbing,recirculating processS<strong>to</strong>ckholmWater scrubbing,single pass processS<strong>to</strong>ckholmPSATrollhättanUppsalaWater scrubbing,recirculating processWater scrubbing,recirculating processdigesterCo-digestionplant/ Sewagesludge digesterSewage sludgedigesterCo-digestionplantCo-digestionplantSewage sludgedigesterSewage sludgedigesterSewage sludgedigesterCo-digestionplant/Sewagesludge digesterTable 54: Upgrading plants in Sweden (2000)Started inUtilisation ofupgraded <strong>gas</strong>Comment12/70 1997/1999 Vehicle fuel Pilot plant/full-scale15 1992/1994 Vehicle fuel Reconstructed20 1997 Vehicle fuel150 2000 Vehicle fuel70 1998 Vehicle fuel175 1999 Vehicle fuel250 2000 Natural <strong>gas</strong>/vehicle fuel660 1997 Vehicle fuel55 1996 Vehicle fuel700 2001 Vehicle fuel Starting up140 1996 Vehicle fuel200 1997 Vehicle fuelOnly one of <strong>the</strong> above plants is injecting upgraded <strong>gas</strong> in<strong>to</strong> <strong>the</strong> natural <strong>gas</strong> <strong>grid</strong>. The Laholm plant isproducing natural <strong>gas</strong> quality <strong>from</strong> bio<strong>gas</strong> by upgrading bio<strong>gas</strong> and adding propane <strong>to</strong> correct heatvalue. The Wobbe index is also within specifications for natural <strong>gas</strong> in Sweden.In Go<strong>the</strong>nburg bio<strong>gas</strong> is injected in<strong>to</strong> a <strong>to</strong>wn <strong>gas</strong> <strong>grid</strong>. The bio<strong>gas</strong> is not upgraded but used as <strong>to</strong>wn<strong>gas</strong> for households. The energy amount of <strong>the</strong> bio<strong>gas</strong> is registered on a per year basis. Natural <strong>gas</strong>,<strong>to</strong> that amount of energy, can <strong>the</strong>n be utilised as a vehicle fuel without fuel tax.7.2.8 SwitzerlandGas as a fuel for vehicles is becoming more and more popular in Switzerland. The <strong>gas</strong> fuelledvehicles are mainly normal cars and not so many trucks and buses. Both natural <strong>gas</strong> and bio<strong>gas</strong> isutilised as vehicle fuel.page: 94
Bio<strong>gas</strong> is fed in<strong>to</strong> <strong>the</strong> natural <strong>gas</strong> <strong>grid</strong> at two sites. One is a low pressure branch of <strong>the</strong> <strong>grid</strong> and <strong>the</strong>bio<strong>gas</strong> is <strong>the</strong>refore upgraded with PSA technology <strong>to</strong> meet <strong>the</strong> natural <strong>gas</strong> specifications. The o<strong>the</strong>rsite is at <strong>the</strong> high pressure transmission <strong>grid</strong> and here <strong>the</strong> bio<strong>gas</strong> is added <strong>to</strong> <strong>the</strong> <strong>grid</strong> withoutupgrading. This is due <strong>to</strong> <strong>the</strong> very small percentage <strong>the</strong> bio<strong>gas</strong> adds <strong>to</strong> <strong>the</strong> natural <strong>gas</strong> so <strong>the</strong>re isno need for upgrading.Three bio<strong>gas</strong> plants, utilising <strong>biomass</strong>, in Switzerland have filling stations for <strong>gas</strong>. There are noexplicit data available about <strong>the</strong> upgrading technique, but PSA seens <strong>to</strong> be <strong>the</strong> most commontechnology in Switzerland.A pilot project concerning bio<strong>gas</strong> upgrading has been conducted. The project was divided in<strong>to</strong> twostages. The stage 1 pilot plant was constructed at <strong>the</strong> bio<strong>gas</strong> plant in Rümlang. The upgradingmethod was water scrubbing and <strong>the</strong> plant was started in 1993. The capacity was 12 m 3 /h. The <strong>gas</strong>quality was not as good as expected. The specifications could hardly be met. The energyconsumption for <strong>the</strong> upgrading process equalled one third of <strong>the</strong> <strong>gas</strong> energy in <strong>the</strong> upgradedmethane <strong>gas</strong>. In stage 2 a PSA plant was built at <strong>the</strong> Bachenbülach bio<strong>gas</strong> plant in 1995 with acapacity of 26 m 3 /h. This plant had no problems in meeting <strong>the</strong> quality specifications and <strong>the</strong> energydemand for <strong>the</strong> upgrading process was only 8% of <strong>the</strong> heat value of <strong>the</strong> upgraded <strong>gas</strong>. Theinvestment cost for <strong>the</strong> PSA plant was almost one third lower than for <strong>the</strong> water scrubbing plant,even since <strong>the</strong> PSA plant had more than <strong>the</strong> double capacity.Filling stations in Switzerland are of two main types. Fast filling with compressor and high pressures<strong>to</strong>rage tanks for <strong>gas</strong>, and overnight filling equipment where <strong>the</strong> compressor is filling directly in<strong>to</strong> <strong>the</strong>vehicle. These slow filling stations are sold for <strong>the</strong> use of one or only a few vehicles at a time andhave a trademark of ‘FuelMaker’. The number of fast filling stations is increasing at this moment.7.3 POLICY7.3.1 EuropeDirective on natural <strong>gas</strong>The access of fuel <strong>gas</strong>es <strong>to</strong> <strong>the</strong> European market is regulated in <strong>the</strong> 1998 EU directive ‘Commonrules for <strong>the</strong> internal market in natural <strong>gas</strong>’ [lit.33]. This directive sets <strong>the</strong> right of any producer <strong>to</strong> sellhis fuel <strong>gas</strong> <strong>to</strong> any client in Europe. This directive is limited <strong>to</strong> natural <strong>gas</strong>. Liquefied natural <strong>gas</strong>(LNG) and <strong>gas</strong>es <strong>from</strong> natural <strong>gas</strong> s<strong>to</strong>rages are explicitly included in this directive. Gases <strong>from</strong><strong>biomass</strong>, organic waste, coal or oil are not explicitly mentioned.It is left <strong>to</strong> <strong>the</strong> Member States <strong>to</strong> impose public-service obligations <strong>to</strong> <strong>the</strong> natural <strong>gas</strong> undertakingsfor security, security of supply, regularity, quality, price of supplies and environmental protection.From this directive it may be expected that all <strong>gas</strong> <strong>from</strong> <strong>biomass</strong> that meets <strong>the</strong> requirements of anatural <strong>gas</strong> may be added <strong>to</strong> <strong>the</strong> <strong>grid</strong>.page: 95
Policy on renewable energyThe general energy policy of <strong>the</strong> EU is described in <strong>the</strong> ‘White Paper’ accepted in 1997 [lit.1]. Thisdocument underlines <strong>the</strong> importance of renewable energy for Europe. In <strong>the</strong> ‘Green Paper’ anambitious program is developed on <strong>the</strong> large-scale exploitation of renewable energy. In this paper<strong>biomass</strong> is <strong>the</strong> most important source of renewable energy [lit.6].7.3.2 AustriaRenewable energy sources have been a long-term priority of Austria's energy, subsidy and researchpolicies, and receive added support <strong>from</strong> <strong>the</strong> high level of environmental consciousness of <strong>the</strong>Austrian people. The Austrian Government is convinced that its policy of intensified utilization ofrenewables has been successful, and will continue its endeavour <strong>to</strong> promote fur<strong>the</strong>r development ofthis group of energy sources. Austria chooses not <strong>to</strong> employ nuclear energy within its borders.The Federal Government sees promotion of renewables (particularly <strong>biomass</strong>) as <strong>the</strong> best way ofmeeting CO 2 reduction targets. According <strong>to</strong> <strong>the</strong> 1993 Energy Plan, an additional 30 <strong>to</strong> 40 PJ couldbe mobilized if effective measures are implemented. The Electricity Supply and Organization Actprovides, among o<strong>the</strong>r things, for an obligation on opera<strong>to</strong>rs of distribution networks <strong>to</strong> purchaseelectricity generated <strong>from</strong> solar energy, wind, <strong>biomass</strong>, bio<strong>gas</strong>, landfill <strong>gas</strong>, digester <strong>gas</strong>, andgeo<strong>the</strong>rmal energy. Fur<strong>the</strong>rmore, <strong>the</strong>se energy sources are <strong>to</strong> reach a share of 3% of <strong>to</strong>talelectricity supplied <strong>to</strong> end-users by 2005.The Austrian Government has set up a major action program <strong>to</strong> support companies switching <strong>the</strong>irheating systems <strong>to</strong> <strong>biomass</strong> of supplying energy <strong>from</strong> <strong>biomass</strong> <strong>to</strong> third parties. The TechnicalUniversities of Vienna and Graz are working on pilot systems for <strong>the</strong> <strong>gas</strong>ification of <strong>biomass</strong>. At <strong>the</strong>same time, studies are being conducted <strong>to</strong> explore new applications for <strong>biomass</strong>-fired combinedheat and power plants and <strong>to</strong> study <strong>the</strong> necessary framework conditions.A new fluid bed process for <strong>the</strong> <strong>gas</strong>ification of <strong>biomass</strong> has been developed that will allow <strong>the</strong>production of high-grade product <strong>gas</strong>. Through <strong>the</strong> use of steam as a <strong>gas</strong>ification agent it has beenpossible <strong>to</strong> reduce <strong>the</strong> tar content of <strong>the</strong> <strong>gas</strong> compared <strong>to</strong> using conventional techniques. Thistechnology is an option for combined heat and power generation <strong>from</strong> <strong>biomass</strong>, mainly ininstallations of 5 MW or more. In order <strong>to</strong> provide a suitable technology for small power plants (200kW <strong>to</strong> 1 MW), researchers at Graz Technical University are developing a solid bed <strong>gas</strong>ifier.An energy tax on <strong>gas</strong> (€ 0.0435/m 3 plus 20% VAT) and electricity (€ 0.0073/kWh plus 20% VAT)was introduced in 1996. This tax applies <strong>to</strong> small-scale as well as industrial users. Approximately12% of <strong>the</strong> tax revenue is made available <strong>to</strong> <strong>the</strong> Federal Provinces for implementation of energysaving and environmental protection measures, including measures for <strong>the</strong> promotion of renewableenergy sources.page: 96
Locally (in a federal state) <strong>the</strong>re has been buy-back guaranties on electricity produced <strong>from</strong>renewable sources. The most favored energy source has been wind power, but co-generation <strong>from</strong><strong>biomass</strong> as well as bio<strong>gas</strong> has been within <strong>the</strong> programme. This promotion has decreased andsince 1996 <strong>the</strong>re is no reliable information concerning any promotion. A drawback could even bethat <strong>the</strong> electricity tax applies <strong>to</strong> electricity <strong>from</strong> <strong>biomass</strong> as well as <strong>from</strong> fossil fuels. The feed-intariff for electricity <strong>from</strong> <strong>biomass</strong> is in <strong>the</strong> interval 0.025 - 0.055 €/kWh with an average of 0.038€/kWh.Austria has a strong interest in energy development in neighbouring Central/Eastern Europeancountries, and has established special funds <strong>to</strong> assist <strong>the</strong>m, such as <strong>the</strong> ‘Austrian EnvironmentalAssistance Abroad’ and ‘Assistance <strong>to</strong> <strong>the</strong> Newly Independent Central and Eastern EuropeanCountries’. These funds provide financial support for projects aimed at improving environmental andenergy conditions in <strong>the</strong>se countries. The emphasis of <strong>the</strong>se activities lies on renewable energysources and on rational energy use. Cross border co-operation with neighbouring countries in <strong>the</strong>field of renewable energy sources is also provided by <strong>the</strong> INTERREG program.Considerable progress has been achieved in <strong>the</strong> use of bio<strong>gas</strong> technology in Austria.The <strong>to</strong>talnumber of bio<strong>gas</strong> installations in Austria 1997 was 196. Additional installations are being planned,especially in <strong>the</strong> field of landfill <strong>gas</strong> recovery, which is continually gaining importance. Besidesseveral smaller installations, <strong>the</strong> <strong>gas</strong> <strong>from</strong> Vienna's largest landfill at Rautenweg has beenrecovered for energy production since 1991. This plant, with an electric power capacity of 8 MW, iscurrently <strong>the</strong> largest in Europe.The advantages of bio<strong>gas</strong> utilization in agriculture are numerous; it represents a renewable energysource, an environmentally sound way for organic waste disposal and organic fertilizer production,and significantly reduces bad smells. Bio<strong>gas</strong> is typically utilized in combined heat and powerinstallations, whose excess power is fed in<strong>to</strong> <strong>the</strong> <strong>grid</strong>. Substances such as vegetable and o<strong>the</strong>r foodresidues or oil are occasionally added. A fund has been set up <strong>to</strong> subsidize <strong>the</strong> installation of bio<strong>gas</strong>systems by agricultural opera<strong>to</strong>rs. There is no information available on <strong>the</strong> mechanisms of this fund.Some sources indicate that it is a general fund that can subsidise projects that meet <strong>the</strong>requirements and apply for funding.7.3.3 DenmarkThe Danish energy policy will contribute <strong>to</strong> <strong>the</strong> sustainable development of Danish society. Itsenergy sec<strong>to</strong>r will continue <strong>to</strong> be economically and technologically efficient, a flourishing sec<strong>to</strong>r thatforms part of <strong>the</strong> dynamic development of Danish society. The policy plans for rational managemen<strong>to</strong>f <strong>the</strong> resources <strong>to</strong> be given a central role. Internationally, Denmark will contribute <strong>to</strong> a developmentin which actions for better use of resources and reducing environmental impact are given steadilygrowing importance.page: 97
Danish energy policy is <strong>to</strong> contribute <strong>to</strong> ensuring Denmark a pioneering role in global sustainabledevelopment.The Danish energy policy is, among o<strong>the</strong>rs, based on <strong>the</strong> following documents:• The Brundtland Report• The Kyo<strong>to</strong> Pro<strong>to</strong>col• UN Climate ConventionThe Danish energy policy is described in <strong>the</strong> documents:• Energi 21 (Energy 21) [lit.51]. Energy 21 is <strong>the</strong> plan of <strong>the</strong> Danish government for sustainabledevelopment of energy in Denmark in an international context. In Energy 21, which waspublished in April 1996, <strong>the</strong> Danish Government maintains <strong>the</strong> national target of reducing CO 2emissions by 20% in 2005, in comparison with <strong>the</strong> 1988 level.• Opfølgning på Energi 21 (Follow-up on Energy 21) [lit.52]. In this report <strong>the</strong> status for meeting<strong>the</strong> targets of Energy 21 is described and new initiatives <strong>to</strong> fulfil <strong>the</strong>se are outlined.The government is maintaining <strong>the</strong> obligation so as <strong>to</strong> stabilise, by 2000, <strong>to</strong>tal Danish CO 2emissions in<strong>to</strong> <strong>the</strong> atmosphere at a level below that of 1990 and, by 2005, <strong>to</strong> have reduced <strong>the</strong>m by20% <strong>from</strong> <strong>the</strong>ir 1988 levels. For <strong>the</strong> transport sec<strong>to</strong>r, <strong>the</strong> government continues <strong>to</strong> maintain its 1990target of a fur<strong>the</strong>r reduction of 25% by 2030.Denmark has one of <strong>the</strong> highest per capital rates of CO 2 emissions in <strong>the</strong> world on account of <strong>the</strong>high proportional use of coal in electricity production. On <strong>the</strong> o<strong>the</strong>r hand, Danish households andindustry use energy quite efficiently in comparison with o<strong>the</strong>r highly-developed industrial countries.Possibilities of reducing CO 2 emissions in Denmark exist through fuel substitution in electricityproduction.Denmark is willing <strong>to</strong> accept <strong>the</strong> reduction targets that follow <strong>from</strong> <strong>the</strong> conclusions of <strong>the</strong>International Panel on Climate Change. Should this be decided, Denmark and o<strong>the</strong>r highlydevelopedindustrial countries with high CO 2 emissions would strive <strong>to</strong> reduce <strong>the</strong>m <strong>to</strong> half <strong>the</strong>ir1990 levels by 2030. Initiatives in <strong>the</strong> field of <strong>biomass</strong> are directed, firstly, <strong>to</strong>wards conversion <strong>from</strong>heat production plants only <strong>to</strong> combined heat and power units, secondly <strong>to</strong>wards increasedexploitation of straw, bio<strong>gas</strong>, and landfill <strong>gas</strong>, and thirdly <strong>to</strong>wards reduction of <strong>the</strong> costs of producing<strong>biomass</strong> for energy purposes.Consequently <strong>the</strong> government intends <strong>to</strong>:• Promote decentralised development of heat and power production based on <strong>biomass</strong> by:- promoting <strong>the</strong> use of <strong>gas</strong> <strong>from</strong> all relevant landfills for power production before 2005,- promoting <strong>the</strong> introduction of <strong>biomass</strong> before 2005 in some 350 block heating units withpage: 98
heating requirements above 250 kW which are located outside district heating and natural<strong>gas</strong> distribution zones and areas,- ensuring that <strong>the</strong> establishment of new individual natural <strong>gas</strong> supplies in minor communitiesshall be dropped in favour of switching <strong>to</strong> <strong>biomass</strong> based district heating or CHP.• Contact <strong>the</strong> parties <strong>to</strong> <strong>the</strong> <strong>biomass</strong> agreement with a view <strong>to</strong> changing it in ways that can lead<strong>to</strong>:- making it possible within <strong>the</strong> framework of <strong>the</strong> agreement <strong>to</strong> replace its very exact quantitiesof straw and wood chips with a more flexible mix of straw and wood chips. This will providea flexibility that can reduce <strong>to</strong>tal costs while simultaneously introducing an element ofcompetition which can reduce <strong>the</strong> fuel prices.- permitting a general opening for <strong>the</strong> use of <strong>biomass</strong> in natural <strong>gas</strong> areas, in order <strong>to</strong> ensure<strong>the</strong> possibilities of fur<strong>the</strong>r development of <strong>biomass</strong> CHP after 2000.• Implement a demonstration and development programme for energy crops designed <strong>to</strong>contribute <strong>to</strong> <strong>the</strong> evaluation of <strong>the</strong> long-term consequences of increasing <strong>the</strong> Danish <strong>biomass</strong>resources by energy crop production, in terms of finance, energy and environment, nature andlandscape, and commerce.• Carry out a limited experimental programme with a view <strong>to</strong> assessing <strong>the</strong> basis for <strong>the</strong>permanent production and utilisation of biofuels.Taxation and incentivesGreen taxesIn 1995, <strong>the</strong> government passed collective legislation for trades and industries, <strong>the</strong> so-called EnergyPackage, as an instrument for reducing CO 2 emissions, and for contributing <strong>to</strong> fulfilment of <strong>the</strong>national CO 2 targets. The package includes energy, CO 2 and SO 2 taxes on energy consumption,subsidies for energy-efficiency measures, entry in<strong>to</strong> agreements for energy-intensive companies,reduction in taxation of labour, and subsidies <strong>to</strong> <strong>the</strong> self-employed. The energy and CO 2 taxes aredependent upon energy use, while <strong>the</strong> SO 2 tax is independent of energy use. In <strong>the</strong> private sec<strong>to</strong>r,energy use is categorized as heavy process, light process and space heating. CO 2 taxes dependupon CO 2 emissions on combustion, as <strong>the</strong> <strong>to</strong>tal tax for all fuels corresponds <strong>to</strong> € 13.4 per <strong>to</strong>n ofCO 2 emission. However, <strong>the</strong> CO 2 tax calculation rate on electricity is fixed and does not fluctuate asa result of changes in fuel consumption in <strong>the</strong> production of electricity. It is possible for energyintensivecompanies <strong>to</strong> enter agreements on energy efficiency and <strong>the</strong>reby reduce <strong>the</strong>ir CO 2 taxes.CO 2 taxes will <strong>the</strong>refore vary significantly, depending upon whe<strong>the</strong>r or not an agreement has beenentered, see table 55. Households are taxed with <strong>the</strong> full CO 2 tax of € 13.4 per <strong>to</strong>n of CO 2 emission.Energy taxes on fuel consumption for space heating in trade and industry are gradually increaseduntil 2002 as indicated in table 56.page: 99
Carbon dioxide taxApplication€/<strong>to</strong>n CO 2Heavy process, no agreement 3.4Heavy process with agreement 0.4Light process, no agreement 12.1Light process with agreement 9.1Space heating 13.4Table 55: Resulting CO 2 taxes in 2000Energy taxes in€/GJ of spaceheatingYearFuel 2000 2001 2002Coal 6.3 6.6 6.8Brown and briquettes 6.3 6.6 6.8Cokes and foundry furnace cokes 6.3 6.6 6.8Petroleum6.7 6.8 7.1Gas oil 6.4 6.7 6.8Fuel oil 6.4 6.7 6.8LPG 6.4 6.7 6.8Electricity 18.3 18.8 19.3Natural <strong>gas</strong> 6.4 6.6 6.8Wood and waste wood 0 0 0Straw 0 0 0Waste 0.8 1.1 1.3Biological <strong>gas</strong> 0 0 0Table 56: Trade and Industry energy taxes on space heatingTaxFuel€/GJCoal 1.3Brown coal and briquettes 1.3Cokes and foundry furnace cokes 1.3Petroleum1.0Gas oil 1.0Fuel oil 1.1LPG 0.9Electricity 3.7Natural <strong>gas</strong> 0.8Wood and waste wood 0Straw 0Waste 0Biological <strong>gas</strong> 0Table 57: CO 2 taxes on fuels.page: 100
There is a sulphur tax on all fuel consumption of 1.3 €/kg sulphur dioxide, see table 57. Fuels with asulphur content of less than 0.05% are tax-exempt.Tradable green certificates in DenmarkIn Denmark a system of tradable green certificates is planned <strong>to</strong> support <strong>the</strong> growth of renewableelectricity. It should take effect in 2002. The Danish government wants <strong>to</strong> use this system <strong>to</strong> double<strong>the</strong> proportion of electricity generated <strong>from</strong> renewable sources <strong>to</strong> 20% in 2003. This systemreplaces <strong>the</strong> current direct subsidies <strong>to</strong> renewable energy producers. The benefit of green certificatetrading above that of state subsidies and fixed prices is that <strong>the</strong>y give producers an incentive <strong>to</strong>reduce <strong>the</strong>ir production costs. The current plans were announced in May 2000. The governmentpledged <strong>to</strong> open a central exchange for trading in renewable green energy certificates. This planhas now been approved under EU state rules.Financial supportThe government supports bio<strong>gas</strong> plants financially with up <strong>to</strong> 30% of <strong>the</strong> investment, with a maxiumof € 130,000. Domestic <strong>biomass</strong> heating systems are supported with 18 - 21% of <strong>the</strong> investment inareas without distribution networks for natural <strong>gas</strong> and district heating.Electricity Act of May 31, 1996The Electricity Act provides a major economic incentive for electricity generated by renewableenergy sources. This subsidy consists of two grants. The first (0.023 €/kWh) is a general incentive<strong>to</strong> expand electricity produced <strong>from</strong> renewables. The o<strong>the</strong>r grant (0.013 €/kWh) serves <strong>to</strong> internalisepart of <strong>the</strong> external costs of fossil fuels.If electricity <strong>from</strong> <strong>biomass</strong> systems is fed in<strong>to</strong> <strong>the</strong> <strong>grid</strong>, <strong>the</strong> utilities pay on a basis of avoided costs.Thus, <strong>the</strong> price depends on <strong>the</strong> time at which <strong>the</strong> electricity is supplied. The private producerreceives between 0.019 - 0.132 €/kWh <strong>from</strong> <strong>the</strong> utility. Added <strong>to</strong> this is a government subsidy(reimbursement for energy or carbon tax) of 0.013 €/kWh and a government grant <strong>to</strong> encourage <strong>the</strong>use of <strong>biomass</strong> of 0.023 €/kWh. This means that <strong>the</strong> price varies within a range of 0.055 - 0.168€/kWh. Fur<strong>the</strong>rmore producers may be eligible for a 30% investment subsidy for bio<strong>gas</strong> facilities.Benefits:Private and decentralised electricity producers get a support for renewable energy (wind, hydro &<strong>biomass</strong>) of 0,024 €/kWh, besides 0.014 €/kWh paid <strong>from</strong> carbon dioxide tax. Total subsidy (above<strong>the</strong> market price for electricity) amounts <strong>to</strong> 0.037 €/kWh.page: 101
CHP FundThe CHP Fund is an incentive for <strong>the</strong> use of CHP in <strong>biomass</strong>-based district heating plants. The CHPFund is financed with energy tax resources. Most projects receive a support of 10 <strong>to</strong> 35% of <strong>the</strong>project costs. The upper ceiling for support is 50% and applies <strong>to</strong> <strong>the</strong> most risky or developmen<strong>to</strong>rientedprojects.The prospects for adding bio<strong>gas</strong> <strong>to</strong> <strong>the</strong> natural <strong>gas</strong> <strong>grid</strong> in Denmark are low. Previous investigationshave shown that upgrading is economically unrealistic and <strong>the</strong> current development is focused onutilisation in district heating or CHP.7.3.4 FinlandRenewable energy consumption is quite high in Finland compared <strong>to</strong> o<strong>the</strong>r OECD countries.Approximately 30% of energy demand in Finland is supplied by renewable energy. Such a highpercentage of renewable energy consumption has helped lead Finland <strong>to</strong> a strong position within<strong>the</strong> renewable energy technology field.The most important Finnish energy sources are wood, peat, and hydropower. Wood accounts forapproximately 19% of energy consumption (with 4% being for small-scale wood use), while peatand hydro account for 7% and 3%, respectively.Finland lacks many indigenous fuel sources and must, <strong>the</strong>refore, ei<strong>the</strong>r import its energy (currently70% of energy demand in Finland) or must rely on alternative sources of energy. Additionally,Finland has been one of <strong>the</strong> highest consumers of energy per capital of <strong>the</strong> OECD countries, whichhas been caused in part by <strong>the</strong> energy-intensive industries (e.g. forestry) that consumeapproximately 50% of energy in Finland. Most <strong>biomass</strong>-based energy is produced within <strong>the</strong> forestryindustry. Additionally, <strong>the</strong> Kyo<strong>to</strong> agreement has stipulated that Finland and o<strong>the</strong>r participatingcountries need <strong>to</strong> bring <strong>the</strong>ir CO 2 emissions down <strong>to</strong> <strong>the</strong> 1990 level.Such fac<strong>to</strong>rs have led Finland <strong>to</strong> pursue many opportunities within <strong>the</strong> renewable energy field, inorder <strong>to</strong> diversify its sources for energy and <strong>to</strong> bring down CO 2 emissions. To address this need forrenewable sources of energy, much research and development has been performed on renewableenergy technologies.Public funding has been a great catalyst for <strong>the</strong> development of <strong>the</strong> renewable energy technologymarket in Finland and will be a fac<strong>to</strong>r impacting <strong>the</strong> future development of <strong>the</strong> renewable energytechnology market. Major programs were launched in 1993 and in 1998 <strong>to</strong> address this issue.Finland's energy technology exports exceed its energy technology imports. Because of this publicemphasis, <strong>the</strong> advanced technology has been developed.The Finnish industrial energy policy is based on voluntary means with <strong>the</strong> exception of <strong>the</strong> energytax. Finland was <strong>the</strong> first IEA member <strong>to</strong> impose a CO 2 tax unilaterally. The tax was introduced in1990 and it applies <strong>to</strong> fossil fuels, including mo<strong>to</strong>r fuels. The 1992 tax rates were doubled in 1993.The Finnish tax system is preferential of indigenous fuels, as indigenous fuels and imported <strong>gas</strong> areexempted <strong>from</strong> <strong>the</strong> general turnover tax. The two big energy-intensive industrial sec<strong>to</strong>rs in Finland,page: 102
i.e. paper and metal production have a high priority in <strong>the</strong> energy policy. These industrial sec<strong>to</strong>rs aresupported by big research and development programmes. Fur<strong>the</strong>rmore, <strong>the</strong> large companies havea possibility <strong>to</strong> conclude agreements with <strong>the</strong> government on energy management and are herebyexcepted <strong>from</strong> <strong>the</strong> CO 2 tax. The small- and medium-sized enterprises are mainly influenced byenergy auditing activities. The Finnish energy policy concentrates on distribution of information,energy auditing, and creation of markets for energy-efficient products and processes.There is no actual national program on bio<strong>gas</strong>, but <strong>the</strong> association ‘Bio<strong>gas</strong> Centre’ is promoting <strong>the</strong>use of bio<strong>gas</strong>. The University of Joensuu is doing some research on anaerobic digestion. Feasibilitystudies concerning establishment of new centralised <strong>to</strong> plants are going on, but no decision hasbeen made so far. Support on R&D and demonstration programmes can be obtained.Organic waste is landfilled and four of <strong>the</strong> sites are now equipped for landfill <strong>gas</strong> collection. Thepractice of landfill <strong>gas</strong> collection is expected <strong>to</strong> increase in <strong>the</strong> near future, while <strong>the</strong> development ofco-digestion will be slower. In order <strong>to</strong> promote bio<strong>gas</strong> development, environmental aspects are <strong>to</strong>be taken in<strong>to</strong> consideration.No promotion taxes or funds have been found <strong>to</strong> support bio<strong>gas</strong> production. The feed-in tariff forelectricity produced <strong>from</strong> renewable energy sources only apply <strong>to</strong> wind power.The main barriers for implementation of bio<strong>gas</strong> technologies are: <strong>the</strong> current Finnish legislation thatallows cheaper ways of treating manure, relatively low price levels for electricity and fuels comparedwith o<strong>the</strong>r European countries and <strong>the</strong> high costs of bio<strong>gas</strong> caused by <strong>the</strong> relatively dispersedlocation of <strong>the</strong> farms. The public opinion is favourable <strong>to</strong> landfill <strong>gas</strong> collection, while centralisedwaste treatment in large plants is considered less attractive, because of traffic and odour problems.Farm-scale bio<strong>gas</strong> in systems will probably develop [lit.64].7.3.5 FranceThere are some ongoing bio<strong>gas</strong> projects (based on slurry), studies and pilot plants in South-WestFrance (Brittany). The French government has called for offers for power plants fuelled with landfill<strong>gas</strong> (without upgrading). Five projects with a <strong>to</strong>tal capacity of approximately 15 MW have beenselected.At <strong>the</strong> upgrading plant at Montech, <strong>the</strong>y seek <strong>to</strong> find a solution <strong>to</strong> <strong>the</strong> obstacles for injection ofupgraded <strong>gas</strong> <strong>to</strong> <strong>the</strong> natural <strong>gas</strong> <strong>grid</strong>.page: 103
Taxation and incentivesFeed-in tariffsThe French state-owned utility EDF has <strong>the</strong> obligation <strong>to</strong> purchase <strong>from</strong> independent powerproducers. The tariff is based on <strong>the</strong> avoided cost for EDF. The tariff is currently about 0.046 €/kWh.This tariff is mainly used for independent small producers of hydropower (more than 14 PJ/year).Avoided costs for CHP <strong>from</strong> <strong>biomass</strong> or municipal waste have currently a mean value of 0.060€/kWh due <strong>to</strong> firm power advantage.Bois-énergie et le developpement localSubsidy for local wood-fired <strong>biomass</strong> plants, for example for district heating. Biomass projects areeligible for subsidies of up <strong>to</strong> 30% of <strong>the</strong> investment cost.TIPPThe ‘Taxe Interieur sur les Produits Pétroliers’ is a taxation of fossil fuels. Non fossil fuels, like biofuelsare partly exempted.1) DetaxationDetaxation amounts <strong>to</strong> € 0.35 per litre of Bio-ester incorporated in diesel or domestic fuel and € 0.50per litre of ethanol derived fuels incorporated in unleaded super <strong>gas</strong>oline.2) TaxationApplied TIPP rate (11 January 1998):- € 1.63 per litre of Bio-ester- € 8.27 per litre of ethanol7.3.6 GermanyIn April 2000 a law on preference of renewable energy (Gesetz für den Vorrang ErneuerbarerEnergien, EEG) came in<strong>to</strong> force [lit.65,66]. The law addresses aspects related <strong>to</strong> supply ofelectricity produced <strong>from</strong> <strong>biomass</strong> <strong>to</strong> <strong>the</strong> power <strong>grid</strong>. The objective of <strong>the</strong> law is <strong>to</strong> enable asustainable development of <strong>the</strong> energy supply and <strong>to</strong> increase <strong>the</strong> contribution of renewable energysupply <strong>to</strong> power production in accordance with <strong>the</strong> goals of The European Union and Germany <strong>to</strong> atleast double <strong>the</strong> share of renewable energy of <strong>the</strong> <strong>to</strong>tal energy consumption by 2010. Thecompensation ranges <strong>from</strong> 0.09 - 0.10 €/kWh depending on installed power.This law also considers injection of upgraded bio<strong>gas</strong>:"The scope of application of <strong>the</strong> Act also covers bio<strong>gas</strong> which is generated elsewhere and fed in<strong>to</strong><strong>the</strong> <strong>gas</strong> network when bio<strong>gas</strong> is used for electricity generation, providing that proof is furnished of<strong>the</strong> origin of this <strong>gas</strong> and providing that <strong>the</strong>re are calculations which prove that <strong>the</strong> energy content ofpage: 104
<strong>the</strong> <strong>gas</strong> quantity used is equal <strong>to</strong> <strong>the</strong> energy content of <strong>the</strong> bio<strong>gas</strong> quantity fed in<strong>to</strong> <strong>the</strong> network."In 2000 <strong>the</strong> German Bio<strong>gas</strong> Association established a working group on bio<strong>gas</strong> introduction <strong>to</strong> <strong>the</strong>natural <strong>gas</strong> <strong>grid</strong>. The purpose is <strong>to</strong> describe <strong>the</strong> technical possibilities for introduction of bio<strong>gas</strong> and<strong>to</strong> prepare regulations of fixed fees for <strong>the</strong> introduced <strong>gas</strong> [lit.57]. The German Bio<strong>gas</strong> Associationhas proposed <strong>to</strong> make a parallel law for introduction of upgraded bio<strong>gas</strong> <strong>to</strong> <strong>the</strong> natural <strong>gas</strong> <strong>grid</strong>, <strong>to</strong>compensate <strong>the</strong> injected upgraded bio<strong>gas</strong> or <strong>the</strong> transport through <strong>the</strong> <strong>grid</strong>, <strong>to</strong> deduct <strong>the</strong> mineral oiltaxes <strong>from</strong> bio<strong>gas</strong> etc.A shift <strong>to</strong> natural <strong>gas</strong> in <strong>the</strong> heat as well as in <strong>the</strong> power market is expected, however, injection ofupgraded bio<strong>gas</strong> is not considered at all in a most recent climate study unlike o<strong>the</strong>r renewables,such as solar heat or combustion of <strong>biomass</strong> [lit.67].The cabinett has decided on July 26, 2000 <strong>to</strong> reduce CO 2 -emissions until 2005 as compared <strong>to</strong>1990 by about 18 - 20%, corresponding <strong>to</strong> a <strong>to</strong>tal absolute reduction of 180 - 200 million <strong>to</strong>n [lit.68].The actual deficit of some 50 - 70 million <strong>to</strong>n has <strong>to</strong> be shared by private households and inbuildings 18 - 25 million <strong>to</strong>n, by power suppliers and industry 20 - 25 million <strong>to</strong>n and by traffic 15 -20 million <strong>to</strong>n.Taxation and incentivesStromeinspeisungsgesetzThe federal act concerning <strong>the</strong> feeding of green electricity in<strong>to</strong> <strong>the</strong> national <strong>grid</strong> defines regulationsfor purchases of systems with an installed capacity of less than 5 MW.The federal act concerning <strong>the</strong> feeding of green electricity in<strong>to</strong> <strong>the</strong> national <strong>grid</strong> that came in<strong>to</strong> forceon January 1st 1991 defines regulations for systems with an installed capacity of less than 5 MW.This regulation provides feed-in tariffs for small hydros, landfill <strong>gas</strong> and <strong>biomass</strong> electricity, which isfired with wood waste <strong>from</strong> <strong>the</strong> industry (installations up <strong>to</strong> 5 MW). Wind and solar energy are notincluded in <strong>the</strong> regulation as far as <strong>the</strong> capacity is concerned. The energy utilities are obliged <strong>to</strong>purchase electricity produced <strong>from</strong> renewables within <strong>the</strong>ir respective supply areas, at prices whichare fixed at <strong>the</strong> national level and apply throughout <strong>the</strong> year. The price is set on <strong>the</strong> basis of <strong>the</strong>average revenue (without countervailing tariff and sales tax) during <strong>the</strong> two previous years. Thevalue for 1995, as published in <strong>the</strong> official federal statistics, is <strong>the</strong> starting point for <strong>the</strong> 1997calculations and amounts <strong>to</strong> 0.096 €/kWh.The rate for electricity <strong>from</strong> hydro and <strong>biomass</strong> systems with an output of less than 500 kW <strong>to</strong>tals atleast 80% of <strong>the</strong> average revenue (currently 0.077 €/kWh), for those with an output of more than500 kW <strong>the</strong> feed-in tariff is at least 65% of average revenue (0.063 €/kWh).page: 105
Subsidies and fundingThere are several regional and national programmes that provide subsidies or cheap loans forinvestments in <strong>biomass</strong> technology for energy production:• ERP-Umwelt und Energiesparprogram• DtA-Umweltprogramm (Deutsche Ausgleichbank)• Umweltschutz-Bürgschaftsprogramm• DtA-Umweltprogramm mit Zinzuschuss des BMU• KfW-Umweltprogramm für Unternehmen• Nutzung erneuerbare Energiequellen• Agrarinvestionsförderungsprogramm• Demonstrationsvorhaben• Agrarinvestitionsförderungsprogramm, Baden-Württemberg• Investionen im Regionalprogramm• Technologie-Einführungsprojekt Holz- und Biomasseheizungen in Bayern• REN-Programm• Agrarinvestionsförderungsprogramm, Brandenburg• Energieeinsparung/Erneuerbare Energiequellen• Hessisches Energiegesetz• Erneuerbare Energien, Mecklenburg-Vorpommern• Erneuerbare Energien, Niedersachsen• REN-Programm Nordrhein-Westfalen• Erneuerbare Energien, Reinland-Pfalz• Saarländisches Zukunftsenergieprogramm• Vorhaben des Immisions- und Klimaschutzes, Programmteil B• Gewinnung von Deponie- und Klär<strong>gas</strong>• Rationelle und Umweltfreundliche Energieverwendung und Nutzung von erneuerbaren Energien• Massnahmen zur Emissionssenkung7.3.6 The Ne<strong>the</strong>rlandsThe energy policy of <strong>the</strong> Ne<strong>the</strong>rlands aims at lowering <strong>the</strong> energy intensity of <strong>the</strong> society in <strong>the</strong> mostcost-effective way. Secondary <strong>to</strong> this is <strong>the</strong> use of renewable energy sources. The long-termperspective is <strong>to</strong> lower <strong>the</strong> dependency on external energy sources, lowering <strong>the</strong> economic andsocial cost of <strong>the</strong> energy supply and a growing sustainability of <strong>the</strong> society. Biomass plays animportant role in this policy.page: 106
EcotaxThe government in <strong>the</strong> Ne<strong>the</strong>rlands introduced <strong>the</strong> ecotax in 1998. Table 58 gives <strong>the</strong> level of thistax by <strong>the</strong> year 2001. The consumer pays this ecotax. If <strong>the</strong> consumer buys green energy <strong>from</strong> <strong>the</strong>utility, no ecotax has <strong>to</strong> be paid. The utility will however charge a green energy premium <strong>to</strong> <strong>the</strong>consumer.EcotaxO<strong>the</strong>rpriceelementsConsumer priceconventionalproductGreenenergyPremiumConsumerpricegreen productNatural <strong>gas</strong> €ct/m 3 €ct/m 3 €ct/m 3 €ct/m 30 - 5,000 11.7 30 42 not available not available5,000 - 170,000 5.7 22 28 not available not available170,000 - 1.000,000 1.1 10 11 not available not availableElectricity €ct/kWh €Ct/kWh €Ct/kWh €ct/kWh €Ct/kWh0 - 10,000 5.5 12.0 17.5 2.7 - 5.4 14.7 - 17.410,000 - 50,000 1.8 6.0 8 2.3 - 4.5 8.3 - 10.550,000 - 10,000,000 0.3 5.0 5.3 2.3 - 4.5 8.3 - 10.5Table 58: Ecotax in <strong>the</strong> Ne<strong>the</strong>rlands (starting in 2001)Figures 19 and 20 show <strong>the</strong> changes in <strong>the</strong> position of <strong>the</strong> energy producer.Figure 19:Impact of <strong>the</strong> energy tax system in <strong>the</strong> Ne<strong>the</strong>rlands on end-users and energyproducers of electricity. This system is operational <strong>from</strong>d January 2001. The dataare representative, <strong>the</strong>re are however some local differences. All costs in €ct/kWh.page: 107
Figure 20:Impact of <strong>the</strong> energy tax system in <strong>the</strong> Ne<strong>the</strong>rlands on end-users and energyproducers of <strong>gas</strong>. Up <strong>to</strong> now sustainable <strong>gas</strong> is not marketed by <strong>the</strong> energycompanies. The data are representative, <strong>the</strong>re are however some local differences.All costs in €ct/m 3 .Liberalisation focussed on end-user positionThe government in <strong>the</strong> Ne<strong>the</strong>rlands uses <strong>the</strong> tax system <strong>to</strong> sustain <strong>the</strong> ‘greening’ of <strong>the</strong> society. Inthis policy <strong>the</strong> power of decission is moved <strong>to</strong> <strong>the</strong> end-user. Taxing makes <strong>the</strong> use of energyexpensive. Three taxes are levied <strong>to</strong> <strong>the</strong> consumer: value added tax (‘BTW’), fuel tax(‘Brands<strong>to</strong>ffenbelasting’) and ecotax (‘Regulerende energiebelasting’).The end-user gains <strong>the</strong> largest benefits by not using energy. Secondary <strong>to</strong> this, <strong>the</strong> user will pay alower tax by using sustainable energy. In this case <strong>the</strong> user will be exempted <strong>from</strong> <strong>the</strong> ecotax, andabove this <strong>the</strong> producer will receive a bonus for producing sustainble energy.Current price and tax levels balance <strong>the</strong> end-user prices for sustainable and not sustainable energy.The second largest energy company (Essent) is expected <strong>to</strong> offer <strong>to</strong> <strong>the</strong> residential end-users byJanuary 2001 ‘green’ electricity at a lower price than conventional electricity. The background <strong>to</strong> thisis probably that Essent makes more profit on green energy than on conventional energy.Figure 21 shows <strong>the</strong> main structure of <strong>the</strong> <strong>gas</strong> infrastructure sec<strong>to</strong>r in <strong>the</strong> Ne<strong>the</strong>rlands. Essentially<strong>the</strong> following parties are of importance in <strong>the</strong> liberal market <strong>gas</strong> supply:page: 108
• trading company (tradco)• arranges <strong>the</strong> delivery of <strong>gas</strong> <strong>to</strong> <strong>the</strong> end-user• receives payments <strong>from</strong> <strong>the</strong> end-user• pays taxes <strong>to</strong> <strong>the</strong> government• pays <strong>the</strong> producer, transco and disco• end-user• receives <strong>gas</strong> <strong>from</strong> <strong>the</strong> disco (or transco, or producer)• pays <strong>the</strong> tradco• distribution company (disco)• arranges <strong>the</strong> delivery of <strong>gas</strong> <strong>to</strong> <strong>the</strong> end-user• receives <strong>gas</strong> <strong>from</strong> <strong>the</strong> transco• delivers <strong>gas</strong> <strong>to</strong> <strong>the</strong> end-user• transport company (transco)• is paid by <strong>the</strong> tradco• receives <strong>gas</strong> <strong>from</strong> <strong>the</strong> producer (or o<strong>the</strong>r transco, or disco)• producer• is paid by <strong>the</strong> tradco• delivers <strong>gas</strong> <strong>to</strong> <strong>the</strong> transco (or disco, or end-user)• government taxes <strong>the</strong> end-user via <strong>the</strong> tradco for:• BTW (VAT)• Regulerende emergiebelasting (ecotax)• Brands<strong>to</strong>ffenbelasting (fuel tax)Figure 21: Schematic representation liberalised <strong>gas</strong> market in <strong>the</strong> Ne<strong>the</strong>rlandspage: 109
TargetsParallel with <strong>the</strong> target on sustainable energy a target on reduction of greenhouse <strong>gas</strong> emissions isformulated. The emission of greenhouse <strong>gas</strong>es has <strong>to</strong> be reduced by 6% in 2012 latest compared <strong>to</strong><strong>the</strong> 1990 level. In <strong>the</strong> Ne<strong>the</strong>rlands situation this also means a reduction of <strong>the</strong> carbon dioxideemissions by 6%.The government follows three lines in forcing <strong>the</strong> development in <strong>the</strong> desired direction:• incentives for research and development,• tax regulation which favours sustainable energy over fossil energy and• ‘Voluntary’ agreements with energy companies and end-users on reduction of <strong>the</strong> energyconsumption.In 1999 <strong>the</strong> government proposed <strong>the</strong> ‘Gaswet’ (law on <strong>gas</strong>) including <strong>the</strong> possibility for <strong>the</strong>government <strong>to</strong> force <strong>the</strong> use of sustainably produced <strong>gas</strong>. Introducing green certificatesrepresenting an amount of green energy will do <strong>the</strong> enforcement. The government will bill energycompanies that do not have enough certificates.The progress report ‘Duurzame energie in uitvoering, Voortgangsrapportage 1999’ gives <strong>the</strong> mostrecent update on sustainable energy policy in <strong>the</strong> Ne<strong>the</strong>rlands. This report pays also attention <strong>to</strong> <strong>the</strong>limited availability of <strong>biomass</strong> in <strong>the</strong> Ne<strong>the</strong>rlands. Already at this moment nearly all domesticsources of <strong>biomass</strong> and organic wastes are utilised for energy generation.Activities by energy companiesAll main energy companies in <strong>the</strong> Ne<strong>the</strong>rlands, ESSENT, NUON and ENECO, apply, or are going <strong>to</strong>apply, <strong>biomass</strong> or organic waste <strong>gas</strong>ification in <strong>the</strong>ir energy supply. In most cases <strong>the</strong> produced <strong>gas</strong>is converted <strong>to</strong> green electricity.Notwithstanding <strong>the</strong> positive experience with adding <strong>gas</strong> <strong>from</strong> <strong>biomass</strong> and waste <strong>to</strong> <strong>the</strong> <strong>gas</strong> <strong>grid</strong>electrification is <strong>the</strong> most used technology. Incentives <strong>to</strong> do this are <strong>the</strong> higher price of energy soldas electricity compared <strong>to</strong> natural <strong>gas</strong> and <strong>the</strong> low investment and easy management for <strong>the</strong>genera<strong>to</strong>rs. An important aspect is that <strong>the</strong> genera<strong>to</strong>r can be moved at low cost <strong>from</strong> a depletedlandfill <strong>to</strong> a new landfill or any o<strong>the</strong>r application.Some large IGCC <strong>biomass</strong> projects are planned, but <strong>the</strong> low availability of <strong>biomass</strong> is a seriousproblem. There is an overcapacity of AVI’s (Afval Verwerkings Installaties: Installations <strong>to</strong> burnmunicipal and industrial waste) taking nearly all <strong>biomass</strong> and organic waste <strong>from</strong> <strong>the</strong> market.The energy efficiency of <strong>the</strong> AVI is low (about 35%) but <strong>the</strong> organic material is also nearlyindispensable in <strong>the</strong> combustion of <strong>the</strong> municipal waste.Prospectspage: 110
The current prospect for adding <strong>gas</strong> <strong>from</strong> <strong>biomass</strong> <strong>to</strong> <strong>the</strong> <strong>gas</strong> <strong>grid</strong> is ra<strong>the</strong>r low. In 2000 only 0.1% of<strong>the</strong> <strong>gas</strong> is <strong>from</strong> renewable sources, versus 3.2% for renewable electricity. Relatively high prices forelectricity, <strong>the</strong> low cost of <strong>the</strong> electrification units and <strong>the</strong> limited availability of <strong>biomass</strong> and organicwaste obstruct <strong>the</strong> addition of <strong>gas</strong> <strong>from</strong> <strong>biomass</strong> <strong>to</strong> <strong>the</strong> <strong>gas</strong> <strong>grid</strong>. In <strong>the</strong> long term Gastec expects abetter prospect for sustainable <strong>gas</strong> options.Key elements in this development are:• demonstration of lower cost technologies for production of <strong>gas</strong> <strong>from</strong> <strong>biomass</strong> and waste• <strong>the</strong> higher energy efficiency of <strong>the</strong> <strong>gas</strong> <strong>grid</strong> route• <strong>the</strong> higher flexibility of <strong>the</strong> <strong>gas</strong> <strong>grid</strong> route• large-scale <strong>gas</strong>ification of <strong>biomass</strong>, ei<strong>the</strong>r in third countries or of imported <strong>biomass</strong>.7.3.7 SwedenThe Swedish energy sec<strong>to</strong>r is experiencing a period of restructuring and deregulation. Thecomprehensive development of <strong>the</strong> energy market include fields such as transmission technology,<strong>gas</strong> power generation, biofuels and renewable energy, and environmental know-how.Oil, hydro power, and nuclear power are <strong>the</strong> main sources of energy in Sweden. Sweden has nocommercially exploitable oil, <strong>gas</strong> or coal reserves; <strong>the</strong>refore, Sweden imports 70% of its energy rawmaterial needs. Most of <strong>the</strong> imports are in <strong>the</strong> form of oil, 65% of which comes <strong>from</strong> <strong>the</strong> North Sea.Significant changes have occurred in <strong>the</strong> Swedish energy sec<strong>to</strong>r since 1970. Most importantly, <strong>the</strong>proportion of <strong>the</strong> country's energy supplied by oil has fallen substantially, <strong>from</strong> 77% in 1970 <strong>to</strong> 45%in 1996. In contrast, <strong>the</strong> proportion of <strong>the</strong> country's <strong>to</strong>tal energy supply accounted for by electricityhas risen <strong>from</strong> 14% <strong>to</strong> 30% over <strong>the</strong> period.The area of energy conservation will gain in importance. The conflicting environmental goals - <strong>the</strong>phasing out of nuclear power, <strong>the</strong> Parliament's decision <strong>to</strong> restrict fur<strong>the</strong>r development of rivers for<strong>the</strong> generation of hydroelectric power, and its commitment <strong>to</strong> prohibit increases in CO 2 emissionshas created an energy policy dilemma. Replacing <strong>the</strong> reac<strong>to</strong>rs by natural <strong>gas</strong> or o<strong>the</strong>r fossil fuelswould mean a significant increase in Sweden's CO 2 emissions.Biofuels have come <strong>to</strong> play an increasingly important role in <strong>the</strong> Swedish energy system since <strong>the</strong>1970s. Research is being conducted for <strong>the</strong> future use of biofuels, which looks more promising thanwind or solar power. Since 1991 a <strong>to</strong>tal of € 118 million has been allocated for <strong>the</strong> support ofbiofuel-based combined heat and power. In 1996, use of biofuels, peat etc. amounted <strong>to</strong> about 300PJ. The use of wood fuels within district heating has trippled since 1991 and in 1996 <strong>to</strong>talled 80 PJ.11 PJ of biofuels were used for electricity production in 1996.page: 111
Sweden has no actual program dedicated <strong>to</strong> <strong>the</strong> support of bio<strong>gas</strong> production. In June 1997 <strong>the</strong>Government's energy policy bill, ‘For a Sustainable Energy Supply’, was adopted by <strong>the</strong> Riksdag.The energy policy objective remained unchanged, i.e. that in <strong>the</strong> short and long terms it secures <strong>the</strong>availability of electricity and o<strong>the</strong>r energy sources under conditions competitive with <strong>the</strong> surroundingworld. An extensive program <strong>to</strong> facilitate <strong>the</strong> realignment <strong>to</strong> an ecologically and economicallysustainable energy system has been instituted. The program encompasses support for measures <strong>to</strong>reduce electricity consumption and <strong>to</strong> increase <strong>the</strong> supply of electricity <strong>from</strong> renewable energysources and encourage energy research. In excess of € 1 billion has been allocated for a 5 - 7 yearperiod.Over <strong>the</strong> past decade higher taxes on energy have become an increasingly important controlinstrument in energy policy in addition <strong>to</strong> <strong>the</strong>ir purely fiscal function. In 1990/91 environmentalsurcharges were imposed on fossil fuels and VAT (25%) was applied <strong>to</strong> energy. An environmentaltax is levied on carbon dioxide, sulphur and nitrogen oxide. In addition, all fuels are subject <strong>to</strong> anenergy tax. The tax rate varies depending on <strong>the</strong> user group.All fuels used for electricity production are however exempted <strong>from</strong> <strong>the</strong> energy and carbon dioxidetaxes. Instead, <strong>the</strong> tax is collected at <strong>the</strong> consumer level. The production of electricity in so-calledcombined heat and power plants using fossil fuel is subject <strong>to</strong> <strong>the</strong> energy tax but exempted <strong>from</strong> <strong>the</strong>carbon dioxide tax. Since 1991 all fuels, except biofuels and peat, are subject <strong>to</strong> a carbon dioxidetax. From and including 1 July 1997 industry is required <strong>to</strong> pay 50% of <strong>the</strong> general carbon dioxidetax which is approximately € 42 per <strong>to</strong>n of carbon dioxide. Biofuels, including bio<strong>gas</strong> are <strong>to</strong>tallyexempt <strong>from</strong> taxation, except VAT, for all users. Bio<strong>gas</strong> is thus relieved <strong>from</strong> <strong>the</strong> vehicle fuel tax.The overall objectives of energy research are <strong>to</strong> develop <strong>the</strong> level of scientific and technicalresearch and expertise within <strong>the</strong> universities, university colleges and <strong>the</strong> business sec<strong>to</strong>r <strong>to</strong>promote <strong>the</strong> development and realignment of <strong>the</strong> energy system. During <strong>the</strong> period 1975 - 1993support <strong>to</strong> energy research and development amounted <strong>to</strong> 5% of <strong>the</strong> State's research anddevelopment funding. For <strong>the</strong> budget year 1994/95 <strong>the</strong> share was just over 2%.Power and heat research aims <strong>to</strong> promote a sturdy energy system with an environmentally sound,sustainable, secure and efficient supply and application of energy. Research is conducted in fieldssuch as wind power, electricity production technology, district heating and solar power.Research concerning bio-energy is extremely comprehensive and involves, e.g., <strong>the</strong> cultivation offast growing energy forests, study of <strong>the</strong> effects on land due <strong>to</strong> more intensive forestry, <strong>the</strong> recyclingof ash <strong>to</strong> forest land and alternative mo<strong>to</strong>r vehicle fuels.page: 112
Energy technology research concentrates on incineration technology, <strong>gas</strong>ification technology andflue <strong>gas</strong> and exhaust purification technology and is expected <strong>to</strong> lead <strong>to</strong> more efficient energytransformation methods and increased energy efficiency in industrial processes.According <strong>to</strong> <strong>the</strong> Riksdag's energy policy decision energy research will take a slightly differentcourse in <strong>the</strong> future in that energy system research and collaboration with <strong>the</strong> Baltic states will beemphasised.Energy Media 1970 1980 1990 1996 2010Crude oil and oil products 1260 1026 673 781 803Natural <strong>gas</strong>, <strong>to</strong>wn <strong>gas</strong> 25 32 47Coal and coke 65 68 112 112 115Biofuels, peat etc. 155 173 234 313 353Waste heat etc.,district heating systems 4 29 29 42Hydropower, gross 148 212 263 187 243Nuclear power, gross 94 245 266 241Nuclear power, gross(international method) 274 720 799 698Electricity import minus export 14 4 -11 22 10Total energy supply 1645 1580 1573 1746 1854Total energy supply,international method 1645 1760 2048 2279 2311Table 59: Energy supply, 1970-1996, forecast for 2010, in PJIn 1999 a waste tax for organic wastes <strong>to</strong> landfills was launched. The tax amounts <strong>to</strong> approximately€ 30/<strong>to</strong>n. This tax has promoted <strong>the</strong> interest for digestion as a waste management method in <strong>the</strong>communities. In <strong>the</strong> year 2005 <strong>the</strong>re will be a prohibition concerning landfilling of organic wastes.This is supposed <strong>to</strong> result in an increasing market for digestion/bio<strong>gas</strong> production as a wasterecycling method.Bio<strong>gas</strong> as vehicle fuelUtilisation of <strong>the</strong> natural <strong>gas</strong> <strong>grid</strong> as a transporting system for bio<strong>gas</strong> plays an important role inpromoting <strong>the</strong> use of bio<strong>gas</strong> as a vehicle fuel, as it will be possible <strong>to</strong> produce bio<strong>gas</strong> in any placealong <strong>the</strong> <strong>gas</strong> <strong>grid</strong> with <strong>the</strong> possibility <strong>to</strong> trade 100% of <strong>the</strong> <strong>gas</strong> as vehicle fuel.The value for bio<strong>gas</strong> is at <strong>the</strong> moment highest if <strong>the</strong> <strong>gas</strong> can be used as vehicle fuel. The price forbio<strong>gas</strong> as vehicle fuel in Sweden was in <strong>the</strong> autumn of 2000 around 70 €ct/m 3 . This corresponds <strong>to</strong>a petrol price of 70 €ct/litre that makes it competitive on <strong>the</strong> market even though <strong>the</strong> bio<strong>gas</strong> carscost 3 - 5 k€. Bio<strong>gas</strong> as vehicle fuel is relieved <strong>from</strong> taxes through an amendment <strong>to</strong> <strong>the</strong> EUPetroleum directive 92/81/EEG. This gives bio<strong>gas</strong> a long term potential as a vehicle fuel if it can beupgraded and distributed <strong>to</strong> <strong>the</strong> market via <strong>the</strong> natural <strong>gas</strong> <strong>grid</strong>.page: 113
Swedish energy taxesThe Swedish energy taxes are divided in<strong>to</strong> three parts, an energy tax, a CO 2 -tax and a sulphur tax.The energy tax is different for different types of fuels. The CO 2 -tax is based on <strong>the</strong> carbon content in<strong>the</strong> fuel and <strong>the</strong> sulphur tax is also based on <strong>the</strong> sulphur content in <strong>the</strong> fuel. Biofuels and bio<strong>gas</strong> isrelieved <strong>from</strong> all forms of tax (except VAT).7.3.8 SwitzerlandTaxUnit Energy Carbon Sulphur TotalProductdioxideBio<strong>gas</strong>/Biofuel 0 0 0 0Diesel 1 €/m 3 214 121 0 335Petrol €/m 3 415 99 0 514Fuel oil No1 €/m 3 85 121 6 212Natural <strong>gas</strong> €/1000m 3 28 91 0 119Table 60: Energy taxes in Sweden. The use of electricity is taxed in Sweden. The tax variesbetween zero for <strong>the</strong> industry and 2 €ct/kWh for domestic consumption.Renewable energy is one of <strong>the</strong> ‘hottest’ domestic political issues in Switzerland. Energyconsumption as well as energy production has been identified as <strong>the</strong> main source of air pollution.This is significant as air pollution happens <strong>to</strong> be <strong>the</strong> ‘problem child’ of <strong>the</strong> o<strong>the</strong>rwise ra<strong>the</strong>rsuccessful Swiss pollution control program. A particularly sensitive aspect is <strong>the</strong> replacement of <strong>the</strong>country's five nuclear power plants which needs <strong>to</strong> be completed within <strong>the</strong> next 10-15 years.Nuclear power covers 39% of <strong>the</strong> Swiss consumption of electric energy and <strong>the</strong>re is no viablealternative in sight. Energy prices are under growing pressure due <strong>to</strong> <strong>the</strong> market liberalization.Although moving more slowly than in most o<strong>the</strong>r European countries, <strong>the</strong> liberalization process isadvancing at a steady pace. The resulting lower energy prices are hardly encouraging for making<strong>the</strong> switch <strong>to</strong> high cost renewable energy <strong>from</strong> ‘clean sources’. The Swiss approach is different <strong>from</strong>most of its European neighbors as <strong>the</strong> law does not include a quota for renewable energy (such asSpain e.g.) or a legal requirement <strong>to</strong> accept renewable energy such as in Germany(Ruecknahmegesetz). The goal is <strong>to</strong> be reached by a mix of financial incentives and subsidies.Partly inspired by <strong>the</strong> German example, <strong>the</strong> Swiss Parliament is haggling over <strong>the</strong> final <strong>to</strong>uches ofwhat is described as an ecological tax law reform. The goal is <strong>to</strong> tax ‘wasteful use of energy’ as wellas energy produced by means which are classified as ‘environmentally unfriendly’. The resultingfinancial pressure is expected <strong>to</strong> fur<strong>the</strong>r investments in relevant equipment and technologies. Thenew revenues which will be generated will be recycled back in<strong>to</strong> <strong>the</strong> economy <strong>to</strong> promote <strong>the</strong> use ofrenewable energy, energy efficiency and relevant R&D. Some 350 - 470 M€ will become availableannually as a result. Some of <strong>the</strong>se funds will flow in<strong>to</strong> <strong>the</strong> follow-up program of ‘Energy 2000’.‘Energy 2000’, which is about <strong>to</strong> be concluded, was launched by <strong>the</strong> Government in 1991 <strong>to</strong> fur<strong>the</strong>rrenewable energies, energy efficiency and R&D. According <strong>to</strong> a June 1999 report, some 62% of <strong>the</strong>goals in <strong>the</strong> heating sec<strong>to</strong>r and about 88% of <strong>the</strong> targets in <strong>the</strong> field of electrical power had beenpage: 114
eached by that time. The availability of funds triggered a number of interesting R&D programswhich, in turn, are producing promising results. As funding will increase in <strong>the</strong> future, R&D isexpected <strong>to</strong> grow considerably. The follow-up program of ‘Energy 2000’ provides a generous annual270 - 295 M€ for a period of 10 years. Experts feel that <strong>the</strong> new private sec<strong>to</strong>r investments whichwill be triggered will more than match this amount. 13Swiss renewable energy programs are focussing on <strong>biomass</strong> (wood, plants etc.), wind generatedenergy, pho<strong>to</strong>voltaic and solar energy, heat pumps (making use of geo<strong>the</strong>rmal energy etc.) as wellas sources of energy resulting <strong>from</strong> bacteriological processes such as fermentation (sewagetreatment plants, fermentation vessels etc.).13 U.S. Department of Commerce - National Trade Data Bank, November 3, 2000page: 115
8 CONCLUSIONS AND RECOMMENDATIONSConclusions• The production and upgrading of <strong>biomass</strong> <strong>to</strong> bio<strong>gas</strong>, suitable for addition <strong>to</strong> <strong>the</strong> <strong>gas</strong> <strong>grid</strong>, is aproven technology. Several areas, such as control and analysis systems and cost reduction,need fur<strong>the</strong>r development.• The production of pipeline quality <strong>gas</strong> <strong>from</strong> <strong>biomass</strong> via <strong>the</strong>rmal processes, combinesessentially two proven technologies: syn<strong>gas</strong> production <strong>from</strong> <strong>biomass</strong> and syn<strong>gas</strong> conversion <strong>to</strong>methane.• The introduction of bio<strong>gas</strong> in<strong>to</strong> separate <strong>to</strong>wn <strong>gas</strong> <strong>grid</strong>s has been proven <strong>to</strong> be successful.• Production, upgrading <strong>to</strong> natural <strong>gas</strong> quality and addition <strong>to</strong> <strong>the</strong> <strong>gas</strong> <strong>grid</strong> leads <strong>to</strong> a very highutilisation rate of energy <strong>from</strong> <strong>biomass</strong>.• Taxes form a marketing instrument <strong>to</strong> promote bio<strong>gas</strong>.• Delivery of bio<strong>gas</strong> off-spec requires a <strong>gas</strong> quality tracking system and close communicationbetween <strong>the</strong> upgrading plant and <strong>the</strong> <strong>grid</strong> owner.The following roadblocks for introduction of bio<strong>gas</strong> <strong>to</strong> <strong>the</strong> <strong>gas</strong> <strong>grid</strong> were identified• Missing regulation and legislation of access rights can inhibit bio<strong>gas</strong> introduction.• The bio<strong>gas</strong> production site should be located near a <strong>gas</strong> pipeline and a widely distributednatural <strong>gas</strong> <strong>grid</strong> is recommended.• Electricity production out of <strong>biomass</strong> is in some countries more profitable than production ofbio<strong>gas</strong>, due <strong>to</strong> <strong>the</strong> existing tax instruments.• The tax instruments are not unified in <strong>the</strong> EU countries.Recommendations• Standardisation for <strong>the</strong> quality aspects and access rights within Europe for adding bio<strong>gas</strong> <strong>to</strong> <strong>the</strong><strong>gas</strong> <strong>grid</strong>.• A wide band <strong>gas</strong> quality policy on new <strong>gas</strong> appliances• Stimulation of demonstration and implementation projects at various scale sizes where anincreased value of bio<strong>gas</strong> and a higher usage rate can be realised.page: 116
9 REFERENCES1 European Commission: Energy for <strong>the</strong> future: Renewable sources of energy - White Paperfor a community Strategy and Action Plan, COM (97) 599 final, Brussels 1997.2 D.O. Hall, J.I. House: Biomass energy development and carbon dioxide mitigation options,Division of Life Sciences, King's College, Londen.3 J. Badin, J. Kirschner, R. McGuckin (1999): Biomass Energy - A fuel switching strategy <strong>to</strong>reduce net carbon emissions and enhance asset utilisation, ID#99/58, United BioEnergyCommercialisation Association.4 D.L. Klass (1999): An introduction <strong>to</strong> <strong>biomass</strong> energy research - a renewable resource,Biomass Energy Research Association.5 Infocentrum duurzame energie (1999): Kerngegevens bio-energie in Nederland 1999,Informatiecentrum Duurzame Energie.6 EC (1996): Green Paper: Renewable sources of energy, publication COM(96) 576 final.7 IGU (1999), Gasification: <strong>to</strong>morrow's energy plants in a carbon-constrained world.8 Polman E.A., Rens A.M. van: Inventarisatie van <strong>gas</strong>vormige energiedragers in Europa,GAVE rapport 9903, NOVEM, Utrecht, 1999.9 Myken, A.N.: Known technologies for bio<strong>gas</strong> upgrading (Danish version). Danish GasTechnology Centre a/s. Hoersholm, June 1994.10 Lindboe, H.H. et al.: Progress Report on <strong>the</strong> Economy of Centralised Bio<strong>gas</strong> Plants. DanishEnergy Agency. Copenhagen, February 1995.11 Danish Bioenergy (Danish version). Special edition on bio<strong>gas</strong>, June 1999.12 Larsen, L.M., Jensen-Holm, C.: Gasrensning – Totalrensning af bio<strong>gas</strong>. DanmarksIngeniørakademi. Lyngby, July 1987.13 Wellinger, A., Lindberg, A.: Bio<strong>gas</strong> upgrading and utilisation. IEA Bioenergy, Task 24:Energy <strong>from</strong> biological conversion of organic waste.page: 117
14 Upgrading Landfill Gas <strong>to</strong> Natural Gas Quality in <strong>the</strong> Ne<strong>the</strong>rlands. CADDET, renewableenergy. Technical brochure No. 32. CADDET, Harwell, UK.15 Hagen, M.H., Wever, J.: Gas at Distribution Quality <strong>from</strong> Pig Manure Bio<strong>gas</strong>. Gastec.Apeldoorn, April 1994.16 Sirkar, K.K. et al.: Liquid membrane purification of bio<strong>gas</strong>. The New York State EnergyResearch and Development Authority. March 1991.17 Eriksen, K., Jensby, T., Norddahl, B.: The upgrading of bio<strong>gas</strong> <strong>to</strong> be distributed through <strong>the</strong>natural <strong>gas</strong> network – environmental benefits, technology and economy. 1998 InternationalGas Reseach Conference. San Diego, 8-11 November 1998.18 Walsh, J.L. et al.: Handbook on bio<strong>gas</strong> utilisation. Environment, Health and Safety Division,Georgia Tech Research Institute. Atlanta, February 1988.19 Ullmann’s Encyclopedia of Industrial Chemistry, Sixth Edition, 1999 (electronic release).20 Middelkoop B. van, Nisselrooy P. van: Methaniseringsinstallatie, Gastec,1999 (confidential).21 Laat J.C. de, S<strong>to</strong>kman J.: Energie uit syn<strong>the</strong>se <strong>gas</strong>, Gastec 1999.22 DVGW: Arbeitsblatt G 260 - Gasbeschaffenheit. , DVGW, Bonn, 2000.23 DVGW: Arbeitsblatt G 261 - Prüfung der Gasbeschaffenheit. ZfGW-Verlag, Frankfurt, 1985.24 DVGW: Arbeitsblatt G 262 - Nutzung von Deponie-, Klär und Biobassen, ZfGW-Verlag,Frankfurt, 199125 ISO 13868 Natural <strong>gas</strong> - Quality designation.26 ISO 13443 Natural <strong>gas</strong> - Standard reference conditions27 ISO 15403 Natural <strong>gas</strong> - Designation of <strong>the</strong> quality of natural <strong>gas</strong> for use as a compressedfuel for vehicles28 IGU: Variable Gas Quality in Domestic and Commercial use. 21 World Gas Conference,Nice, 2000.page: 118
29 EN 437: Test <strong>gas</strong>es - Test pressures - Appliance categories, 1993.30 ÖVGW: Mitteilung G 33 - Deponie<strong>gas</strong>, ÖVGW Wien, 1992.31 Heinrich h., Wegener R.: Classification methods for <strong>the</strong> knock resistance of <strong>gas</strong>eous fuels -an attempt <strong>to</strong>wards unification, 199 ASME ICE Fall Technical Conference, Ann Arbor, 1999.32 ISO/FDIS 15403: Natural <strong>gas</strong> - Designation of <strong>the</strong> quality of natural <strong>gas</strong> for use as acompressed fuel for vehicles, Geneva, 2000.33 European Union: “Directive 98/30/EG”, The official newspaper of <strong>the</strong> European Union21.7.1998.34 ISO/DIS 14532.2 Natural Gas - Terminology.35 EC/PLE, Study on Interoperability of Gas Networks in EU Countries, Final Report,24.06.1999.36 Swedish standard 155438: Bio<strong>gas</strong> as fuel for high-speed Ot<strong>to</strong> engines.37 Jean Claude Weber, Bio<strong>gas</strong>einspeisung ins öffentilche Erd<strong>gas</strong>netz, GWA2/98.38 ISO 6976:”Natural <strong>gas</strong> - Calculation of calorific values, density, relative density and Wobbeindex <strong>from</strong> composition”.39 ISO 6974: “Natural <strong>gas</strong> - Determination of composition with defined uncertainty by <strong>gas</strong>chroma<strong>to</strong>graphy”.40 ISO 6975: “Natural <strong>gas</strong> - Extended analysis”.41 ISO 6326: “Natural <strong>gas</strong> - Determination of sulphur compounds”.42 ISO 10723: ‘Natural <strong>gas</strong> - Performance evaluation for on-line analytical systems”.43 DVGW G 492: “Anlagen für die Gasmengenmessung”.44 DVGW G 685: “Gasabrechnung”.45 ISO 15970: “Natural <strong>gas</strong> - Measurement op properties - Volumetric properties”.page: 119
46 ISO 15971: “Natural <strong>gas</strong> - Measurement op properties - Combustion properties”.47 ISO 15972: “Natural <strong>gas</strong> - Measurement op properties - Single components andcondensation properties”.48 E.V.A - <strong>the</strong> Austrian Energy Agency, 1998.49 Energy in Europe. 1999 - Annual Energy Review. Direc<strong>to</strong>rate-General for Energy. EuropeanCommission. January 2000.50 Særnummer af Dansk Bioenergi. ISSN 0908-0260. Risskov: Biopress, June 1999.51 Energy 21. Danish Energy Agency. Copenhagen, April 1996.52 Follow-up on Energy 21 - Status of Energy Planning June 1999. Danish Energy Agency.Copenhagen, July 1999.53 Slurry tank <strong>gas</strong>tight covering generalization with valorization of <strong>the</strong> bio<strong>gas</strong> produced inFrance and Catalonia. Altener contract no. XVII/4.1030/Z/98-402. Labège: Eden, July 2000.54 Information <strong>from</strong> ”Association Eden”. Labege, August 2000.55 Tentscher, W. Information on bio<strong>gas</strong> upgrading in Germany. September 2000.56 Tentscher, W.: Der Landwirt als Produzent von Grünem Gas im Netzverbund – NeuePerspektiven für die Landwirtschaft. Der Landwirt als Energiewirt, II. InternationaleEUROSOLAR-Konferenz, im Rahmen der Grünen Woche Berlin. Berlin, January 14-15,2000.57 Fachverband Bio<strong>gas</strong> e.V. Freising, Germany. (www.boxer99.de/bio<strong>gas</strong>.htm)58 EWAB Marsroutes 2020, NOVEM, August 2000.59 Derde Energienota ("Third minute in Energy") Ministry of Economic affairs.60 du Preez, J. et al.: Opgradering af bio<strong>gas</strong> til natur<strong>gas</strong>kvalitet ved hjaelp aflavtryksmembraner. Slutrapport. Odense: Bioscan A/S, July 2000.page: 120
61 Kugel, G., Lohmann, J.: Bio-Erd<strong>gas</strong>-L vom Gruppenklärwerk I des Niersverbandes. Gwf<strong>gas</strong>/erd<strong>gas</strong>124 (1983) 379-38562 Lohmann, J.H.: Waste Management & Research (1984).63 Weyer, H., Schwerfer, H.J. Kommunalwirtschaft (1983).64 Jens Bo Holm-Nielsen, MSc. & Teodorita Al Seadi, Msc. South Jutland University Centre,Bioenergy Department.65 Press release of 03.07.00 of Fachverbandes Bio<strong>gas</strong>: Bio<strong>gas</strong>konsens notwendig.66 Gezetz für den Vorrang Erneuerbarer Energien (Erneuerbare-Energien-Gesetz -EEG).67 Klimaschutz durch Nutzung erneuerbarer Energien. Studie im Auftrag desBundesministeriums für Umwelt, Naturschutz und Reak<strong>to</strong>rsicherheit und desUmweltbundesamtes, Berlin (UFOPLAN-Vorhaben 298 97 340) -Bonn, Münster, Stuttgart,Wuppertal, 31. Ok<strong>to</strong>ber 1999.68 Kabinett treibt globale Klimavorsorge voran, Die Säulen des nationalenKlimaschutzprogramm stehen.page: 121
APPENDIX 1:DefinitionsBio<strong>gas</strong>BiomassDEFINITIONS, ABBREVIATIONS, AND UNITSCombustible <strong>gas</strong> obtained <strong>from</strong> a biological processAny organic material obtained <strong>from</strong> biological processesDigested manureSyn<strong>gas</strong>AbbreviationsPSACHPIGCCBiomass leaving <strong>the</strong> digestion tankIn this report: <strong>gas</strong> directly obtained <strong>from</strong> a <strong>biomass</strong> or organic waste by pyrolysis or<strong>the</strong>rmal <strong>gas</strong>ification. Syn<strong>gas</strong> can also be produceded <strong>from</strong> fossil energy sources ascoal or hydrocarbons.Pressure Swing Adsorption: in this report a process <strong>to</strong> remove carbon dioxide <strong>from</strong>raw bio<strong>gas</strong> <strong>to</strong> adjust <strong>the</strong> Wobbe-index <strong>to</strong> specification.Combined Heat and Power productionIntegrated Gasification Combined Cycle€ 1 Eurok€ 1,000 Euro = kilo EuroM€ 1,000,000 Euro = mega Euroc€ 0.01 Euro = Euro centConventions on unitsm 3Througout this report: normal cubic meterconcentrationMole procentage, mole fractions or ppm’s, unless o<strong>the</strong>rwise indicated. All volumepercentages are considered like mole percentagesbarPressure above atmospheric in bar (gauge pressure)mbarPressure in mbarpage: 122
APPENDIX 2:EXAMPLES OF PROCESSES FOR PRODUCTION OF SYNGAS FROM BIOMASS ANDORGANIC WASTEFixed bed• Bioneer• Eisenmann fixed bed• Lurgi-MPG• PRME• Prome<strong>the</strong>usFluidised bed• BTS fluid bed• Eisenmann fluid bed• Foster-Wheeler• Lurgi fluid bed• Pyroflow• SELTEC• S<strong>to</strong>rk• TPSPyrolysis• Batelle/Ferco• Brightstar• EVN• Gibros• Noell• Thermoselect• ThermogenicsHydrogenation• ECNThis appendix summarises <strong>the</strong> description of some <strong>the</strong>rmal <strong>gas</strong>ification processes as far as readilyavailable. Some descriptions are ra<strong>the</strong>r complete, o<strong>the</strong>rs are ra<strong>the</strong>r limited due <strong>to</strong> a lack of relevantpublished information.page: 123
fixed bed <strong>gas</strong>ification: BIONEERProcess name: BIONEERManufacturerFoster Wheeler Energia OyOrigin:FinlandCapacity:5 MWthDescription:Updraft fixed-bed• pressure Atmospheric• reactants AirStatus: 10 plants successful in operation since 1982Efficiency: 95 - 97%fixed bed <strong>gas</strong>ification: EISENMANNProcess name: Eisenmann rotary drum <strong>gas</strong>ificationDescription:rotary drum <strong>gas</strong>ifier• pressure atmospheric• temperature 400 - 450 °C• reactants noneThis process uses a rotary drum for <strong>the</strong> <strong>gas</strong>ification <strong>biomass</strong> or o<strong>the</strong>r organic materials. In this reac<strong>to</strong>r <strong>the</strong><strong>biomass</strong> is converted in<strong>to</strong> lean <strong>gas</strong>. The energy for drying, heating and endo<strong>the</strong>rmic <strong>gas</strong>ification is providedby a hot <strong>gas</strong> recirculation system. A part of <strong>the</strong> required energy is obtained <strong>from</strong> <strong>the</strong> reaction of <strong>the</strong> organicmaterial reacts with <strong>the</strong> oxygen entrained with <strong>the</strong> <strong>biomass</strong>.A fan extracts <strong>the</strong> process <strong>gas</strong> <strong>from</strong> <strong>the</strong> reac<strong>to</strong>r. The dust particles entrained <strong>from</strong> <strong>the</strong> reac<strong>to</strong>r with <strong>the</strong>exhaust process <strong>gas</strong> are separated out by a cyclone. A part of <strong>the</strong> exhaust process <strong>gas</strong> is transferreddirectly <strong>to</strong> <strong>the</strong> combustion chamber, while <strong>the</strong> remaining is heated <strong>to</strong> max. 650 °C by a <strong>gas</strong> burner in a <strong>gas</strong>heater and <strong>the</strong>n returned <strong>to</strong> <strong>the</strong> <strong>gas</strong>ification reac<strong>to</strong>r. This recirculation system is also used at start up <strong>to</strong> heat<strong>the</strong> plant <strong>to</strong> <strong>the</strong> required operating temperature.The inclination and speed of <strong>the</strong> drum reac<strong>to</strong>r can be varied. The level, dwell time and circulation of <strong>the</strong>material in <strong>the</strong> reac<strong>to</strong>r are controlled via <strong>the</strong> inclination, speed, shape and arrangement of <strong>the</strong> guide vanes.Material and process air flow concurrently through <strong>the</strong> reac<strong>to</strong>r.The temperature of <strong>the</strong> exhaust <strong>gas</strong> <strong>from</strong> <strong>the</strong> reac<strong>to</strong>r and of <strong>the</strong> return <strong>gas</strong> is measured and controlledcontinuously. The temperature in <strong>the</strong> reac<strong>to</strong>r is set <strong>to</strong> a value between 400 and 450 °C. The rotating drumreac<strong>to</strong>r is installed in a static housing with external insulation.Generated <strong>gas</strong> is used mainly in a spark-ignition <strong>gas</strong> engine for generating electricity. The exhaust <strong>gas</strong> willpass a heat exchanger and <strong>the</strong> recovered heat will be used for drying <strong>the</strong> <strong>biomass</strong> feed.page: 124
fixed bed <strong>gas</strong>ification: LURGI-MPGProcess name: Lurgi Multi Purpose GasificationManufacturerLurgiOrigin:GermanyCapacity:typically 150,000 <strong>to</strong>ns/yearDescription:fixed bed <strong>gas</strong>ifier• pressure 1200 - 1450 °C• temperature 30 - 75 bar• reactants oxygen and steamStatus:demonstrated for coal and refinery residuesEfficiencynot reportedThe MPG <strong>gas</strong>ification is carried out at temperatures of 1200 - 1450 °C and pressures of between 30 and 75bar. The feeds<strong>to</strong>ck enters <strong>the</strong> refrac<strong>to</strong>ry-lined reac<strong>to</strong>r through a <strong>to</strong>p-mounted, specially designed burner.Oxygen is mixed with steam as a modera<strong>to</strong>r prior <strong>to</strong> being fed <strong>to</strong> <strong>the</strong> burner.Reac<strong>to</strong>r configurationsSoot and metals ashes are removed <strong>from</strong> <strong>the</strong> raw syn<strong>gas</strong> by means of wash water. The resulting soot slurryis routed <strong>to</strong> slurry treatment. After separation of <strong>the</strong> ash-soot, <strong>the</strong> greater part of this water is recycled asreturn water <strong>to</strong> <strong>the</strong> washing units. The excess water is routed <strong>to</strong> waste water treatment. The <strong>gas</strong>ification unittypically consists of three main components: <strong>the</strong> reac<strong>to</strong>r, <strong>the</strong> syn<strong>gas</strong> cooling section and <strong>the</strong> carbonhandling system complemented by <strong>the</strong> Metals Ash Recovery System (MARS).To provide maximum feeds<strong>to</strong>ck and product flexibility, Lurgi offers two variants for <strong>the</strong> syn<strong>gas</strong> coolingsection, <strong>the</strong> boiler and <strong>the</strong> quench configuration. The boiler configuration is suitable for feeds<strong>to</strong>cks with lowconcentrations of contaminants, generates considerable amounts of high-pressure steam and offers highestenergy efficiency. The quench configuration is required when <strong>the</strong> feeds<strong>to</strong>ck contamination is above <strong>the</strong>boiler's. This configuration allows feeds<strong>to</strong>cks like coke/coal slurries and wastes, offers highest flexibility atlowest investment cost.Quench configurationIn <strong>the</strong> quench configuration, <strong>the</strong> hot raw <strong>gas</strong> <strong>from</strong> <strong>the</strong> reac<strong>to</strong>r is shock-cooled, ‘quenched’, with water whichis injected in<strong>to</strong> a quench nozzle. The <strong>gas</strong> is cooled almost instantaneously <strong>to</strong> steam saturation temperatureand leaves <strong>the</strong> quench separa<strong>to</strong>r sideways. When processing high-ash feeds<strong>to</strong>cks, <strong>the</strong> molten slag formingflows down <strong>the</strong> reac<strong>to</strong>r wall in<strong>to</strong> <strong>the</strong> quench nozzle where it is blast-cooled <strong>to</strong> form glassy spheres which arewithdrawn via <strong>the</strong> slag hopper. This glassy slag carries most of <strong>the</strong> heavy metals and water-insolubles. It isnon-leachable and can be easily disposed of (e.g. in road construction).The remaining ash and soot particles are removed <strong>from</strong> <strong>the</strong> <strong>gas</strong> in <strong>the</strong> venturi scrubber downstream of <strong>the</strong>quench. Fur<strong>the</strong>r cooling occurs in a medium-pressure steam boiler, which generates steam at 15 <strong>to</strong> 30 bars.page: 125
Final cooling is accomplished by means of cooling water in a <strong>gas</strong> cooler <strong>from</strong> where <strong>the</strong> <strong>gas</strong> is routed <strong>to</strong> <strong>the</strong>desulfurisation unit (e.g. Rectisol unit). The soot slurry forming in <strong>the</strong> venturi scrubber is collected <strong>to</strong>ge<strong>the</strong>rwith <strong>the</strong> condensates and sent <strong>to</strong> <strong>the</strong> metals ash recovery system.Boiler configurationIn <strong>the</strong> boiler configuration <strong>the</strong> hot raw <strong>gas</strong> enters directly a high-pressure steam boiler. The 100 <strong>to</strong> 140 barsteam generated can be used <strong>to</strong> power a steam turbine or in an IGCC power plant.Removal of <strong>the</strong> ash-soot particles <strong>from</strong> <strong>the</strong> raw <strong>gas</strong> is accomplished in a two-stage water wash. The latterconsists of a wash quench with a soot separa<strong>to</strong>r followed by a packed <strong>to</strong>wer, <strong>the</strong> ash-soot scrubber. Afterleaving <strong>the</strong> scrubber at a temperature of about 40 °C, <strong>the</strong> <strong>gas</strong> can be desulfurised.Metals Ash Recovery System (MARS)The soot slurry <strong>from</strong> <strong>the</strong> <strong>gas</strong>ification unit (in both <strong>the</strong> quench and boiler configuration) is routed <strong>to</strong> <strong>the</strong> MetalsAsh Recovery System (MARS). The slurry is filtered leaving a filter cake with residual moisture of about 80wt.% and a clear water filtrate, which is partly recycled as quench or scrubbing water. The filter cake issubjected <strong>to</strong> controlled combustion in a multiple-hearth furnace. This type of furnace allows <strong>the</strong> combustionof <strong>the</strong> soot <strong>to</strong> take place under conditions where <strong>the</strong> vanadium oxides (of refinery residues) nei<strong>the</strong>r melt norcorrode. The product is an approx. 75 wt.% vanadium concentrate (containing also <strong>the</strong> nickel and iron <strong>from</strong><strong>the</strong> crude) which can be sold <strong>to</strong> metal reclaimers. The process is au<strong>to</strong><strong>the</strong>rmal in principle, <strong>the</strong> heat ofcombustion being sufficient <strong>to</strong> evaporate <strong>the</strong> moisture content of <strong>the</strong> filter cake.Depending on <strong>the</strong> feeds<strong>to</strong>ck composition, <strong>the</strong> oxidant and <strong>the</strong> actual <strong>gas</strong>ification temperature, <strong>the</strong> rawsyn<strong>gas</strong> (H 2 , CO) contains H 2 O, CO 2 , CH 4 , H 2 S, N 2 , NH 3 , HCN and Ar in various concentrations.A 150,000 <strong>to</strong>n/year plant is located in Germany and operated by Schwarze Pumpe. Possible feeds<strong>to</strong>cks aresewage sludge, household rubbish, plastic and wood. Products of <strong>the</strong> plant are methanol, electricity andsteam.fixed bed <strong>gas</strong>ification: PRME-GASIFIERProcess name: PRMEManufacturerPRM Energy Systems, Inc.Capacity:1000 <strong>to</strong>ns/day municipal wasteDescription:• pressure atmospheric• temperature 600 – 1300 ºC• reactants air or oxygenHomepagehttp://www.prmenergy.comThe PRME technology is designed as an air blown atmospheric <strong>gas</strong>ifier, which operates under slightlypage: 126
negative pressure. Depending upon <strong>the</strong> feed s<strong>to</strong>ck, <strong>the</strong> air blown system produces a syn<strong>gas</strong> containing alow calorific value of 3.7 <strong>to</strong> 7.5 MJ/m 3 . A higher calorific value can be reached with <strong>the</strong> use of oxygeninstead of air.A complete PRME <strong>biomass</strong> <strong>gas</strong>ification system includes a fuel metering bin, <strong>the</strong> reac<strong>to</strong>r/<strong>gas</strong>ifier, <strong>the</strong>combustion tube and chamber, <strong>the</strong> <strong>gas</strong>ifier cooling water system, water cooled ash discharge conveyors,multi-zoned combustion air supply, rotary feeders and instrumentation required <strong>to</strong> provide au<strong>to</strong>matic controlover <strong>the</strong> process. The entire <strong>gas</strong>ification/combustion process, <strong>from</strong> feed <strong>to</strong> ash discharge, is controlledmanually or by computer.The PRME <strong>gas</strong>ifier is basically a vertical cylindrical steel shell, reduced in diameter in <strong>the</strong> upper portion andlined with a refrac<strong>to</strong>ry capable of withstanding temperatures as high as 1560 ºC in a reducing atmosphere.The cross sectional area of <strong>the</strong> upper portion of <strong>the</strong> <strong>gas</strong>ifier is reduced <strong>to</strong> provide <strong>the</strong> turbulence required <strong>to</strong>insure proper mixing of <strong>the</strong> product <strong>gas</strong> and <strong>the</strong> combustion air introduced in<strong>to</strong> <strong>the</strong> combustion tubes in thisarea of <strong>the</strong> <strong>gas</strong>ifier.Fuel is metered <strong>to</strong> <strong>the</strong> <strong>gas</strong>ifier <strong>from</strong> <strong>the</strong> fuel metering bin. This bin is equipped with an input conveyor and anoutput conveyor that delivers fuel <strong>to</strong> <strong>the</strong> <strong>gas</strong>ifier. The speed of <strong>the</strong> output conveyor is au<strong>to</strong>matically adjustedby <strong>the</strong> au<strong>to</strong>matic control system <strong>to</strong> maintain a pre-set temperature in <strong>the</strong> first stage <strong>gas</strong>ification zone.Discharge <strong>from</strong> <strong>the</strong> output conveyor is directed through an impact weigh metering device that providesprecise indication and control of <strong>the</strong> fuel feed rate.Fuel is introduced <strong>to</strong> <strong>the</strong> <strong>gas</strong>ifier by a water-cooled screw conveyor that discharges in<strong>to</strong> <strong>the</strong> drying andheating zone of <strong>the</strong> <strong>gas</strong>ifier. The <strong>gas</strong>ification process is controlled by <strong>the</strong> proportioned application of<strong>gas</strong>ification and combustion air in a manner that supports efficient <strong>gas</strong>ification.Residence time in <strong>the</strong> <strong>gas</strong>ifier is varied by a residence control system that is adjusted <strong>to</strong> achieve a targetcarbon content of <strong>the</strong> ash residue. In <strong>the</strong> <strong>gas</strong>ification zone of <strong>the</strong> <strong>gas</strong>ifier, approximately 10 <strong>to</strong> 12% of <strong>the</strong>s<strong>to</strong>ichiometric air requirement is admitted in<strong>to</strong> <strong>the</strong> <strong>gas</strong>ification air distribution area. The application of<strong>gas</strong>ification air is multi-zoned and is controlled <strong>to</strong> maintain <strong>the</strong> proper temperature required <strong>to</strong> volatilise <strong>the</strong><strong>biomass</strong> and allow partial combustion of <strong>the</strong> fixed carbon. Temperatures in this zone is controlled between600 o C and 1300 o C, depending on <strong>the</strong> particular <strong>biomass</strong> fuel and <strong>the</strong> required ash quality. A low<strong>gas</strong>ification airflow rate (< 0.1m/s) through <strong>the</strong> <strong>gas</strong>ification zone, coupled with a low feed s<strong>to</strong>ck entrypointand continuous ash discharge minimises <strong>the</strong> amount of particulate matter entrained in <strong>the</strong> <strong>gas</strong>ifier exhaust.Combustion of <strong>the</strong> <strong>gas</strong>es starts in <strong>the</strong> combustion tube assembly where <strong>the</strong> temperature of <strong>the</strong> <strong>gas</strong>es isincreased <strong>to</strong> promote <strong>the</strong>rmal cracking of tars and hydrocarbons that were liberated during <strong>gas</strong>ification.Partial combustion of <strong>gas</strong>es in <strong>the</strong> combustion tube assembly, <strong>the</strong> use of mechanical bed agitation andprecise control of <strong>the</strong> zoning of <strong>gas</strong>ification air produces a clean, low energy content <strong>gas</strong> that can be burnedin <strong>the</strong> combustion tube and chamber for drying applications or in <strong>the</strong> radiant section of <strong>the</strong> boiler. The<strong>gas</strong>ification rate is controlled by demand <strong>from</strong> <strong>the</strong> dryer or boiler. The boiler exhaust is clean and may bepage: 127
used for direct drying applications, including food grains. Alternatively, when <strong>biomass</strong> destruction withoutenergy recovery is desired, <strong>the</strong> clean <strong>gas</strong>es may be diverted <strong>to</strong> <strong>the</strong> atmosphere via <strong>the</strong> combustion tubevent.A 1,000 <strong>to</strong>ns/day (800 <strong>to</strong>ns/day dry) oxygen fed system designed <strong>to</strong> <strong>gas</strong>ify processed municipal solid wastecontaining 10% or 20% moisture and a calorific value of 18 MJ/kg will produce <strong>the</strong> following clean syn<strong>gas</strong>with a composition as given in table 61.Quality Value UnitRDF with10%MoistureRDF with20%MoistureComponents• Carbon monoxide34 29 %• Hydrogen42 43- %• Carbon dioxide19 22 %• Nitrogen and argon22 %• Water33 %Calorific value 9.7 9.3 MJ/m 3Table 61: Syn<strong>gas</strong> composition and properties <strong>from</strong> <strong>the</strong> PRME processTwo plants are on <strong>the</strong> program:• Tulsa, Oklahoma Demonstration plant• A 3.5 MW Biomass Fired Engine Genera<strong>to</strong>r system utilising olive residues as feed s<strong>to</strong>ck is scheduledfor start-up in August 2000.Data on costs are available for <strong>the</strong> 1,000 <strong>to</strong>n/day (800 <strong>to</strong>ns/day dry) oxygen fed system designed <strong>to</strong> <strong>gas</strong>ifyprocessed municipal solid waste. This system consists of two Model KC-320 <strong>gas</strong>ifiers, each 19 M€ and one450 TPD Oxygen system at 11 M€. This 50 M€ budget comprises a turnkey plant for <strong>the</strong> production ofelectricity <strong>from</strong> municipal waste.page: 128
fixed bed <strong>gas</strong>ification: Prome<strong>the</strong>usProcess name: Prome<strong>the</strong>usManufacturerProCone GmbHCapacity:0.2 - 5 MWeDescription:• pressure atmospheric (sligtly below atmospheric <strong>to</strong> avoid atmopheric emissions)• temperature multistage <strong>gas</strong>ification:• drying 200 o C• <strong>gas</strong>ification 650 o C• oxidation 1600 o C• reduction 800 o C• feed old and fresh wood waste• reactants airStatus:mature projectsApplicationcombined power and heat generationInformation:personal communicationEfficiency84% of <strong>the</strong> energy in <strong>the</strong> bio<strong>gas</strong> is transferred <strong>to</strong> <strong>the</strong> syn<strong>gas</strong>Quality Unit ValueComponents• Carbon monoxide%14 – 24• Hydrogen%10 – 22• Methane%0- 6• Carbon dioxide%8 – 16• Nitrogen%balance• Water%8 – 10Calorific value MJ/m 3 4 - 6Table 62: Syn<strong>gas</strong> composition and properties of <strong>the</strong> Prome<strong>the</strong>us processfluidised bed <strong>gas</strong>ification:BTS fluidised bedProcess descriptionpressurised fluidised bedManufacturerBTSReaction temperature about 750 °CReaction pressureabout 4 barReactantssteam, flue <strong>gas</strong>esClean upcyclone, downdraft evapora<strong>to</strong>r, dust filter, quench coolerpage: 129
fluidised bed <strong>gas</strong>ification:EISENMANN FLUIDISED BEDProcess descriptionpressurised fluidised bedManufacturerEisenmannReaction temperature about 750°CReaction pressureabout 4 barReactantssteam, flue <strong>gas</strong>esClean upcyclone, downdraft evapora<strong>to</strong>r, dust filter, quench coolerProperties syn<strong>gas</strong>Hydrogen 20%Calorific valuemedium heating valueEisenmann offers <strong>the</strong> <strong>gas</strong>ification of organic materials and <strong>biomass</strong> using a pressurised fluidised bed. In <strong>the</strong>reac<strong>to</strong>r, at a temperature of about 750 °C and a pressure of about 4 bars, <strong>biomass</strong> is converted <strong>to</strong> syn<strong>gas</strong>using steam. After leaving <strong>the</strong> <strong>gas</strong>ifier, <strong>the</strong> heat in <strong>the</strong> syn<strong>gas</strong> is used <strong>to</strong> generate steam for <strong>the</strong> <strong>gas</strong>ificationprocess. After this heat exchange <strong>the</strong> syn<strong>gas</strong> is cleaned and cooled fur<strong>the</strong>r down by using a cyclone, adowndraft evapora<strong>to</strong>r, a dust filter and a quench cooler.A part of <strong>the</strong> generated <strong>gas</strong> is taken away <strong>from</strong> <strong>the</strong> <strong>gas</strong>ifier and passed through in a hot <strong>gas</strong> dust filter. In ajet compressor this <strong>gas</strong> flow will be compressed by using generated steam and will be incinerated in acombustion chamber. The flue <strong>gas</strong> generated by <strong>the</strong> incineration will be fed in<strong>to</strong> <strong>the</strong> <strong>gas</strong>ifier and will be used<strong>the</strong>re as rotational flow <strong>gas</strong>, as reactant and as heat supply in <strong>the</strong> <strong>gas</strong>ification process.In this <strong>gas</strong>ification process, <strong>the</strong> heat for <strong>gas</strong>ification is generated outside of <strong>the</strong> <strong>gas</strong>ification reac<strong>to</strong>r and willbe transmitted in an indirect way <strong>to</strong> <strong>the</strong> starting material. This generates a syn<strong>gas</strong> with a medium calorificvalue and a relatively high portion of hydrogen of approximately 20%.fluidised bed <strong>gas</strong>ification:Process name:Capacity:FOSTER WHEELERFW CFB Foster Wheeler circulating fluidised bed <strong>gas</strong>ification17 - 60 MW thDescription:atmospheric fluidised bed <strong>gas</strong>ifier• feed <strong>biomass</strong> with 20 - 60% moisture• pressure atmospheric• temperature 800 - 1000 °C• reactant airStatus:commercialEfficiency: 99.8%page: 130
Nearly two hundred Foster Wheeler combustion and <strong>gas</strong>ification systems are in operation. Recently a FWCFB was delivered <strong>to</strong> <strong>the</strong> Lathi plant in Finland. The FW CFB process is used <strong>to</strong> deliver heat andcombustible <strong>gas</strong>es <strong>to</strong> a power plant. The FW CFB performs partly as a <strong>gas</strong>ifier and partly as a combus<strong>to</strong>r.The syn<strong>gas</strong> has a calorific value of only 2 MJ/m 3 . The conversion of carbon <strong>to</strong> fuel <strong>gas</strong>es and heat reacheshowever an efficiency of 99.8%.fluidised bed <strong>gas</strong>ification:LURGI FLUID BEDProcess descriptioncirculating fluidised bedManufacturerLurgiReaction temperature about 750 °CReaction pressureatmosphericReactantsairClean uptwo sequencing cyclones, cooling, bag house filter, two stage scrubbingIn an international consortium Lurgi is installing an 8000 kg/hour <strong>gas</strong>ifier near Pisa (Italy). This <strong>gas</strong>ifier is apart of a <strong>biomass</strong> fired Integrated Gasification Combined Cycle (IGCC) plant. The <strong>to</strong>tal energy energyefficiency of <strong>the</strong> plant is 32%. Expecting about 40 - 50% efficiency for a 10 MWe combined cycle plant, <strong>the</strong><strong>gas</strong>ification efficiency is about 80 - 70%. The ‘first of a kind’ cost of this installation are 2300 €/kWe. Laterplants can be built at a substantially lower cost.Quality Value UnitComponents• Carbon monoxide22 %• Hydrogen17 %• Methane4 %• O<strong>the</strong>r hydrocarbons2 %• Carbon dioxide13 %• Nitrogen and argon41 %• Water1 %Calorific value 7 MJ/m 3Table 63: Syn<strong>gas</strong> properties <strong>from</strong> <strong>the</strong> Lurgi fluidised bed processA Lurgi CFB-<strong>gas</strong>ifier system including cleaning will cost about 50 M€ for 100 MWth input.fluidised bed <strong>gas</strong>ification:PYROFLOWprocess name:Pyroflow also known as Ahlstrom PyropowerManufacturerFOSTER WHEELER ENERGIE OYOrigin:Finlanddescription:atmospheric, circulation fluidised-bed <strong>gas</strong>ifiercapacity:15 - 35 MWthnumber: 5 plants in operation since 1981page: 131
fluidised bed <strong>gas</strong>ification:SELTECprocess name:Pyroflow also known as Ahlstrom PyropowerManufacturerFOSTER WHEELER ENERGIE OYOrigin:Finlanddescription:atmospheric, circulation fluidised-bed <strong>gas</strong>ifiercapacity:15 - 35 MWthnumber: 5 plants in operation since 1981fluidised bed <strong>gas</strong>ification:STORKProcess descriptioncirculating fluidised bedManufacturerS<strong>to</strong>rkcapacity500 kWthEnergy efficiency 62%Reactantsair and steamClean uptwo cyclonesQuality Value UnitComponents• Carbon monoxide11 %• Hydrogen8 %• Methane4 %• O<strong>the</strong>r hydrocarbons 1 %• Carbon dioxide15 %• Nitrogen and argon 10 %Contaminants• Ammonia• Light tars• Heavy tars1700 ppm6 g/m 3800 mg/m 3Calorific value 5 MJ/m 3Table 64: Example syn<strong>gas</strong> properties <strong>from</strong> <strong>the</strong> S<strong>to</strong>rk plant at ECN operating on <strong>biomass</strong>The S<strong>to</strong>rk <strong>gas</strong>ifier is a circulating fluidised bed <strong>gas</strong>ifier designed for experiments installed at ECN in Petten.The maximum input of <strong>the</strong> installation amounts <strong>to</strong> 500 kWth. Different feeds<strong>to</strong>cks can be used as input fuel.The <strong>biomass</strong> is <strong>gas</strong>ified using air and steam.The experimental system exists of several feeding tanks <strong>to</strong> allow <strong>the</strong> mixing of different feeds<strong>to</strong>cks, areac<strong>to</strong>r (6 m high) with air and steam inputs, a circulation loop with cyclone and an additional cyclone forseparating <strong>the</strong> ashes.There is a bench scale plant at ECN in Petten. A demonstration plant will be built in Hengelo, <strong>the</strong>Ne<strong>the</strong>rlands.page: 132
fluidised bed <strong>gas</strong>ification:Process descriptionManufacturerReaction pressureTPSpressurised fluidised bedTermiska Processor Sweden ABatmosphericQuality Value UnitComponents• Carbon monoxide16 %• Hydrogen8 %• Methane6 %• O<strong>the</strong>r hydrocarbons5 %• Carbon dioxide15 %• Nitrogen and argon53 %Calorific value 5 MJ/m 3Table 65: Typical properties of syn<strong>gas</strong> <strong>from</strong> <strong>the</strong> TPS processPlants• THERMIE project ARBRE UK• UNDP project Brazil• Crève-in-Chianti ItalyQuality Value UnitComponents• Carbon monoxide9• Hydrogen9• Methane7• O<strong>the</strong>r hydrocarbons5• Carbon dioxide16• Nitrogen and argon46Contaminants• Hydrogen sulphide• Particulates• Condensate%%%%%%494884ppmg/m 3g/m 3Calorific value 7 MJ/m 3Table 66: Specific <strong>gas</strong> composition at <strong>the</strong> Crève-in-Chianti plantpyrolysis:BATELLE / FERCOProcess name: Battelle - FERCOOrigin:USACapacity:typical 45 MWthDescription:two reac<strong>to</strong>r system: A pyrolysis and a combustion reac<strong>to</strong>r. The circulation of sandmaintains <strong>the</strong> heat exchange between <strong>the</strong> reac<strong>to</strong>rs• pressure atmospheric• reactants airStatus:demonstrationpage: 133
The Battelle <strong>biomass</strong> <strong>gas</strong>ification process, licensed in North America by Future Energy ResourcesCorporation (FERCO) in Atlanta, Georgia, produces a medium-calorific product <strong>gas</strong> without <strong>the</strong> need for anoxygen plant. The process uses two reac<strong>to</strong>rs: a pyrolysis reac<strong>to</strong>r in which <strong>the</strong> <strong>biomass</strong> is converted in<strong>to</strong> amedium-Btu <strong>gas</strong> and residual char, and a combus<strong>to</strong>r that burns <strong>the</strong> residual char <strong>to</strong> provide heat for <strong>the</strong>pyrolysis. Heat transfer between reac<strong>to</strong>rs is accomplished by circulating sand between <strong>the</strong> pyrolysor and <strong>the</strong>combus<strong>to</strong>r. The process utilises <strong>the</strong> high reactivity of <strong>biomass</strong> feeds<strong>to</strong>cks.The very rapid heating of <strong>the</strong> raw <strong>biomass</strong> minimises <strong>the</strong> tar formation. Efficiently used solid residue is <strong>the</strong>heat source for <strong>the</strong> pyrolysis process. The produced syn<strong>gas</strong> is interchangeable with natural <strong>gas</strong> as a <strong>gas</strong>turbine fuel. The syn<strong>gas</strong> fuelled a 200 kWe Solar <strong>gas</strong> turbine. Only minor modifications <strong>to</strong> <strong>the</strong> fuel feedsystem where needed. A single solenoid valve switches between <strong>the</strong> natural <strong>gas</strong> and syn<strong>gas</strong> <strong>to</strong> <strong>the</strong> fuelinput of <strong>the</strong> <strong>gas</strong> turbine.Quality Value UnitComponents• Carbon monoxide30 %• Hydrogen4 %• Methane4 %• O<strong>the</strong>r hydrocarbons1 %• not reported61 %Calorific value 7 MJ/m 3Table 67: Exampleof <strong>gas</strong> composition of <strong>the</strong> Batelle/Ferco processThe first large-scale plant, rated at 40 MWth, was started in 1999 at <strong>the</strong> McNeil power station of Burling<strong>to</strong>nElectric Department in Burling<strong>to</strong>n, Vermont.pyrolysis:BRIGHTSTARProcess name: BrightstarOrigin:USACapacity:typical 1.5 <strong>to</strong>n/hour modulesDescription:pyrolysis followed by steam reforming• reactants waterStatus:demonstratedEfficiency: 80 - 97%The Brightstar process requires and utilises moisture in <strong>the</strong> <strong>biomass</strong> as a reactant and uses no air or o<strong>the</strong>rexternal source of oxygen. In essence, <strong>the</strong> Brightstar system uses fast pyrolysis of <strong>the</strong> <strong>biomass</strong> followed bya steam reforming of <strong>the</strong> resulting constituents. The entire process occurs in a reducing environment. Thereactions in <strong>the</strong> Brightstar <strong>gas</strong>ifier are: flash evaporation of inherent moisture, volatisation of higher organiccomponents, heavy hydrocarbon cracking, pyrolysis, and steam reforming. The process is shown in figure22.page: 134
The process achieves a 97% conversion of <strong>biomass</strong> carbon <strong>to</strong> useful syn<strong>gas</strong> without producing troublesometars, oils, or o<strong>the</strong>r contaminating effluents. The process is robust in its ability <strong>to</strong> handle feeds<strong>to</strong>cks withvarying degrees of inherent moisture, ranging <strong>from</strong> dry wood (in which case moisture is actually added <strong>to</strong><strong>the</strong> feeds<strong>to</strong>ck) <strong>to</strong> organic sludge with moisture contents of over 60%. In traditional <strong>gas</strong>ification systems anymoisture in <strong>the</strong> feeds<strong>to</strong>ck results in an energy efficiency penalty. This process utilises a part of <strong>the</strong> moisture<strong>to</strong> produce hydrogen and o<strong>the</strong>r combustible <strong>gas</strong>es. At 40% moisture in <strong>the</strong> feeds<strong>to</strong>ck, <strong>the</strong> system achievesan efficiency of about 80%.Figure 22: Process Flow Diagram of <strong>the</strong> Brightstar process Feed SystemDepending on <strong>the</strong> size, consistency and nature of <strong>the</strong> <strong>biomass</strong>, <strong>the</strong> material is often routed through ahammer-mill or tub grinder/classifier before entering <strong>the</strong> plant’s metering bin located above <strong>the</strong> feed system.The material is fed by gravity in<strong>to</strong> <strong>the</strong> metering bin where it enters a screw feed system. The material is <strong>the</strong>nconveyed through a proprietary sealing mechanism that serves as <strong>the</strong> pressure seal on <strong>the</strong> front end of <strong>the</strong>system, keeping air out of <strong>the</strong> reformer and keeping syn<strong>gas</strong> <strong>from</strong> backing up in<strong>to</strong> <strong>the</strong> feed system. Thematerial received <strong>from</strong> <strong>the</strong> screw feeder is <strong>the</strong>n conveyed with recycled compressed syn<strong>gas</strong> in<strong>to</strong> <strong>the</strong> primaryheat exchanger.page: 135
Primary heat exchangerThe primary heat exchanger serves two functions. First, <strong>biomass</strong> is conveyed with syn<strong>gas</strong> in<strong>to</strong> <strong>the</strong>convection section where pre-heating, devolitisation, and evaporation of water occurs. In addition, afterreforming, as <strong>the</strong> hot syn<strong>gas</strong> leaves <strong>the</strong> primary reformer, it gives up its sensible heat energy <strong>to</strong> <strong>the</strong> primaryheat exchanger and is cooled <strong>to</strong> <strong>the</strong> desired process temperature before it exits <strong>to</strong> <strong>the</strong> <strong>gas</strong> filter.Primary reformerThe pre-heated, partially reformed (<strong>gas</strong>ified) <strong>biomass</strong> and conveying syn<strong>gas</strong> pass <strong>from</strong> <strong>the</strong> convectionsection of <strong>the</strong> primary heat exchanger in<strong>to</strong> <strong>the</strong> radiant coil section of <strong>the</strong> primary reformer where hightemperature steam reforming takes place.Gas filterThis unit receives syn<strong>gas</strong> <strong>from</strong> <strong>the</strong> primary heat exchanger. The syn<strong>gas</strong> and any char (inorganic solids andany unreformed carbon) are routed through barrier type filter elements where <strong>the</strong> char is collected andremoved as a dry, innocuous residue. The char is delivered <strong>to</strong> a collection bin for reuse or disposal.Final syn<strong>gas</strong> coolerThis air-cooled heat exchanger receives clean syn<strong>gas</strong> <strong>from</strong> <strong>the</strong> <strong>gas</strong> filter and reduces <strong>the</strong> <strong>gas</strong> temperature<strong>to</strong> <strong>the</strong> desired level for supplying power generation equipment, or o<strong>the</strong>r fuel uses.The <strong>gas</strong> composition resulting <strong>from</strong> various forms of <strong>biomass</strong> is extraordinarily similar. However, certain keyprocess variables can be altered <strong>to</strong> adjust <strong>the</strong> composition of <strong>gas</strong> produced by <strong>the</strong> process. The compositionof <strong>the</strong> syn<strong>gas</strong> can be varied by control of key process parameters but is generally as given in table 68. Thesyn<strong>gas</strong> is virtually free of particulates.Quality Value UnitComponents• Carbon monoxide27 %• Hydrogen30 %• Methane11 %• Carbon dioxide15 %• Nitrogen10 %Contaminants• Hydrogen sulphiden.a. ppm• Particulatesn.a. g/m 3• Condensaten.a. g/m 3Calorific value 11 MJ/m 3Table 68: Typical <strong>gas</strong> composition obtained by <strong>the</strong> Brightstar processThe Brightstar process is in operation at two plants:• A mill in East Texas, USA. Bark is <strong>gas</strong>ified <strong>to</strong> replace natural <strong>gas</strong> used in <strong>the</strong>rmal oxidisers. System with3 modules. Expanding <strong>to</strong> 20 modules in planning.page: 136
• Whytes Gully Landfill, Australia. Urban green waste and municipal solid waste and pulp are <strong>gas</strong>ified.The produced syn<strong>gas</strong> is used <strong>to</strong> generate electricity.pyrolysis:Process name:Description:EVN-PYROLYSIS GASIFIEREVN pyrolysor/<strong>gas</strong>ifierpyrolysis reac<strong>to</strong>r, ash removal cyclone, cooler, water scrubber and <strong>gas</strong> dryerQuality Value UnitComponents• Carbon monoxide18 %• Hydrogen20 %• Methane5 %• Not reported57 %Table 69: Gas properties arising <strong>from</strong> <strong>the</strong> EVN pyrolysor / <strong>gas</strong>ifier processpyrolysis:GIBROS PECProcess name: GIBROS PECCapacity: 17,000 - 34,000 m 3 /hDescription:pyrolysis followed by <strong>gas</strong>ification of organic residualsPyrolysis• pressure atmospheric• temperature 500 - 550 o C• reactants natural <strong>gas</strong> or cleaned syn<strong>gas</strong>Gasification• pressure atmospheric• temperature 1200 o C• reactants pure oxygen and steamAsh melting• pressure atmospheric• temperature1 600-2000 o C• reactants natural <strong>gas</strong>Status:commercialThe Gibros PEC system is developed for <strong>the</strong> <strong>gas</strong>ification of different kinds of waste, like sewage sludge,tires, chemical waste, plastics etc. The minimal energy input is 12 MJ/kg. After a mechanical preparation <strong>the</strong>waste is dried <strong>to</strong> 95% dry material. The pyrolysis at a temperature of 500 <strong>to</strong> 550 o C with energy input <strong>from</strong>natural <strong>gas</strong> or cleaned syn<strong>gas</strong>. The pyrolysis products are <strong>gas</strong>ified with oxygen at temperature of 1200 ºC.In <strong>the</strong> cleaning of <strong>the</strong> syn<strong>gas</strong>, acid components are removed with NaOH or Ca(OH) 2 . Heating and filteringremove metal-oxides. Hydrogen sulphide is catalytically removed. Then <strong>the</strong> syn<strong>gas</strong> is passed through anpage: 137
active coal filter and cooled. The resulting syn<strong>gas</strong> quality is given in table 70. The system availability isestimated at 7,000 hours/year. There are two plants currently in operation:• Aalen: pilot plant 1983 <strong>to</strong> 1987, commercial plant built in 1996 (in operation).• Freiberg: since 1994 in operation with industrial waste as feeds<strong>to</strong>ck, 20,000 <strong>to</strong>n/year.Quality Value UnitComponents• Carbon monoxide38 %• Hydrogen46 %• Methane0 %• O<strong>the</strong>r hydrocarbons0 %• Carbon dioxide14 %• Nitrogen and argon1 %Contaminants• Ammonia0.5 ppm• Sulphur containing2 ppm• Hydrogen chloride1 ppm• Metal containing2 ppm• Metal carbides0 ppmCalorific value typical 10 MJ/m 3Table 70: Syn<strong>gas</strong> properties of <strong>the</strong> Gibros PEC processpyrolysis:NOELL CONVERSION PROCESSProcess name: NTCManufacturerNOELLDescription:pyrolysis followed by <strong>gas</strong>ification of organic residualsPyrolysis• pressure atmospheric• temperature 550 o C• reactants noneGasification• pressure 25 bar• temperatureof 2000 o C• reactants pure oxygen and steamStatus:pre-commercial pilots plantsThe waste is pyrolysed in an indirectly heated drum at a temperature at 550 o C. Pyrolysis cokes are cooled,separated <strong>from</strong> <strong>the</strong> metals, pulverised and brought <strong>to</strong> <strong>the</strong> <strong>gas</strong>ifier reac<strong>to</strong>r. The pyrolysis <strong>gas</strong>es are cooled,compressed and brought <strong>to</strong> <strong>the</strong> <strong>gas</strong>ifier reac<strong>to</strong>r. The <strong>gas</strong>ification process is at a pressure of 25 bar. Due <strong>to</strong><strong>the</strong> high temperature of 2000 o C <strong>the</strong> metal oxides melt and form slags. Water is injected <strong>to</strong> cool <strong>the</strong> syn<strong>gas</strong>leaving <strong>the</strong> <strong>gas</strong>ifier. The raw syn<strong>gas</strong> is cleaned by SNCR and dry sorption.Pilot projects:page: 138
• Freiburg• Lausitz• Salzgitterpyrolysis:THERMOSELECTProcess name: ThermoselectDescription:pyrolysis followed by <strong>gas</strong>ification of organic residualsPyrolysis• pressure atmospheric• temperature 800 o C• reactants noneGasification• pressure atmospheric• temperature 1200 o C• reactants pure oxygen and steamAsh melting• pressure atmospheric• temperature 1600 – 2000 o C• reactants natural <strong>gas</strong>Status:commercialIn <strong>the</strong> first step of <strong>the</strong> Thermoselect process <strong>the</strong> waste is compressed in order <strong>to</strong> increase density and <strong>to</strong>exclude air and fluids. In <strong>the</strong> pyrolysis <strong>the</strong> solid waste is heated <strong>from</strong> 100 - 200 o C at <strong>the</strong> beginning of <strong>the</strong>pyrolysis channel <strong>to</strong> 800 o C at <strong>the</strong> end of <strong>the</strong> channel. The pyrolysis cokes and <strong>gas</strong>es are <strong>gas</strong>ified in a hightemperature reac<strong>to</strong>r. The hot syn<strong>gas</strong> leaving <strong>the</strong> <strong>gas</strong>ifier is ‘shock cooled’ and solid mass particles and acidsare removed. The cooled syn<strong>gas</strong> is fur<strong>the</strong>r cooled by excluding water damp and cleaned through an activecoal filter.The inorganic components like metals (ashes) are melted with <strong>the</strong> use of natural <strong>gas</strong>.Plants in operation at:• Fondoce (Italy): pilot plant 32,000 <strong>to</strong>n/year. S<strong>to</strong>pped in 1998.• Karlsruhe (Germany), commercial plant with 225,000 <strong>to</strong>n/year.Plants in construction or planning at:• Ansbach (Germany)• Berlin (Germany)• Hanau (Germany)• Tessin (Switzerland)page: 139
• Kärnten (Austria)pyrolysis:Process name:Capacity:FeedProductWasteTHERMOGENICSThermogenics0.3 - 6 MWthany solid organic materiallow calorific syn<strong>gas</strong>no <strong>gas</strong>eous wasteThe Thermogenics <strong>gas</strong>ifier is able <strong>to</strong> produce a low calorific syn<strong>gas</strong> <strong>to</strong> run standard internal combustionengines driving electric genera<strong>to</strong>rs or as fuel for steam or hot water boilers. Because of this capability andbecause <strong>the</strong> <strong>gas</strong>ifier can operate between 0.3 - 6 MWth, <strong>the</strong> conversion of a wide range of solid wastes <strong>to</strong>energy becomes practical and economically viable. The process is environmentally sound since <strong>the</strong>re areno waste <strong>gas</strong>es vented <strong>to</strong> <strong>the</strong> atmosphere. The ability <strong>to</strong> operate over a wide capacity range and with manydifferent feeds<strong>to</strong>cks makes <strong>the</strong> production of energy possible for rural areas in underdeveloped countriesnot served by a national power <strong>grid</strong>.The Thermogenics <strong>gas</strong>ifier can handle almost any solid or semi-solid organic feeds<strong>to</strong>ck, which by itself or incombination has a heating value of 2,800 kcal per kg or more. Feeds<strong>to</strong>cks that have been tested orconsidered include: sorted municipal and commercial waste, shredded paper, wood waste, dewateredsewage sludge, scrap tires, agricultural waste, paint sludge, oil field wastes and hydrocarbon contaminatedsoils.Depending on <strong>the</strong> nature of <strong>the</strong> feeds<strong>to</strong>ck, ei<strong>the</strong>r low-calorific <strong>gas</strong> for energy production (electricity or steam)can be produced or a range of by-products such as carbon black, diesel fuel and asphalt materials (<strong>from</strong>tires); ammonia (<strong>from</strong> many feeds<strong>to</strong>cks); liquefied <strong>gas</strong>es such as hydrogen, nitrogen, carbon dioxide (<strong>from</strong>many feeds<strong>to</strong>cks) and various o<strong>the</strong>r compounds.A schematic overview of <strong>the</strong> process is shown in figure 23.Three models are commercially available: <strong>the</strong> 103, 104 and 106 systems. Global performance is shown intable 71 for wood waste as <strong>biomass</strong>.Higher performance can be reached with feeds<strong>to</strong>cks like shredded plastics and shredded tires.page: 140
SystemCapacity Energy output Energy outputkg/h kWe kWth103 455 592 1650104 910 1184 3300106 2730 3552 9900Table 71: Performance Thermogenics processFigure 23: Overview of <strong>the</strong> Thermogenics <strong>gas</strong>ification processhydrogenation:ECNProcess name: hydrogenationManufacturer: ECNOrigin:derived <strong>from</strong> <strong>the</strong> ‘Hydrocarb’ processDescription:• pressure 30 bar• temperature 800 °C• reactant hydrogenStatus:labora<strong>to</strong>ry and bench-scale testsEfficiency: 81%The hydrogenation of coal is already demonstrated on a large scale (240 <strong>to</strong>ns a day) in <strong>the</strong> ‘Hydrocarb’process. ECN in <strong>the</strong> Ne<strong>the</strong>rlands is starting a project <strong>to</strong> demonstrate <strong>the</strong> hydrogenation of <strong>biomass</strong>. In thisprocess <strong>the</strong> hydrogenation is followed by a methanation step. Table 72 shows <strong>the</strong> <strong>gas</strong> composition aftercleaning and methanation.page: 141
Quality Value UnitComponents• Carbon monoxide0 %• Hydrogen81 %• Methane9 %• O<strong>the</strong>r hydrocarbons0 %• Carbon dioxide9 %• Nitrogen and argon1 %Combustion propertiesCalorific valueWobbe index3944MJ/m 3MJ/m 3Table 72: Product <strong>gas</strong> ECN-hydrogenation after cleaning and methanationpage: 142
SE-205 09 MALMÖ TEL 040-24 43 10 FAX 040-24 43 14Hemsida www.sgc.se epost info@sgc.se