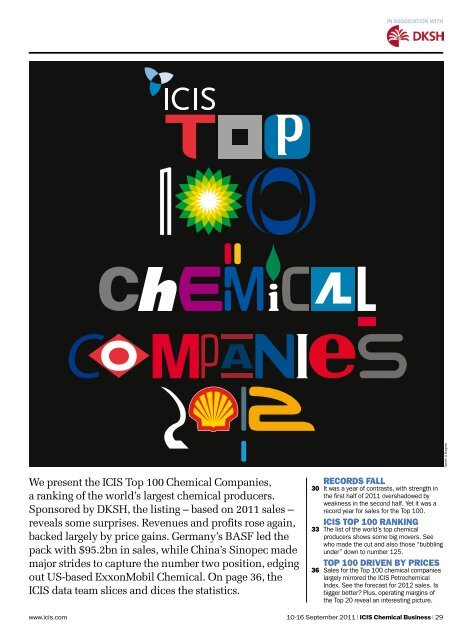
ICIS Top 100 Chemicals Companies 2012
ICIS Top 100 Chemicals Companies 2012
ICIS Top 100 Chemicals Companies 2012
- No tags were found...

Create successful ePaper yourself
Turn your PDF publications into a flip-book with our unique Google optimized e-Paper software.
ANALYSIS❯❯ 30 group in 2011. France’s Rhodia is nolonger included in the rankings, havingmerged with Solvay in 2011.PETROCHEMICALS GAINVolume demand growth earlier in the yearand pricing power helped the large petrochemicalproducers make gains in 2011, despitethe fourth-quarter slump. In 2011, theWest Texas Intermediate (WTI) oil price fluctuatedbetween $75/bbl and $112/bbl, withthe high point early in the second quarter andthe low point at the start of the fourth quarter,and lower prices in the second half of thethird quarter. The <strong>ICIS</strong> Petrochemical Index(IPEX), which reflects prices of a group of 12important petrochemical and polymer productsin three regions, moved from 300.45 inJanuary to a peak of 374.94 in June and thendown to 300.78 by December.Producers in Europe tied to naphtha andother oil-related feedstocks faced a challengein passing their feedstock price increases onto customers in polymers and intermediatesdownstream from the cracker. <strong>Companies</strong>cracking ethane in the Middle East continuedto achieve high returns. Those cracking ethanein the US benefited greatly from low and competitiveethane prices brought about by theNorth American shale gas revolution.US fertilizer producers also benefited greatlyfrom low natural gas prices in North America,but were also boosted by demand growth.Intermediates and specialty chemical makerswere squeezed by higher upstream chemicalcosts but, once again, demand in the firstmonths of the year helped them to retain andincrease prices.Industrial gases producers, which are alsoincluded in the <strong>ICIS</strong> <strong>Top</strong> <strong>100</strong> analysis, madethe most of the industrial demand for gases inthe emerging economies, particularly China.China’s Sinopec grew strongly during the year, to reach second place in the listingsPROFITS RISEVolume demand growth, lower costs andhigher prices translated into increased profitsfor most chemicals players in 2011. Earningsbefore interest and tax (EBIT) surged for CFIndustries, Agrium and Occidental Chemicalof the US, and for Norway’s Yara Internationaland South Korea’s SK Energy, as well as Sinopec.Profits data are not available for all thecompanies listed in the <strong>ICIS</strong> <strong>Top</strong> <strong>100</strong>, but thetable shows both EBIT and the net profit results.We also list the important assets, spendingand employee data on which the <strong>ICIS</strong>Company of the Year award is based. The winnerwill be announced in our 24 Septemberissue. <strong>ICIS</strong> collects a considerable amount offinancial data on the major chemical companies,not all of it shown in the table publishedin <strong>ICIS</strong> Chemical Business. The additionaldata are available on request.The strongest operating profit margins (operatingprofits to sales ratio) in 2011 wereshown by the fertilizer producers – PotashCorp of Saskatchewan, CF Industries andEuroChem. Russia’s SIBUR and SABIC alsoproduced strong operating margins, as did industrialgases companies including Germany’sLinde, and Praxair of the US.The <strong>ICIS</strong> <strong>Top</strong> <strong>100</strong> data also show that companieswere using their cash to add new productioncapabilities in 2011. Capital spendingacross the <strong>Top</strong> <strong>100</strong> companies listed in 2011increased by an average of 28%. ■To access the <strong>2012</strong> <strong>ICIS</strong> <strong>Top</strong> <strong>100</strong> chemicalcompanies listing package online, visiticis.com/top<strong>100</strong>chemRex FeaturesFootnotesaChemical segment figures. Includesinter-segment revenues, e.g. revenuefor sales of by-products to other divisions.For ExxonMobil, inter-segmentrevenue was $22.8bn in 2011 and$18.1bn in 2010. For Sinopec = externalsales with inter-segment sales.Ube figures = <strong>Chemicals</strong> & Plastics +Specialty <strong>Chemicals</strong> & Products.b2010 finances are based on the sumof predecessor and successor componentsafter emergence from bankruptcy,30 April, 2010.cFinancial year-end 31 March, <strong>2012</strong>.dNet sales includes inter-segmentsales; data excludes HealthCare division(2011 sales €17.2bn; 2010sales €16.9bn).eExcludes real estate and energy businessareas.fLinde Gas & Engineering sales, operatingprofit and employee figures only.gPro-forma results include the acquisitionof Rhodia from January 2011.hPTT Global Chemical Public CompanyLimited was formed by the amalgamationof PTT Chemical PublicCompany Limited and PTT Aromaticsand Refining Public Company Limitedand was registered as a new entityon 19 October, 2011.iPetrochemical figures. For SK Energy,the sales revenue figure includesinter-segment sales.jOptical segment and glass segmentfigures have not been included.kAsahi Kasei excludes homes andhealthcare segments.lFinancial year-end 30 June, 2011– business segments’ total turnoverfigures: polymers, solvents, olefins,surfactants, waxes and nitro used.mFinancial year-end 31 May, <strong>2012</strong>.n<strong>ICIS</strong> estimates. BP Petrochemicalsfigures only. Revenue representsthird-party sales as well as other operatingrevenues and excludes thesales made by joint ventures, whichare equity accounted. BP’s underlyingreplacement cost profit, excludingjoint venture interests in Europe.oNet sales figure. The total of NPC andits associated companies in 2011 is$25bn.pAdhesive Technologies segment only.qNet profit is pre-tax.rSud-Chemie sales consolidated forthe eight-month period following acquisitionin April 2011.sAll figures for SIBUR are based oncombined financial information,which excludes results of the mineralfertilizers and tires businesses divestedby SIBUR in December 2011.t2011 and 2010 figures (re-stated)exclude the vinyl products businesssegment, announced as having beensold to the Klesch Group.uNalco was fully acquired by Ecolab inDecember 2011.v2010 income statement and cashflowstatement adjusted to reflectdisposal of the COMPO business.2011 figures refer to continued operations,excluding COMPO, whichwas sold to Triton with effect from 18October, 2011.wIncludes the assets and results of theoperations acquired from EastmanChemical, from 1 February, 2011.32 | <strong>ICIS</strong> Chemical Business | 10-16 September <strong>2012</strong>www.icis.com
IN ASSOCIATION WITHRank201184Compania Espanolade Petroleos (CEPSA) i 4,489 21.7 19.085 Kuraray c 4,452 1.6 1.5 660 641 380 347 6,314 3.1 444 96.886Denki Kagaku Kogyo(Denka) c 4,401 1.9 1.8 250 297 137 173 4,858 0.087 JSR c 4,223 2.7 2.7 434 472 319 333 5,197 10.2 200 24.488 SIBUR s 4,195 27.2 21.1 654 58589 Givaudan 4,171 -7.6 5.4 472 519 268 318 7,156 10.7 313 -0.2 199 77.8 8,913 3.490Daicel ChemicalIndustries c 4,126 -3.3 -3.4 246 395 143 203 4,805 -3.2 202 47.191 EuroChem 4,103 34.3 27.8 1,371 854 <strong>100</strong>1 656 6,401 30.5 744 11.0 20,801 6.192 Valspar hh 3,953 22.5 22.5 -40 376 -139 222 3,500 -9.5 115 15.2 67 -1.8 10,020 -1.693 Nippon Shokubai c 3,870 11.2 11.1 375 360 257 255 4,301 8.1 134 6.2 252 36.494 RPM m 3,777 11.7 11.7 396 345 216 189 3,560 1.3 45 10.0 72 80.9 9,700 7.895 Rockwood Holdings 3,669 15.0 15.0 567 358 411 239 4,588 -2.9 59 19.9 280 55.1 9,700 1.096 Westlake Chemical 3,620 14.1 14.1 447 378 259 221 3,267 10.6 177 117.5 1,811 -3.397 Ube a/c 3,563 8.1 8.0 341 34798 Mexichem 3,392 34.4 19.0 364 285 4,335 5.5 215 21.0 11,17399 FMC 3,378 8.4 8.4 587 387 366 173 3,744 12.8 105 4.7 190 33.2 5,000 2.0<strong>100</strong> Asahi Glass a 3,224 -4.4 2.6 234 215 3,327 6.6 253 37.8Bubbling underRank2010Company Sales Operating profit Net profit Total assets R&D Capital spending Employees$m % Change Reporting $m $m $m $m%%%%currency in $ 2011 2010 2011 2010 $m Change $m Change $m Change Numbers ChangeCompany Sales Operating profit Net profit Total assets R&D Capital spending Employees$m % ChangeReportingcurrency in $$m2011$m2010$m2011$m2010 $m%Change $m%Change $m%Change Numbers%Change101 Georgia Gulf 3,223 14.4 14.4 125 114 58 43 1,644 -1.3 66 45.3 3,744 3.5102 W.R. Grace 3,212 20.1 20.1 269 207 4,497 5.3 69 13.6 142 25.4 6,300 5.0103 Zeon c 3,172 -2.8 -2.9 388 426 231 221 3,764 7.3104 Pemex i 3,114 5.1 -7.0 -883 -1,215 -912 -1195 7,857 -11.1 174 -12.8 13,541 0.0105 Cabot z 3,102 14.2 14.2 236 154 3,141 8.8 66 1.5 230 113.0 4,<strong>100</strong> 5.1106 Cytec Industries 3,073 11.8 11.8 273 234 208 172 3,537 -3.7 85 16.7 117 0.8 5,500 -8.3107 Chemtura 3,025 9.6 9.6 227 38 119 -586 2,855 -2.0 43 2.4 154 24.2 4,500 7.1108 Industries Qatar cc 2,966 42.1 42.1109 Albemarle 2,869 21.4 21.4 587 415 464 324 3,204 4.4 77 32.8 191 152.5 4,260 6.0110 Lonza ff 2,868 0.4 0.0 278 400 164 312 7,480 46.2 <strong>100</strong> -5.5 264 -13.4 11,001 32.9111 PolyOne 2,864 9.2 9.2 233 174 173 163 2,081 24.5 37 9.2 54 37.0 4,700 17.5112 Kemira 2,860 2.1 -0.1 205 207 182 154 3,468 2.9 51 -6.7 127 27.8 5,006 0.6113 IFF 2,788 6.3 6.3 428 416 267 264 2,966 3.2 220 0.5 128 19.9 5,644 2.4114 Tessenderlo Group dd 2,755 5.0 2.7 136 97 -124 27 1,788 -20.5 15 5.8 138 -11.1 7,457 -9.7115 Makhteshim-AganIndustries2,691 13.9 13.9 243 6 121 -132 3,766 1.3 26 12.9 93 -5.7 4,072 3.4116 Tata Chemical c 2,675 22.6 8.4 453 414 165 145117Momentive PerformanceMaterials y 2,637 1.9 1.9 142 262 -141 -64 3,165 -3.9 78 6.8 111 16.8 4,750 0.7118 Methanex 2,608 32.6 32.6 344 157 228 94 3,396 8.1 128 4.9119IRPC Public CompanyLimited i2,372 -3.3 -8.0 7 128120Petkim PetrokimyaHolding2,330 20.2 20.2 98 85 61 87 1,414 -8.0 2 7.1 87 71.7 2,586 5.3121 Fuchs Petrolub 2,162 14.4 11.8 338 320 237 227 1,282 8.2 36 7.1 49 13.1 3,722 3.9122 Ferro 2,156 2.6 2.6 66 24 32 6 1,441 0.4 30 11.4 73 62.6 5,120 1.7123 SQM 2,145 17.2 17.2 811 554 554 387 1,956 15.4 501 49.1124 Solutia 2,097 7.5 7.5 404 331 262 78 3,526 -0.3 24 33.3 105 59.1 3,400 3.0125 Altana 2,095 5.3 3.0 281 305 191 201 2,594 0.7 114 4.6 121 23.9 5,313 7.6www.icis.com 10-16 September <strong>2012</strong> | <strong>ICIS</strong> Chemical Business | 35
ANALYSIS<strong>ICIS</strong> <strong>Top</strong> <strong>100</strong> gainsdriven by pricesHigher prices translate to sales gain and improved profitability for the <strong>ICIS</strong><strong>Top</strong> <strong>100</strong> chemical companies. We also highlight capital spending patternsregan hartnell londonDespite many headwinds, the globalchemical industry has surged to anew record level of chemical sales.The <strong>ICIS</strong> <strong>Top</strong> <strong>100</strong> chemical companylisting shows that the top <strong>100</strong> had combinedsales of $1.40 trillion (€1.08 trillion) in the2011 financial year, representing growth of13.4% compared with 2010. <strong>Top</strong> <strong>100</strong> sales in2010 were almost 24% greater than in 2009,when chemical sales suffered greatly amid the2008–2009 financial crisis.Year-on-year sales growth in 2011, albeitdown from the surge in 2010, is still close to 1.5times the 9.0% average level of annual growthseen since 2000. The <strong>ICIS</strong> <strong>Top</strong> <strong>100</strong>’s $1.4 trillionof chemical sales represents 35.2% of the$3.98 trillion worth of global chemical production(excluding pharmaceuticals), according tothe American Chemistry Council.SALES MIRROR IPEXThe rise in 2011 sales was mostly in linewith the level of growth suggested by thedollar-denominated <strong>ICIS</strong> PetrochemicalIndex (IPEX), which suggests that salesgrowth was primarily attributed to higherchemical prices rather than to any significantadditional volume growth.The IPEX is a monthly calculated, capacityweightedindex that tracks the price levels of abasket of 12 commodity-type chemicals andpolymers in each of three regions – Asia,Europe and the US.By using a similar methodology and the averageIPEX reading for the first seven monthsof <strong>2012</strong>, this forecasts a level of sales in <strong>2012</strong>of around $1.36 trillion, or a decrease inchemical sales of just under 3%.The continued worries about the financialstability and fate of the eurozone, the health ofTOP GAINS<strong>Top</strong> <strong>100</strong> rankings gained this year over lastEcolab 22Indorama Ventures 22Solvay 20CF Industries 15Sasol 10Big Bottom Line<strong>Top</strong> five net profits in the <strong>Top</strong> <strong>100</strong>, $bnPotash Corp 8.0CF Industries 7.8EuroChem 4.4SIBUR 3.5ICL 3.0<strong>Top</strong> Innovators<strong>Top</strong> five R&D expenditures as a % of salesMerck KGaA 14.8%Syngenta 8.5%Givaudan 7.5%DuPont 5.2%Bayer 5.1%<strong>ICIS</strong> TOP <strong>100</strong> SALES TRACK IPEX ON PRICE INFLATIONSales, $bn IPEX PercentageXxxxx xxxxxx1,60040025Xxxxx xxxxxxXxxxx xxxxxx<strong>Top</strong> <strong>100</strong> chemical sales20Xxxxx xxxxxxIPEX index (1993=<strong>100</strong>)15Xxxxx xxxxxx1,200300Xxxxx xxxxxx10TOP <strong>100</strong> SALES GROWTHXxxxxXxxxxXxxxxXxxxxXxxxxXxxxx8004000200020012002200320042005200620072008200920102011FORECAST<strong>2012</strong>200<strong>100</strong>050-5-10-15-202001Year on year sales growthAverage growth201136 | <strong>ICIS</strong> Chemical Business | 10-16 September <strong>2012</strong>www.icis.com
IN ASSOCIATION WITHAverage operating profitmargin for the top 20companies in the listing was9.7%, higher than the average8.0% margin since 2001the US economy and continued growth inemerging markets have capped volumegrowth and demand-pull price rises in thefirst two quarters of <strong>2012</strong>. Price increases reflectedin the IPEX have generally resultedfrom higher feedstock costs flowing throughto increased product prices.OPERATING profit MARGINS RISEThe average operating profit margin (operatingprofits to sales ratio) for the top 20 companiesin the listing was 9.7%, higher than theaverage 8.0% margin since 2001. It was thesecond consecutive operating profit marginincrease since the 2009 slump.For the second year running, fertilizer producershave returned the best operating marginsand have dominated half of the top 10places in the winners and losers chart. Althoughwell down from their pre-crisis peak,fertilizer prices have remained resilient due tostrong demand from emerging nations.After its reorganisation and release of companyfinancials, Russian chemical producerSibur has ousted Middle East producersfrom the top margin spot for petrochemicalproducers, although Saudi Arabia’s SABIC50does feature in the top 10.Understandably, a handful of 40 Japanesecompanies are among the worst performers atthe operating level, as they were greatly 30 affectedby the disastrous tsunami of early 201120and are still facing difficult operating conditionsof reduced electricity supply after the10shutdown of nuclear generating capacity.AVERAGE OPERATING MARGINS OFTOP 20 PRODUCERS-10Percentage12<strong>Top</strong> 20 operating marginsAverage margin1080PotashCorp.CFThe only producers to declare negative operatingprofit margins are the Italian producerVersalis (formerly Polimeri Europa), whichsuffers from some legacy operating issues, andUS-based Valspar as it struggled with a multiyeardownturn of the US construction sector.FERTilizerS SPEND BIGFor the second year running, the biggestspenders were dominated by fertilizer producersand industrial gas companies, as representedby an analysis of the ratio of capitalexpenditures to revenue levels. Fertilizer producersare undergoing a multi-year capital investmentcycle to bring new fertilizer capacityon stream.Industrial gas companies are seeing strongWINNERS AND LOSERSPercentage50403020<strong>100</strong>-10IndustriesCorpPotashEuroChemCFIndustriesSIBUREuroChemICLSIBURSABICICLMosaicLindeGroupSABICMosaicPraxairLindeGroupdemand for their products from Asia andhigher levels of capital expenditures are anintegral part of their business model to supplytheir customers with their gaseous needs.Sibur is the only petrochemical producerto feature on the big spender chart, as it hasambitious investment plans to supply astrongly growing Russian market. On an absolutelevel, the larger petrochemical companiesshow their presence. Germany-based BASFtakes top spot with close to $4.5bn worth ofinvestment in 2011, followed by SABIC, USbasedDow Chemical and China’s Sinopec,each with $2bn–3bn of expenditure. ■Nova<strong>Chemicals</strong>PraxairMitsui<strong>Chemicals</strong>Visit the landing page for this year’s <strong>Top</strong> <strong>100</strong>chemical companies listing and analysis onthe <strong>ICIS</strong> website at icis.com/top<strong>100</strong>chemShowaDenkoNOVA<strong>Chemicals</strong>FERTILIZER COMPANIES INVEST TO FEED A HUNGRY WORLDPercentage252015<strong>Top</strong> 10 and bottom 5 operating marginsPKNOrlenMitsui<strong>Chemicals</strong>ShowaDenkoValsparPKNOrlenVersalisValsparVersalisCapital expenditure as % of salesXxxxxXxxxxXxxxxXxxxxXxxxx625104205202001151020110PotashCorpSIBUREuroChemPraxairWacker-ChemieAlbemarleAirLiquideOricaSolvayKurarayLindeGroupLGChemAsahiGlassLANXESSShin-EtsuRockwoodAirgasArkemaICLAsahiKasei5www.icis.com 10-16 September <strong>2012</strong> | <strong>ICIS</strong> Chemical Business | 370CorpSIBUREuroChemPotashWackerhemieemarleAirPraxairLiquideOricaSolvayurarayLindeGroupLGChemAsahiGlassanxessin-EtsukwoodAirgasrkemaICLAsahiKasei