An Introduction to Statistical Extreme Value Theory - IMAGe
An Introduction to Statistical Extreme Value Theory - IMAGe
An Introduction to Statistical Extreme Value Theory - IMAGe
SHOW LESS
- No tags were found...

Create successful ePaper yourself
Turn your PDF publications into a flip-book with our unique Google optimized e-Paper software.
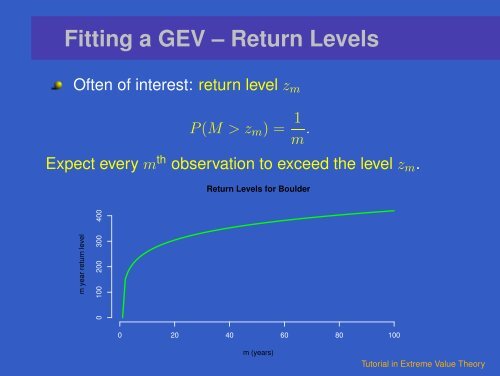
Fitting a GEV – Return LevelsOften of interest: return level z mP (M > z m ) = 1 m .Expect every m th observation <strong>to</strong> exceed the level z m .Return Levels for Boulderm year return level0 100 200 300 4000 20 40 60 80 100m (years)Tu<strong>to</strong>rial in <strong>Extreme</strong> <strong>Value</strong> <strong>Theory</strong>