An Introduction to Statistical Extreme Value Theory - IMAGe
An Introduction to Statistical Extreme Value Theory - IMAGe
An Introduction to Statistical Extreme Value Theory - IMAGe
SHOW LESS
- No tags were found...

Create successful ePaper yourself
Turn your PDF publications into a flip-book with our unique Google optimized e-Paper software.
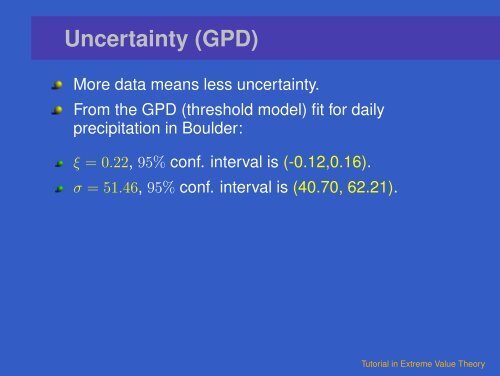
Uncertainty (GPD)More data means less uncertainty.From the GPD (threshold model) fit for dailyprecipitation in Boulder:ξ = 0.22, 95% conf. interval is (-0.12,0.16).σ = 51.46, 95% conf. interval is (40.70, 62.21).Tu<strong>to</strong>rial in <strong>Extreme</strong> <strong>Value</strong> <strong>Theory</strong>