agriculture and food economy in poland
agriculture and food economy in poland
agriculture and food economy in poland

Create successful ePaper yourself
Turn your PDF publications into a flip-book with our unique Google optimized e-Paper software.
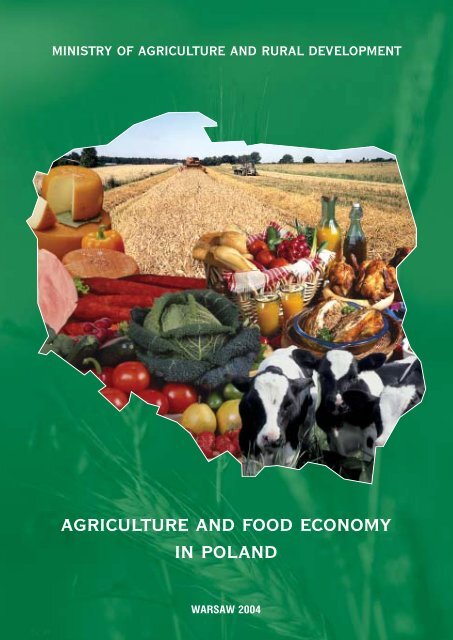
MINISTRY OF AGRICULTURE AND RURAL DEVELOPMENT<br />
AGRICULTURE AND FOOD ECONOMY<br />
IN POLAND<br />
WARSAW 2004
PUBLISHER<br />
MINISTRY OF AGRICULTURE AND RURAL DEVELOPMENT<br />
Office for Geographical Indications <strong>and</strong> Promition<br />
WORK OF MANY AUTHORS<br />
COMPOSITION AND PAGINATING, PRINTED BY<br />
Zak∏ady Graficzne TAURUS<br />
TRANSLATOR<br />
Beata Moska∏a
MINISTRY OF AGRICULTURE AND RURAL<br />
DEVELOPMENT<br />
AGRICULTURE AND FOOD ECONOMY<br />
IN POLAND<br />
WARSAW 2004
Table of contents:<br />
Introduction by the M<strong>in</strong>ister of Agriculture <strong>and</strong> Rural Development<br />
GENERAL INFORMATION ABOUT POLAND . . . . . . . . . . . . . . . . . . . . . . . . . . . . . . . . . . . . . 1<br />
AGRICULTURE . . . . . . . . . . . . . . . . . . . . . . . . . . . . . . . . . . . . . . . . . . . . . . . . . . . . . . . . . . . . . . . . . . 5<br />
General <strong>in</strong>formation on Polish Agriculture . . . . . . . . . . . . . . . . . . . . . . . . . . . . . . . . . . . . . . . . . . . . . . . . 5<br />
Value of Agricultural Production <strong>and</strong> Price Relationship . . . . . . . . . . . . . . . . . . . . . . . . . . . . . . . . . . . . . . 6<br />
Agricultural L<strong>and</strong> <strong>and</strong> Structure of its Utiliusation . . . . . . . . . . . . . . . . . . . . . . . . . . . . . . . . . . . . . . . . . 9<br />
Plant Production . . . . . . . . . . . . . . . . . . . . . . . . . . . . . . . . . . . . . . . . . . . . . . . . . . . . . . . . . . . . . . . . . . . . . 12<br />
Animal Production . . . . . . . . . . . . . . . . . . . . . . . . . . . . . . . . . . . . . . . . . . . . . . . . . . . . . . . . . . . . . . . . . . . . 19<br />
Organic Farm<strong>in</strong>g . . . . . . . . . . . . . . . . . . . . . . . . . . . . . . . . . . . . . . . . . . . . . . . . . . . . . . . . . . . . . . . . . . . . . 23<br />
Population <strong>and</strong> Human Resources <strong>in</strong> Agriculture . . . . . . . . . . . . . . . . . . . . . . . . . . . . . . . . . . . . . . . . . . . 25<br />
Economic situation of Agricultural Population . . . . . . . . . . . . . . . . . . . . . . . . . . . . . . . . . . . . . . . . . . . . . 26<br />
Off-Farm<strong>in</strong>g Activities <strong>in</strong> Agricultural Hold<strong>in</strong>gs . . . . . . . . . . . . . . . . . . . . . . . . . . . . . . . . . . . . . . . . . . . 28<br />
Organisation of the Agricultural Market . . . . . . . . . . . . . . . . . . . . . . . . . . . . . . . . . . . . . . . . . . . . . . . . . . 31<br />
FOOD INDUSTRY . . . . . . . . . . . . . . . . . . . . . . . . . . . . . . . . . . . . . . . . . . . . . . . . . . . . . . . . . . . . . . . . 33<br />
General Information about the Food Industry . . . . . . . . . . . . . . . . . . . . . . . . . . . . . . . . . . . . . . . . . . . . . . 33<br />
Economic Situation of the Food Industry . . . . . . . . . . . . . . . . . . . . . . . . . . . . . . . . . . . . . . . . . . . . . . . . . 35<br />
Food Industry Output . . . . . . . . . . . . . . . . . . . . . . . . . . . . . . . . . . . . . . . . . . . . . . . . . . . . . . . . . . . . . . . . . 36<br />
Consumption of Foodstuffs . . . . . . . . . . . . . . . . . . . . . . . . . . . . . . . . . . . . . . . . . . . . . . . . . . . . . . . . . . . . 37<br />
Programme PD˚, Try F<strong>in</strong>e Food . . . . . . . . . . . . . . . . . . . . . . . . . . . . . . . . . . . . . . . . . . . . . . . . . . . . . . . . 39<br />
Protection of Regional <strong>and</strong> Traditional Food . . . . . . . . . . . . . . . . . . . . . . . . . . . . . . . . . . . . . . . . . . . . . . . 40<br />
FISHERIES . . . . . . . . . . . . . . . . . . . . . . . . . . . . . . . . . . . . . . . . . . . . . . . . . . . . . . . . . . . . . . . . . . . . . . . 43<br />
General Information on Fisheries . . . . . . . . . . . . . . . . . . . . . . . . . . . . . . . . . . . . . . . . . . . . . . . . . . . . . . . 43<br />
Sea Fish<strong>in</strong>g . . . . . . . . . . . . . . . . . . . . . . . . . . . . . . . . . . . . . . . . . . . . . . . . . . . . . . . . . . . . . . . . . . . . . . . . . 44<br />
Inl<strong>and</strong> Fisheries . . . . . . . . . . . . . . . . . . . . . . . . . . . . . . . . . . . . . . . . . . . . . . . . . . . . . . . . . . . . . . . . . . . . . 45<br />
Fish Process<strong>in</strong>g . . . . . . . . . . . . . . . . . . . . . . . . . . . . . . . . . . . . . . . . . . . . . . . . . . . . . . . . . . . . . . . . . . . . . . 46<br />
Fishery Policy <strong>and</strong> Fish Market Regulations . . . . . . . . . . . . . . . . . . . . . . . . . . . . . . . . . . . . . . . . . . . . . . . 47<br />
FOREIGN TRADE IN AGRI-FOOD PRODUCTS . . . . . . . . . . . . . . . . . . . . . . . . . . . . . . . . . . . 49<br />
General Information on Trade <strong>in</strong> Agri-Food Products . . . . . . . . . . . . . . . . . . . . . . . . . . . . . . . . . . . . . . . 49<br />
Geographical Pattern of Trade <strong>in</strong> Agri-Food Products . . . . . . . . . . . . . . . . . . . . . . . . . . . . . . . . . . . . . . . 50<br />
Commodity Pattern of Agri-Food Trade . . . . . . . . . . . . . . . . . . . . . . . . . . . . . . . . . . . . . . . . . . . . . . . . . . 52<br />
Export . . . . . . . . . . . . . . . . . . . . . . . . . . . . . . . . . . . . . . . . . . . . . . . . . . . . . . . . . . . . . . . . . . . . . . . . . . . . . 53<br />
Import . . . . . . . . . . . . . . . . . . . . . . . . . . . . . . . . . . . . . . . . . . . . . . . . . . . . . . . . . . . . . . . . . . . . . . . . . . . . . 55<br />
AGRICULTURAL POLICY . . . . . . . . . . . . . . . . . . . . . . . . . . . . . . . . . . . . . . . . . . . . . . . . . . . . . . . . 57<br />
National Support Instruments . . . . . . . . . . . . . . . . . . . . . . . . . . . . . . . . . . . . . . . . . . . . . . . . . . . . . . . . . . . 57<br />
F<strong>in</strong>anc<strong>in</strong>g of Agriculture From the National Budget . . . . . . . . . . . . . . . . . . . . . . . . . . . . . . . . . . . . . . . . . 58<br />
Rural Development Programme (RDP) . . . . . . . . . . . . . . . . . . . . . . . . . . . . . . . . . . . . . . . . . . . . . . . . . . . 58<br />
Agricultural Advisory Services . . . . . . . . . . . . . . . . . . . . . . . . . . . . . . . . . . . . . . . . . . . . . . . . . . . . . . . . . . 59<br />
Research <strong>and</strong> Development Units . . . . . . . . . . . . . . . . . . . . . . . . . . . . . . . . . . . . . . . . . . . . . . . . . . . . . . . 60<br />
European Union Assistance . . . . . . . . . . . . . . . . . . . . . . . . . . . . . . . . . . . . . . . . . . . . . . . . . . . . . . . . . . . . 61<br />
Pre-Accession Programmes . . . . . . . . . . . . . . . . . . . . . . . . . . . . . . . . . . . . . . . . . . . . . . . . . . . . . . . . . . . . 61<br />
Phare Projects . . . . . . . . . . . . . . . . . . . . . . . . . . . . . . . . . . . . . . . . . . . . . . . . . . . . . . . . . . . . . . . . . . . . . . 61<br />
SAPARD Programme . . . . . . . . . . . . . . . . . . . . . . . . . . . . . . . . . . . . . . . . . . . . . . . . . . . . . . . . . . . . . . . . 62<br />
Assistance Funds Follow<strong>in</strong>g Accession to the EU . . . . . . . . . . . . . . . . . . . . . . . . . . . . . . . . . . . . . . . . . . . 63<br />
Direct payments . . . . . . . . . . . . . . . . . . . . . . . . . . . . . . . . . . . . . . . . . . . . . . . . . . . . . . . . . . . . . . . . . . . . . 64<br />
Rural Areas Development Plan (RADP) . . . . . . . . . . . . . . . . . . . . . . . . . . . . . . . . . . . . . . . . . . . . . . . . . . 65<br />
Sectoral Operational Programme: Restructur<strong>in</strong>g <strong>and</strong> Modernisation of the Food Sector <strong>and</strong><br />
Rural Development (SOP) . . . . . . . . . . . . . . . . . . . . . . . . . . . . . . . . . . . . . . . . . . . . . . . . . . . . . . . . . . . . . 66<br />
AGRICULTURAL CENTRAL AND LOCAL SELF-GOVERNMENT INSTITUTIONS 68<br />
Agricultural Market Agency (AMA) . . . . . . . . . . . . . . . . . . . . . . . . . . . . . . . . . . . . . . . . . . . . . . . . . . . . . . 68<br />
Agency For Restructur<strong>in</strong>g <strong>and</strong> Modernisation of Agriculture (ARMA) . . . . . . . . . . . . . . . . . . . . . . . . . . 69<br />
Agricultural Property Agency (APA) . . . . . . . . . . . . . . . . . . . . . . . . . . . . . . . . . . . . . . . . . . . . . . . . . . . . . . 69<br />
Agricultural Chambers . . . . . . . . . . . . . . . . . . . . . . . . . . . . . . . . . . . . . . . . . . . . . . . . . . . . . . . . . . . . . . . . 71<br />
Agricultural Circles . . . . . . . . . . . . . . . . . . . . . . . . . . . . . . . . . . . . . . . . . . . . . . . . . . . . . . . . . . . . . . . . . . . 71<br />
ADDRESSES OF AGRICULTURAL INSTITUTIONS . . . . . . . . . . . . . . . . . . . . . . . . . . . . . . 73
Ladies <strong>and</strong> Gentlemen,<br />
Traditionally, as every year before the<br />
International POLAGRA-FARM <strong>and</strong> POLAGRA-<br />
FOOD Fairs, which are jubilee events organised<br />
for 20th time this year, I am present<strong>in</strong>g to you the publication “Agriculture <strong>and</strong><br />
Food Economy <strong>in</strong> Pol<strong>and</strong>” giv<strong>in</strong>g a realistic picture of Polish <strong>agriculture</strong>, <strong>food</strong><br />
process<strong>in</strong>g <strong>in</strong>dustry <strong>and</strong> agricultural <strong>in</strong>stitutions.<br />
The publication supplements the practical presentation of the achievements<br />
of Polish farmers <strong>and</strong> process<strong>in</strong>g plants at the POLAGRA Fair.<br />
This year’s publication is of particular importance. It is issued several<br />
months after Pol<strong>and</strong>’s accession to the European Union. As from 1 May 2004<br />
Pol<strong>and</strong> has been a member of a new, enlarged European Union composed of<br />
25 states <strong>in</strong>habited by 455 million people.<br />
The first few months follow<strong>in</strong>g accession <strong>and</strong> experience ga<strong>in</strong>ed <strong>in</strong> this<br />
period <strong>in</strong> the European Community enable us to state that pessimistic<br />
forecasts of European <strong>in</strong>tegration opponents have not come true. They<br />
envisaged the flood<strong>in</strong>g of the Polish market with cheap, subsidised <strong>food</strong><br />
products from the EU, the hold<strong>in</strong>g up of Polish exports due to lack of<br />
adjustments <strong>in</strong> the Polish <strong>food</strong> process<strong>in</strong>g sector <strong>and</strong> the absence of tangible<br />
benefits deriv<strong>in</strong>g from the support of Polish <strong>agriculture</strong> from the EU funds.<br />
As we already know, exquisite taste <strong>and</strong> quality of our products, as<br />
confirmed by the certificates of compliance with sanitary, veter<strong>in</strong>ary <strong>and</strong><br />
quality requirements obta<strong>in</strong>ed by 1700 <strong>food</strong> process<strong>in</strong>g establishments, have<br />
been greatly appreciated by consumers <strong>in</strong> the enlarged EU. Our <strong>food</strong> is<br />
becom<strong>in</strong>g better known, appreciated <strong>and</strong> sought for. The abolition of tariff<br />
barriers is conducive to Polish agri-<strong>food</strong> exports, which has impact on<br />
improvement of foreign trade balance of these products.<br />
Despite little support for Polish <strong>agriculture</strong>, accord<strong>in</strong>g to OECD equal to 9%<br />
of the f<strong>in</strong>al production <strong>in</strong> 2003 compared to an average of 37% for the<br />
European Union 15 member states, Polish products, beside health <strong>and</strong> quality<br />
values associated with the clean environment <strong>and</strong> a low usage of agrochemicals,<br />
are characterised by lower prices. For many years now this has
een achieved at the expense of agricultural producers’ <strong>in</strong>come <strong>and</strong><br />
profitability of <strong>food</strong> process<strong>in</strong>g plants.<br />
Accession to the EU has created an opportunity for improv<strong>in</strong>g such<br />
situation. It is to our joy <strong>and</strong> satisfaction that 85% of eligible farmers have<br />
submitted applications for direct payments for the area cover<strong>in</strong>g 92% of<br />
agricultural l<strong>and</strong>.<br />
Tak<strong>in</strong>g advantage of this opportunity, I would like to thank all those <strong>in</strong>volved<br />
<strong>in</strong> prepar<strong>in</strong>g farmers for obta<strong>in</strong><strong>in</strong>g such payments, <strong>in</strong> particular employees of<br />
the Agency for Restructur<strong>in</strong>g <strong>and</strong> Modernisation of Agriculture, agricultural<br />
advisory services, local self-governments <strong>and</strong> agricultural organisations.<br />
As <strong>in</strong> the case of direct payments, currently the major task is to utilise all<br />
structural funds made available to the Polish farmers, processors, local<br />
self-governments, bus<strong>in</strong>essmen <strong>and</strong> <strong>in</strong>habitants of rural areas. We have a<br />
chance to multiply funds allocated for development, modernisation of farms<br />
<strong>and</strong> enterprises, <strong>in</strong>vestment to enhance effectiveness of production <strong>and</strong><br />
improvement of liv<strong>in</strong>g <strong>and</strong> work<strong>in</strong>g st<strong>and</strong>ards <strong>in</strong> villages.<br />
Numerous programmes addressed to a broad group of potential<br />
beneficiaries create an opportunity for a significant improvement of the<br />
situation <strong>in</strong> <strong>agriculture</strong>, agri-<strong>food</strong> process<strong>in</strong>g <strong>and</strong> rural areas.<br />
I am conv<strong>in</strong>ced that the experience acquired upon the SAPARD Programme<br />
implementation, which after <strong>in</strong>itial delays has speeded up, thereby enabl<strong>in</strong>g a<br />
full use of the funds transferred from the EU to Pol<strong>and</strong>, will ensure fast<br />
up-take of the structural funds.<br />
At each level, <strong>in</strong> each agricultural <strong>in</strong>stitution or organisation we must<br />
ensure necessary assistance for the people apply<strong>in</strong>g for funds <strong>and</strong> we must not<br />
waste the opportunity that has arisen for Polish <strong>agriculture</strong>, <strong>food</strong> process<strong>in</strong>g<br />
<strong>and</strong> rural areas.<br />
Wojciech Olejniczak<br />
M<strong>in</strong>ister of Agriculture <strong>and</strong> Rural Development
INFORMATION ABOUT POLAND<br />
General <strong>in</strong>formation about Pol<strong>and</strong><br />
S<strong>in</strong>ce 1 May 2004 Pol<strong>and</strong> has been one of the 25 members of the European<br />
Union (EU). Among the 10 countries that jo<strong>in</strong>ed the EU this year Pol<strong>and</strong> is the<br />
largest <strong>in</strong> terms of area <strong>and</strong> population.<br />
The total area of Pol<strong>and</strong> is 312 700 km 2 (9th largest state <strong>in</strong> Europe <strong>and</strong> 69th <strong>in</strong> the<br />
world) <strong>and</strong> the population is 38.2 million (8th place <strong>in</strong> Europe <strong>and</strong> 30th <strong>in</strong> the world).<br />
Located <strong>in</strong> Central Europe, Pol<strong>and</strong> borders 7 states: the Russian Federation, the<br />
Republic of Lithuania, the Republic of Belarus <strong>and</strong> Ukra<strong>in</strong>e <strong>in</strong> the east, the<br />
Slovakian Republic <strong>and</strong> the Czech Republic <strong>in</strong> the south <strong>and</strong> Germany <strong>in</strong> the west.<br />
The northern border is the Baltic Sea. The Sudeten <strong>and</strong> the Carpathians are two<br />
mounta<strong>in</strong> ranges situated <strong>in</strong> the south. As from 1 May 2004 the border with Russia,<br />
Belarus <strong>and</strong> Ukra<strong>in</strong>e has become an external EU border.<br />
Pol<strong>and</strong> is a lowl<strong>and</strong> country. Most of its territory has the elevation of up to 300 m<br />
(91.3% of the total area), <strong>and</strong> only a small part of it is situated over this level (5.6%<br />
between 300-500 metres above the sea level, 2.9% from 500 to 1000 metres above the<br />
sea level <strong>and</strong> 0.2% over 1000 metres above the sea level). There are three mounta<strong>in</strong><br />
1
anges <strong>in</strong> Pol<strong>and</strong>: the Carpathians with the highest mounta<strong>in</strong>s Tatras (the highest<br />
peak Rysy – 2 499 metres above the sea level), the Sudeten with the Karkonosze<br />
mounta<strong>in</strong>s (the highest peak Ânie˝ka – 1602 metres above the sea level) <strong>and</strong> the<br />
Âwi´tokrzyskie mounta<strong>in</strong>s <strong>in</strong> the <strong>in</strong>terior of the country (the highest peak ¸ysica –<br />
612 metres above the sea level).<br />
Pol<strong>and</strong> is situated <strong>in</strong> the bas<strong>in</strong>s of the Baltic Sea, the North Sea <strong>and</strong> the Black Sea.<br />
There are many rivers <strong>in</strong> its territory (the longest one, the Odra has the length of<br />
742 km <strong>in</strong> Pol<strong>and</strong> <strong>and</strong> the Vistula – 1047 km) <strong>and</strong> lakes (the deepest Haƒcza – 108.5 m<br />
<strong>and</strong> the largest Âniardwy – 113.8 km 2 ) as well as canals <strong>and</strong> artificial reservoirs.<br />
Pol<strong>and</strong> has a moderate climate <strong>and</strong> changeable weather conditions. The summer<br />
lasts from 60 days <strong>in</strong> the lake districts up to 110 days <strong>in</strong> the Silesia Lowl<strong>and</strong>, with<br />
fluctuations <strong>in</strong> particular years. With<strong>in</strong> the last 3 years the average air temperature was<br />
8.3-9, 1-7.1ºC. The warmest part is south-west, whereas the coolest – north-east.<br />
Figure 1. Average monthly air temperature (°C)<br />
10<br />
8<br />
6<br />
4<br />
2<br />
0<br />
8,3<br />
2001<br />
2002<br />
2003<br />
9,1<br />
7,1<br />
2001 2002 2003<br />
INFORMATION ABOUT POLAND<br />
25<br />
20<br />
15<br />
10<br />
5<br />
0<br />
-5<br />
I II III IV V VI VII VIII IX X XI XII<br />
Source: Agriculture <strong>in</strong> 2003. Central Statistical Office (GUS), Warsaw 2004, based on the Institute for Meteorology <strong>and</strong> Water Management data<br />
2
INFORMATION ABOUT POLAND<br />
The ra<strong>in</strong>fall is the ma<strong>in</strong> source of water resources.<br />
Figure 2. Average monthly precipitation <strong>in</strong> Pol<strong>and</strong> (mm)<br />
800<br />
600<br />
400<br />
200<br />
0<br />
725<br />
2001<br />
2002<br />
2003<br />
2001 2002 2003<br />
As for Pol<strong>and</strong>’s adm<strong>in</strong>istrative division, it is composed of 16 voivodships<br />
(prov<strong>in</strong>ces), 314 poviats (counties), <strong>and</strong> 2478 gm<strong>in</strong>as (communes). Sixty six towns have<br />
the poviat status. The auxiliary units <strong>in</strong> communes are solectwa (the lowest group of<br />
adm<strong>in</strong>istrative division, usually compris<strong>in</strong>g a s<strong>in</strong>gle village), whose number is 40 200.<br />
Figure 3. Units of territorial division <strong>in</strong> Pol<strong>and</strong> <strong>in</strong> 2003<br />
2478<br />
16; 314<br />
643<br />
488<br />
160<br />
140<br />
120<br />
100<br />
80<br />
60<br />
40<br />
20<br />
0<br />
I II III IV V VI VII VIII IX X XI XII<br />
Source: Agriculture <strong>in</strong> 2003. GUS, Warsaw 2004, based on the Institute for Meteorology <strong>and</strong> Water Management data<br />
Number of gm<strong>in</strong>as<br />
Number of voivodships, poviats<br />
Source: GUS<br />
Pomorskie<br />
123<br />
Zachodnio- 16<br />
pomorskie<br />
114<br />
Kujawsko-<br />
18<br />
pomorskie<br />
144<br />
19<br />
Lubuskie Wielkopolskie<br />
83 226<br />
12 31<br />
¸ódzkie<br />
Warmiƒskomazurskie<br />
116<br />
19 Podlaskie<br />
118<br />
14<br />
Mazowieckie<br />
314<br />
37<br />
DolnoÊlàskie<br />
169<br />
26<br />
Opolskie<br />
71<br />
11<br />
177<br />
Lubelskie<br />
21<br />
213<br />
20<br />
Âwi´tokrzyskie<br />
102<br />
Âlàskie 13<br />
167<br />
17<br />
Podkarpackie<br />
Ma∏opolskie<br />
159<br />
182 21<br />
19<br />
3
Figure 4. Population <strong>in</strong> 1990-2003 (%)<br />
70<br />
60<br />
50<br />
40<br />
30<br />
20<br />
10<br />
0<br />
29,7<br />
57,5<br />
INFORMATION ABOUT POLAND<br />
12,8<br />
27,6<br />
58,6<br />
13,8<br />
As compared with other European countries Pol<strong>and</strong>’s population is<br />
demographically young, however, the age median has been <strong>in</strong>creas<strong>in</strong>g every year <strong>and</strong><br />
is equal to 38.0 for women <strong>and</strong> 33.9 for men at present. Children aged below 15 make<br />
up 17% of the total population aga<strong>in</strong>st 25% <strong>in</strong> 1990.<br />
4<br />
24,1<br />
61,2<br />
14,7<br />
1990 1995 2000 2003<br />
Pre-productive age (0-17 years) productive age (18-59/64 years) post-productive (60/65 <strong>and</strong><br />
more years)<br />
Source: Information on Socio-Economic Situation <strong>in</strong> Pol<strong>and</strong> <strong>in</strong> 2003.GUS, 2004<br />
22<br />
63<br />
15
AGRICULTURE<br />
General <strong>in</strong>formation on Polish <strong>agriculture</strong><br />
Terra<strong>in</strong> formation, climate <strong>and</strong> soil conditions determ<strong>in</strong>e the type <strong>and</strong><br />
effectiveness of agricultural production. The soils of average to poor agricultural<br />
quality dom<strong>in</strong>ate <strong>in</strong> Pol<strong>and</strong>. The country is characterised by great biological diversity<br />
<strong>and</strong> a huge variety of natural habitats <strong>and</strong> natural l<strong>and</strong>scapes. Farml<strong>and</strong> productivity<br />
is much lower than that <strong>in</strong> the EU-15 due to the soil quality <strong>and</strong> the climate as well<br />
as a much lower usage of agricultural <strong>in</strong>puts (m<strong>in</strong>eral fertilisers, plant protection<br />
substances). A significant part of farmers, <strong>in</strong> particular those own<strong>in</strong>g small area<br />
farms, are <strong>in</strong>volved <strong>in</strong> agricultural production apply<strong>in</strong>g traditional methods, ma<strong>in</strong>ly<br />
to ensure <strong>food</strong> supplies for their families. Animal production is mostly characterised<br />
by low <strong>in</strong>tensity, which is not harmful to the environment.<br />
The type of farm<strong>in</strong>g is to a great extent determ<strong>in</strong>ed by climactic <strong>and</strong> soil<br />
conditions as well as traditions <strong>in</strong> particular regions. Potatoes, rye <strong>and</strong> grassl<strong>and</strong><br />
dom<strong>in</strong>ate <strong>in</strong> central, eastern <strong>and</strong> northern Pol<strong>and</strong>. Orchards <strong>and</strong> berry fruit<br />
plantations are located <strong>in</strong> Mazovia, <strong>in</strong> lubelskie voivodship, <strong>in</strong> the region near the<br />
town of S<strong>and</strong>omierz as well as <strong>in</strong> Wielkopolska <strong>and</strong> ∏ódzkie voivodship.<br />
Pol<strong>and</strong> is a major producer world-wide <strong>and</strong> <strong>in</strong> Europe of many agricultural,<br />
horticultural <strong>and</strong> animal products. It ranks as the second <strong>in</strong> Europe as regards the<br />
production of berry fruits, ma<strong>in</strong>ly raspberries <strong>and</strong> currants. For many years Polish<br />
<strong>agriculture</strong> has been one of the biggest producers of onions, cabbage, cauliflowers,<br />
strawberries <strong>and</strong> apples. As rye <strong>and</strong> potato type soils dom<strong>in</strong>ate, Pol<strong>and</strong> is a lead<strong>in</strong>g<br />
producer of rye <strong>and</strong> potatoes: the 2nd largest producer of rye <strong>in</strong> the world <strong>and</strong> <strong>in</strong><br />
5
Europe <strong>and</strong> the 6th largest producer of potatoes <strong>in</strong> the world <strong>and</strong> the 2nd <strong>in</strong> Europe.<br />
As regards meat production, <strong>in</strong> particular pork, as well as milk <strong>and</strong> hen eggs Pol<strong>and</strong><br />
ranks among the 15 biggest producers <strong>in</strong> the world <strong>and</strong> <strong>in</strong> Europe.<br />
Due to low profitability of agricultural production <strong>and</strong> difficulties <strong>in</strong> sell<strong>in</strong>g<br />
agricultural commodities produced on farms, there was a grow<strong>in</strong>g tendency to leave<br />
agricultural l<strong>and</strong> fallow <strong>and</strong> idle. Accord<strong>in</strong>g to the General Agricultural Census<br />
conducted <strong>in</strong> 2002, the total area of arable l<strong>and</strong> left fallow <strong>and</strong> idle was 2.3 million<br />
ha, which accounted for 17.6% of its total area. In 2003 the area of fallow <strong>and</strong> idle<br />
l<strong>and</strong> dim<strong>in</strong>ished to 1.8 million ha. Reduction of plant production <strong>and</strong><br />
disadvantageous price relationship of agricultural products result <strong>in</strong> a systematic<br />
decrease <strong>in</strong> the share of <strong>agriculture</strong>, forestry <strong>and</strong> hunt<strong>in</strong>g <strong>in</strong> GDP.<br />
Figure 5. Share of <strong>agriculture</strong>, forestry <strong>and</strong> hunt<strong>in</strong>g <strong>in</strong> the Gross Domestic Product (%)<br />
6<br />
5<br />
4<br />
3<br />
2<br />
1<br />
0<br />
Source: GUS<br />
Value of agricultural production <strong>and</strong> price relationship<br />
In 2003, the total agricultural production was valued at PLN 56.3 billion (Euro<br />
12.8 billion) <strong>and</strong> was by almost 10% lower than <strong>in</strong> 1990. Plant production fell by<br />
21.2%, whereas the value of animal production <strong>in</strong>creased by 2.2% <strong>in</strong> the period <strong>in</strong><br />
question.<br />
Table 1. Dynamics of total agricultural production (<strong>in</strong> comparable prices)<br />
Source: GUS<br />
6<br />
5,5<br />
4,8<br />
AGRICULTURE<br />
4, 1<br />
6<br />
3,4<br />
3,1<br />
3,3<br />
2,7 2,6<br />
1995 1996 1997 1998 1999 2000 2001 2002 2003<br />
Specification<br />
2000 2001 2002 2003 2003<br />
Previous year = 100 1990=100 1995=100<br />
Total agricultural production 94,4 105,8 98,1 99,2 90,3 98,0<br />
– plant 94,2 108,6 93,3 94,3 78,8 87,4<br />
– animal 94,7 102,5 103,4 104,8 102,1 111,4<br />
Commercial production 96,0 102,9 104,2 105,2 107,3 123,0
AGRICULTURE<br />
Between 1990 <strong>and</strong> 2003 commercially-oriented production fluctuated from<br />
62.5% <strong>in</strong> 1990 to 50.1% <strong>in</strong> 1995 <strong>and</strong> to 64.9% <strong>in</strong> 2003. A large part of agricultural<br />
production is used for self-supply on farms <strong>and</strong> <strong>in</strong>ternal usage for the purposes of<br />
animal production (animal feed<strong>in</strong>gstuffs). Despite a fall <strong>in</strong> the value of plant<br />
production, its share <strong>in</strong> the total production cont<strong>in</strong>ues to be higher than that of<br />
animal production, whereas <strong>in</strong> the case of commercial production the situation is<br />
reverse.<br />
Figure 6. Structure of total agricultural production <strong>in</strong> 1995 <strong>and</strong> 2003<br />
60<br />
50<br />
40<br />
30<br />
20<br />
10<br />
0<br />
58,6<br />
41,4<br />
52,8 47,2<br />
1995 2003<br />
Plant production<br />
Animal production<br />
Cereals<br />
Potatoes<br />
Industrial plants<br />
Vegetables<br />
Fruit<br />
Other plant production<br />
Animals for slaughter<br />
Cow’s milk<br />
Hen eggs<br />
Other animal production<br />
Source: GUS<br />
7<br />
23,6<br />
15,4<br />
26,4<br />
11,8<br />
2,7 3,3<br />
11,4<br />
4,5 0,9<br />
1995<br />
2003<br />
8,8<br />
4<br />
17,2<br />
6,1<br />
18,4<br />
7,4<br />
4,7<br />
15,2<br />
7<br />
4,5<br />
6,7
Figure 7. Structure of commercial agricultural production <strong>in</strong> 1995 <strong>and</strong> 2003 (%)<br />
70<br />
60<br />
50<br />
40<br />
30<br />
20<br />
10<br />
0<br />
Source: GUS<br />
39,4<br />
60,6<br />
It is not only the volume of production which impacts the value of agricultural<br />
production, but also the level of agricultural product prices. For many years prices<br />
of agricultural products have shown a downward trend <strong>and</strong> an unfavourable<br />
relationship compared to the prices of other products.<br />
Table 2. Relationship between prices of agricultural products <strong>and</strong> prices of goods <strong>and</strong> services purchased<br />
by agricultural hold<strong>in</strong>gs<br />
Source: Agriculture <strong>in</strong> 2000. GUS<br />
40<br />
1995 2003<br />
Plant production<br />
Animal production<br />
Cereals<br />
Potatoes<br />
Industrial plants<br />
Vegetables<br />
Fruit<br />
Other plant production<br />
Animals for slaughter<br />
Cow’s milk<br />
Hen eggs<br />
Other animal production<br />
60<br />
AGRICULTURE<br />
8<br />
16,1<br />
18<br />
41<br />
36,4<br />
3,1 0,4<br />
5 0,6<br />
1995<br />
2003<br />
7,8<br />
11,2<br />
6,8<br />
1,9<br />
2,4<br />
6,1<br />
3,5<br />
6,5<br />
7,5<br />
Specification<br />
2000 2001 2002<br />
Previous year = 100<br />
2003 2003<br />
1990=100 1995=100<br />
1. Agricultural products 114,7 103,8 92,6 99,5 653,0 136,5<br />
- plant 107,4 95,9 99,8 106,2 709,5 140,1<br />
- animal 118,8 108,0 88,8 95,6 620,5 133,5<br />
2. Goods <strong>and</strong> serwices purchased 111,4 106,5 101,9 102,1 1022,6 199,5<br />
- consumer goods 110,8 104,6 101,3 100,5 1015,6 192,0<br />
- goods for current agricultural production 111,9 106,9 101,9 102,2 1067,9 202,0<br />
- <strong>in</strong>vestment goods 105,5 104,9 102,5 101,9 817,7 176,2<br />
3. Price relationship „price squeeze” (1: 2) 103,0 97,5 90,9 97,5 63,9 68,4<br />
8,9<br />
9,1<br />
7,7
AGRICULTURE<br />
With<strong>in</strong> the whole period from 1990 to 2003 very rarely did agricultural product<br />
prices show an upward trend <strong>in</strong> real terms. This was observed with<strong>in</strong> the first years<br />
of socio-economic transition, characterised by a high <strong>in</strong>flation rate, <strong>and</strong> with<strong>in</strong><br />
recent years when the <strong>in</strong>flation rate was many times lower (585.8% <strong>in</strong> 1990, 27.8%<br />
<strong>in</strong> 1995, 10.1% <strong>in</strong> 2000, 0.8% <strong>in</strong> 2003).<br />
Agricultural l<strong>and</strong> <strong>and</strong> structure of its utilisation<br />
Pol<strong>and</strong> is a country with average agricultural l<strong>and</strong> resources. In 2003, Utilised<br />
Agricultural Area (UAA) was 16.2 million ha, i.e. it accounted for 51.7% of the total<br />
Pol<strong>and</strong>’s area. Between 1990 <strong>and</strong> 2003 the acreage of UAA systematically dim<strong>in</strong>ished,<br />
ma<strong>in</strong>ly due to l<strong>and</strong> allocation for hous<strong>in</strong>g purposes. The area used for feed<strong>in</strong>g<br />
purposes as expressed <strong>in</strong> UAA per capita is high compared to the EU average <strong>and</strong> is<br />
equal to 0.42 ha. As regards the UAA acreage, Pol<strong>and</strong> is ranked as the 4th <strong>in</strong> the EU<br />
follow<strong>in</strong>g France (27.9 million ha of UAA), Spa<strong>in</strong> (26.6 million ha of UAA) <strong>and</strong><br />
Germany (17 million ha).<br />
The quality of UAA <strong>in</strong> Pol<strong>and</strong> is rather poor as evidenced by a relatively low soil<br />
quality <strong>in</strong>dex of 0.82 on average. Very good <strong>and</strong> good soils constitute only 11.5% <strong>and</strong><br />
poor <strong>and</strong> very poor quality soils – more than 34%. Grassl<strong>and</strong> is characterised by soils<br />
of particularly low quality, where l<strong>and</strong> of very good <strong>and</strong> good quality (quality class 1<br />
<strong>and</strong> 2) constitutes just 1.5%, whereas that of very poor <strong>and</strong> poor quality (quality class<br />
5 <strong>and</strong> 6) – over 42%.<br />
Beside low quality soils, the climatic conditions <strong>in</strong> Pol<strong>and</strong> are worse than those<br />
<strong>in</strong> western European countries due to which Polish <strong>agriculture</strong>, <strong>in</strong> terms of<br />
agricultural area valorisation, occupies one of the last places <strong>in</strong> Europe.<br />
At present farml<strong>and</strong> is utilised by numerous entities vary<strong>in</strong>g with regard to<br />
ownership, farm size as well as type <strong>and</strong> scale of production. Almost 95% of<br />
agricultural l<strong>and</strong> is used by the private sector, of which 87% by private agricultural<br />
hold<strong>in</strong>gs (family farms). Public sector, own<strong>in</strong>g 5% of agricultural l<strong>and</strong>, comprises<br />
State Treasury farms <strong>and</strong> state legal persons, self-governments (gm<strong>in</strong>as) <strong>and</strong><br />
agricultural hold<strong>in</strong>gs of mixed ownership with a dom<strong>in</strong>at<strong>in</strong>g state-owned stake.<br />
Figure 8. Structure of utilised agricultural area (UAA) <strong>in</strong> 1995 <strong>and</strong> 2003 (%)<br />
1,6<br />
12,7<br />
8,3<br />
Source: Agriculture <strong>in</strong> 2003. GUS.<br />
1995<br />
77,4<br />
9<br />
1,5<br />
14,5<br />
2003<br />
5,8<br />
arable l<strong>and</strong> orchards meadows pastures<br />
78,2
AGRICULTURE<br />
A characteristic feature of Polish <strong>agriculture</strong>, composed of 1 853 000<br />
agricultural hold<strong>in</strong>gs <strong>in</strong> total <strong>in</strong> 2003, is large differentiation of farm size from one<br />
hectare to several thous<strong>and</strong> hectares. The latter can be found <strong>in</strong> the private <strong>and</strong><br />
public sectors alike. The largest agricultural hold<strong>in</strong>gs were established on the<br />
former state-owned farms. The problem of farm fragmentation occurs solely <strong>in</strong> the<br />
sector of private agricultural hold<strong>in</strong>gs (1 850 500 farms). The average size of a<br />
private farm is 7.4 ha of UAA with significant regional differentiation. In southern<br />
Pol<strong>and</strong> the average farm size is 3.3 ha of UAA, whereas <strong>in</strong> the northwest – over 20 ha<br />
of UAA. In 2000 <strong>in</strong> the EU-15 there were 6.7 million agricultural hold<strong>in</strong>gs, the<br />
biggest number <strong>in</strong> Italy (more than 2 million), Spa<strong>in</strong> (nearly 1.3 million), Greece (ca<br />
800 000) <strong>and</strong> France (644 000). The average farm size <strong>in</strong> the EU was 18.7 ha,<br />
however, <strong>in</strong> certa<strong>in</strong> EU countries it was even smaller than <strong>in</strong> Pol<strong>and</strong>: Greece (4.4 of<br />
UAA), Italy (6.1 of UAA). Follow<strong>in</strong>g 1990, the number of agricultural hold<strong>in</strong>gs has<br />
been fall<strong>in</strong>g down systematically, however, ma<strong>in</strong>ly at the sacrifice of medium-size<br />
farms, whereas the number of the biggest <strong>and</strong> smallest hold<strong>in</strong>gs has <strong>in</strong>creased. In<br />
2003 a decl<strong>in</strong>e <strong>in</strong> all groups of agricultural hold<strong>in</strong>gs was observed.<br />
Figure 9. Structure of private farms by UAA size <strong>in</strong> 1995 <strong>and</strong> 2003 (%)<br />
10,7<br />
26,6<br />
9,2<br />
22,1<br />
8<br />
9,9<br />
1995<br />
2003<br />
Source: Agriculture <strong>in</strong> 2003, GUS.<br />
Total number of farms with UAA (ha)<br />
1995 - 2047,6<br />
2003 - 1850,5<br />
33<br />
21<br />
33,7<br />
25,8<br />
10<br />
31<br />
44,1<br />
UAA size on farms:<br />
1995 - 13819,9<br />
2003 - 13604,8<br />
19,1<br />
1995<br />
4,7<br />
2003 5<br />
15,2<br />
17,1<br />
28,1<br />
14,5<br />
1-2 h 2-5 h 5-10 h 10-15 15 <strong>and</strong> more<br />
21,2
Although farms of over 10 ha constitute only 19%, they utilise over 50% of UAA.<br />
Enlargement of the exist<strong>in</strong>g farms is a permanent process supported by preferential<br />
credits. In 2003 a grow<strong>in</strong>g <strong>in</strong>terest <strong>in</strong> agricultural l<strong>and</strong> purchases was noted, related<br />
ma<strong>in</strong>ly to an anticipated <strong>in</strong>crease <strong>in</strong> l<strong>and</strong> prices follow<strong>in</strong>g accession to the EU.<br />
Table 3. Average prices of arable l<strong>and</strong> <strong>and</strong> meadows <strong>in</strong> private trad<strong>in</strong>g <strong>in</strong> 1995 <strong>and</strong> 2003 (price for 1 ha)<br />
Source: Agriculture <strong>in</strong> 2003. GUS, Warszawa 2004.<br />
AGRICULTURE<br />
w dt<br />
Specification Year<br />
PLN Rye Live<br />
pigs for slaughter<br />
Arable l<strong>and</strong> on average 1995 2421 90,2 9,3<br />
2003 5753 142,2 18,2<br />
- good quality (wheat-beet) 1995 6712 161,7 18,6<br />
2003 7960 196,7 25,2<br />
- average quality (rye-potato) 1995 4920 118,5 13,7<br />
2003 5801 143,4 18,4<br />
- poor quality (s<strong>and</strong>y) 1995 2725 65,6 7,6<br />
2003 3497 86,4 11,1<br />
Meadows of good quality 1995 4883 117,6 13,6<br />
2003 5168 127,7 16,4<br />
- poor quality 1995 2753 66,3 7,6<br />
2003 3049 75,4 9,6<br />
Despite a rise <strong>in</strong> l<strong>and</strong> prices, they rema<strong>in</strong> at a low level. In 2003, as expressed <strong>in</strong><br />
Euro, the average price of arable l<strong>and</strong> was 130.8 Euro/ha (181 Euro/ha for good<br />
quality arable l<strong>and</strong>), <strong>and</strong> that of good quality meadows – 117.5 Euro/ha.<br />
On 16 July 2003, the Law of 15 April 2003 on the agricultural structure took<br />
effect lay<strong>in</strong>g down the rules for trade <strong>in</strong> agricultural l<strong>and</strong>. Its ma<strong>in</strong> objective is to<br />
create conditions for improv<strong>in</strong>g the agrarian structure of farms <strong>and</strong> to counteract<br />
excessive concentration of agricultural property. Upon l<strong>and</strong> purchases <strong>and</strong> sales<br />
preference is given to family farms, the maximum size of which has been def<strong>in</strong>ed at<br />
300 ha of UAA, run personally by a private farmer with appropriate qualifications.<br />
Real estate purchases by foreigners are provided for <strong>in</strong> the Law of 24 March<br />
1920, pursuant to which they are required to obta<strong>in</strong> a permit from the M<strong>in</strong>ister of<br />
Internal Affairs <strong>and</strong> Adm<strong>in</strong>istration for a property purchase <strong>and</strong> <strong>in</strong> the case of<br />
agricultural l<strong>and</strong> – an additional permit from the M<strong>in</strong>ister of Agriculture <strong>and</strong> Rural<br />
Development. The permit for a property purchase may be issued only when a<br />
foreigner declares that he or she will utilise the l<strong>and</strong> bought <strong>in</strong> the way as specified<br />
<strong>in</strong> the l<strong>and</strong> management plan. Upon the grant<strong>in</strong>g of permits preference is given to<br />
persons of Polish orig<strong>in</strong> <strong>and</strong> those with “permanent residence cards”.<br />
In 2003, 248 applications for 1 225 ha were submitted to the M<strong>in</strong>ister of<br />
Agriculture <strong>and</strong> Rural Development. Permits were granted <strong>in</strong> the case of 178<br />
applications for almost 480 ha. In 2003 most applications were lodged by German<br />
11
citizens – 109, Dutch citizens – 36, Austrian citizens – 17 <strong>and</strong> French citizens – 13.<br />
Foreigners were ma<strong>in</strong>ly <strong>in</strong>terested <strong>in</strong> agricultural l<strong>and</strong> located <strong>in</strong><br />
zachodniopomorskie, dolnoÊlàskie, ma∏opolskie, Êlàskie <strong>and</strong> pomorskie voivodships.<br />
In addition, the M<strong>in</strong>ister of Agriculture <strong>and</strong> Rural Development issued permits<br />
to foreigners (a favourable decision on 42 applications for 1 350 ha) for the<br />
acquisition of shares or stakes <strong>in</strong> companies. Overall, from 1990 to the end of 2003,<br />
1 099 permits were granted for purchases of property of the area of 2 655 ha <strong>and</strong> 250<br />
permits for the acquisition of shares or stakes <strong>in</strong> companies own<strong>in</strong>g 5 212 ha.<br />
Plant production<br />
AGRICULTURE<br />
In 2003 a tendency towards a decrease <strong>in</strong> the area sown to crops, observed s<strong>in</strong>ce<br />
1990 with vary<strong>in</strong>g <strong>in</strong>tensity, was stopped. The overall area sown to crops <strong>in</strong> 2003 was<br />
10 888 800 ha, i.e. it was reduced by 3 353 000 ha (23.5%) compared to 1990. The<br />
major crops <strong>in</strong> Pol<strong>and</strong> are cereals whose share with<strong>in</strong> the crop structure has been<br />
12
AGRICULTURE<br />
Figure 10. Structure of particular crops <strong>in</strong> 1990 <strong>and</strong> 2003 (%)<br />
Source: GUS<br />
Area sown<br />
1995 - 12 892<br />
2003 - 10 889<br />
Total cereals<br />
Pulses for gra<strong>in</strong><br />
Potatoes<br />
Sugar beets<br />
Oilseed crops (rapeseed, agrimony)<br />
Fodder crops<br />
Field vegetables<br />
Other<br />
11,8<br />
permanently <strong>in</strong>creas<strong>in</strong>g. Another important crop is potato, though its cultivation has<br />
been constantly reduced, fodder crops <strong>and</strong> legum<strong>in</strong>ous plants for gra<strong>in</strong>. The share<br />
of vegetables with<strong>in</strong> the crops structure has been stable.<br />
The areas sown to particular crops were adjusted to sales possibilities <strong>and</strong><br />
profitability of particular types of agricultural production. Generally, a supply<br />
surplus persisted on the market except for the years characterised by extremely<br />
disadvantageous weather conditions.<br />
Despite a high share of cereals <strong>in</strong> the area sown to crops, Pol<strong>and</strong> has been a net<br />
importer of the majority of cereals. Imports do not only cover high-gluten varieties<br />
of wheat, for the cultivation of which there are no appropriate agro-climatic<br />
conditions <strong>in</strong> Pol<strong>and</strong>, but also fodder gra<strong>in</strong>s (especially maize) <strong>and</strong> malt<strong>in</strong>g barley.<br />
In 2003 yields of major crops were lower <strong>in</strong> than <strong>in</strong> 2002. Yields <strong>in</strong> Pol<strong>and</strong> are<br />
approximately twice as low as those <strong>in</strong> the EU. Compared to certa<strong>in</strong> EU member<br />
states such as Greece <strong>and</strong> Spa<strong>in</strong>, cereals yields <strong>in</strong> Pol<strong>and</strong> are higher, however, they are<br />
significantly lower than <strong>in</strong> France, Germany, Denmark <strong>and</strong> the UK. Apart from worse<br />
agro-climatic conditions, the cause is a much lower usage of m<strong>in</strong>eral fertilisers (by ca<br />
30%) <strong>and</strong> plant protection products (several times lower) than on average <strong>in</strong> the EU.<br />
A favourable change <strong>in</strong> plant production is an <strong>in</strong>crease <strong>in</strong> production<br />
concentration, i.e. larger area under particular plants on big farms. An <strong>in</strong>crease <strong>in</strong><br />
average area sown to the majority of crops (e.g. dur<strong>in</strong>g the eight years between the<br />
Agricultural Censuses <strong>in</strong> 1996 <strong>and</strong> 2002 – from 4.16 ha to 5.16 ha for cereals, from 1.50<br />
ha to 2.64 ha for sugar beets, from 0.22 ha to 0.38 ha for vegetables) was accompanied<br />
by a rise <strong>in</strong> the number of farms grow<strong>in</strong>g cereals on the area of at least 10 ha (from 124<br />
800 to 157 900 farms), potatoes (from 884 to 1 389 farms), sugar beets (from 1 300<br />
1<br />
13<br />
3 4,7<br />
1,1<br />
4,2<br />
2,6<br />
7<br />
8,4<br />
2,2 3,9<br />
6,4 1,8 2,6<br />
1995<br />
2003<br />
66,5<br />
75
AGRICULTURE<br />
Table 4. Area, production <strong>and</strong> yields of major crops <strong>in</strong> 1996-2003<br />
A area (‘000 ha)<br />
B yields per ha (dt)<br />
C production (‘000 tonnes)<br />
Type of crops<br />
Total cereals<br />
1996-2000* 2000 2001 2002 2003<br />
1996-2000 = 100 2002=100<br />
area A 8796,0 8814,0 8820,0 8293,7 8163,3 92,8 98,4<br />
yields B 28,6 25,3 30,6 32,4 28,7 100,3 88,6<br />
production<br />
Total wheat<br />
C 25189,4 22340,6 26960,3 26877,6 23390,8 92,9 87,0<br />
area A 2576,8 2635,0 2627,0 2414,2 2308,0 89,6 95,6<br />
yields B 34,0 25,3 30,6 38,5 34,0 100,0 88,3<br />
production<br />
Rye<br />
C 8772,0 8502,9 9283,0 9304,2 7858,2 89,6 84,5<br />
area A 2275,4 2130,2 2002,3 1560,3 1479,3 65,0 94,8<br />
yields B 22,7 18,8 24,3 24,6 21,4 94,3 87,0<br />
production<br />
Total barley<br />
C 5160,0 4003,0 4863,6 3831,0 3172,2 61,5 82,8<br />
area A 1142,6 1096,0 1071,1 1051,7 1016,1 88,9 96,7<br />
yields B 29,9 25,4 31,1 32,1 27,9 93,3 86,9<br />
production<br />
Oats<br />
C 3420,0 2783,3 3330,9 3369,9 2831,5 82,8 84,0<br />
area A 590,0 565,6 531,0 605,2 526,9 89,3 87,1<br />
yields B 24,4 18,9 24,6 24,6 22,4 91,8 91,1<br />
production<br />
Total Triticale<br />
C 1437,5 1070,2 1305,2 1486,6 1181,9 82,2 79,5<br />
area A 663,4 695,3 838,3 943,9 985,6 148,6 104,4<br />
yields B 30,2 27,3 32,2 32,3 28,5 94,4 88,2<br />
production<br />
Potatoes<br />
C 2006,0 1900,9 2697,9 3047,7 2811,6 140,2 92,3<br />
area A 1292 1251 1194,2 803,4 765,8 59,3 95,3<br />
yields B 183 194 162 193 179 97,8 92,7<br />
production C 23620,0 24232,3 19379,0 15528,4 13731,5 58,1 88,5<br />
Total rapeseed <strong>and</strong> agrimony<br />
area A 409,6 436,8 443,2 438,9 426,3 104,1 97,1<br />
yields B 20,7 21,9 24,0 21,6 18,6 89,9 85,7<br />
production<br />
Sugar beets<br />
C 846,7 958,1 1063,6 949,5 793,0 93,7 83,2<br />
area A 395,4 333,1 317,5 303,0 286,3 72,4 94,5<br />
yields B 377 394 358 443 410 108,8 92,6<br />
production C 14920,1 13134,4 11363,9 13432,1 11739,5 78,7 87,4<br />
Source: GUS<br />
14
AGRICULTURE<br />
to 2 400 farms) <strong>and</strong> field vegetables on more than 5 ha (from 1 700 to 4 500 farms).<br />
Dur<strong>in</strong>g accession negotiations the reference yield was established at 3.0 t/ha<br />
result<strong>in</strong>g from average cereals yields <strong>in</strong> Pol<strong>and</strong> with<strong>in</strong> the base period, i.e. 1994/95 –<br />
1998/99 (exclud<strong>in</strong>g two extreme years). The base area was enlarged by the area<br />
grown to maize for silage <strong>and</strong> specified at 9 454 000 ha.<br />
Starch production volume was agreed at 144 985 tonnes, sugar quota A at<br />
1 580 000 t <strong>and</strong> sugar quota B at 91 900 t. The tobacco quota was established at<br />
37 933 t, the quota of flax <strong>and</strong> hemp for fibre – 1 386 t, the dried fodder quota –<br />
13 538 t <strong>and</strong> the quota of tomatoes for process<strong>in</strong>g – 194 639 t.<br />
A great variety of vegetables are produced <strong>in</strong> Pol<strong>and</strong>. The ma<strong>in</strong> vegetable crops<br />
are cabbage, carrots <strong>and</strong> onions.<br />
15
Table 5. Area, yields <strong>and</strong> production of field vegetables <strong>in</strong> 1996-2003<br />
A area (‘000 ha)<br />
B yields per ha (dt)<br />
C production (‘000 tonnes)<br />
1) annual average, 2) parsley, leek, celeriac, radish, lettuce, rhubarb, asparagus, dill <strong>and</strong> other<br />
Source: GUS<br />
AGRICULTURE<br />
1996-20011) 2001 2002<br />
Absolute figures<br />
2003<br />
1996-20001) = 100 2002=100<br />
Total A 243,6 239,9 171,3 198,4 81,5 115,8<br />
C 5345,7 5195,4 3947,2 4419,5 82,7 112,0<br />
Cabbage A 48,6 46,3 27,0 31,8 65,5 117,7<br />
B 380 369 440 389 102,4 88,4<br />
C 1846,0 1709,6 1188,5 1236,7 67,0 104,1<br />
Cauliflower A 13,0 13,0 9,8 10,4 79,7 106,0<br />
B 191 193 180 182 95,3 101,1<br />
C 248,0 250,4 176,4 188,8 76,2 107,1<br />
Onion A 33,8 34,0 27,7 32,5 96,2 117,2<br />
B 203 194 211 209 103,0 99,1<br />
C 684,4 659,5 584,9 678,3 99,1 116,0<br />
Edible carrot A 31,8 33,1 27,8 30,3 95,2 109,0<br />
B 279 279 249 276 98,9 110,8<br />
C 887,7 921,9 692,1 834,6 94,0 120,6<br />
Red beets A 21,0 19,7 10,2 13,5 64,4 132,2<br />
B 240 237 304 247 102,9 81,3<br />
C 503,1 466,4 311,2 333,5 66,3 107,1<br />
Cucumber A 27,6 26,6 18,2 20,2 73,3 111,3<br />
B 129 128 143 143 110,9 100,0<br />
C 357,3 339,6 259,7 289,7 81,1 111,6<br />
Tomato A 22,7 19,4 8,7 11,4 50,4 130,5<br />
B 128 141 253 205 160,2 81,0<br />
C 290,0 273,7 221,4 234,1 80,7 105,7<br />
Other2) Specification<br />
A 45,1 47,8 41,9 48,3 107,1 115,4<br />
B 117 120 123 129 110,3 104,9<br />
C 529,2 574,3 513,0 623,9 117,9 121,6<br />
In 2003 the total harvest of field vegetables <strong>and</strong> those under cover amounted to 5 090 700 t<br />
<strong>and</strong> was by 389 200 t (8.3%) larger than that <strong>in</strong> 2002. Crops under covers occupied<br />
54 408 000 m 2 , <strong>in</strong>clud<strong>in</strong>g plastic-covered greenhouses - 59.8%, glasshouses - 39.2% <strong>and</strong><br />
hotbeds - 1%. In 2003 the production of vegetables planted under covers was equal to 671 200 t,<br />
of which tomatoes accounted for 55.5% <strong>and</strong> cucumbers for 29.6%. There is significant<br />
regionalisation of vegetable cultivation <strong>in</strong> Pol<strong>and</strong>. Vegetables are ma<strong>in</strong>ly planted around large<br />
agglomerations, i.e. <strong>in</strong> mazowieckie, ∏ódzkie <strong>and</strong> wielkopolsie voivodships.<br />
In 2003 fresh vegetable exports were valued at USD 205.2 million, which meant<br />
a 42% <strong>in</strong>crease on the previous year. The volume of these sales <strong>in</strong>creased by as much<br />
16
AGRICULTURE<br />
as 79% on the previous year <strong>and</strong> was equal to 459 000 t. Over 30% of exported<br />
vegetables went to the EU. In 2003 exports of processed vegetables rose to 493 000 t<br />
(by almost 20%) <strong>and</strong> were valued at USD 343 million (by 23% more).<br />
Fruit production is also characterised by regionalisation, however, production<br />
concentration is to a greater degree than <strong>in</strong> the case of vegetables connected with<br />
tradition as well as soil <strong>and</strong> climatic conditions (Mazovia – region near the town of<br />
Grójec, lubelskie voivodship, area near the town of S<strong>and</strong>omierz).<br />
Figure 11. Production of field vegetables, by voivodships, <strong>in</strong> 2003 (‘000 t)<br />
Production of field vegetables<br />
4256,2 Pol<strong>and</strong> – total<br />
500 to 612<br />
300 to 499<br />
100 to 299<br />
53 to 99<br />
Figure 12. Tree fruit production, by voivodships, <strong>in</strong> 2003 (‘000 t)<br />
Tree fruit production<br />
2875,5 Pol<strong>and</strong> – total<br />
300 to 1178<br />
100 to 299<br />
50 to 99<br />
11 to 49<br />
As regards tree fruit production, apples dom<strong>in</strong>ate, account<strong>in</strong>g on average for over<br />
84% of the total fruit harvest. A vital part of both Polish tree fruit <strong>and</strong> berries is<br />
exported as fresh <strong>and</strong> processed fruit. In 2003 fresh fruit exports amounted to nearly<br />
460 000 t worth USD 150.9 million. Aga<strong>in</strong>st 2002, sales <strong>in</strong>creased <strong>in</strong> terms of<br />
quantity <strong>and</strong> value by ca 31 200 t <strong>and</strong> USD 43 million respectively. A rise was also<br />
noted <strong>in</strong> exports of processed fruit. In 2003 they were valued at more than USD 631<br />
million (a 33% <strong>in</strong>crease) <strong>and</strong> the sales volume was equal to 557 000 t (a 1%<br />
<strong>in</strong>crease). Nearly 18% of fresh fruit exports <strong>and</strong> 82% of processed fruit exports went<br />
to the EU.<br />
17<br />
Zachodniopomorskie<br />
Lubuskie<br />
Zachodniopomorskie<br />
Lubuskie<br />
Wielkopolskie<br />
DolnoÊlàskie<br />
Wielkopolskie<br />
DolnoÊlàskie<br />
Pomorskie<br />
Kujawskopomorskie<br />
¸ódzkie<br />
Opolskie<br />
Âlàskie<br />
Pomorskie<br />
Kujawskopomorskie<br />
¸ódzkie<br />
Opolskie<br />
Âlàskie<br />
Warmiƒskomazurskie<br />
Mazowieckie<br />
Âwi´tokrzyskie<br />
Ma∏opolskie<br />
Warmiƒskomazurskie<br />
Mazowieckie<br />
Âwi´tokrzyskie<br />
Ma∏opolskie<br />
Podlaskie<br />
Lubelskie<br />
Podkarpackie<br />
Podlaskie<br />
Lubelskie<br />
Podkarpackie
AGRICULTURE<br />
Table 6. Area, yields <strong>and</strong> production of tree fruits <strong>and</strong> berries <strong>in</strong> 2000-2003<br />
A area (‘000 ha)<br />
B yields per ha (dt)<br />
C production (‘000 tonnes)<br />
Fruit type 2000 2001 2002 2003<br />
Total tree fruits C 1837,1 2889,8 2603,5 2875,5<br />
Apple trees<br />
area A 165,1 166,4 168,5 159,3<br />
yields B 88 146 129 152<br />
production C 1450,4 2433,9 2167,5 2427,8<br />
Pear trees<br />
area A 18,3 18,4 14,3 14,5<br />
yields B 45 42 64 53<br />
production C 81,6 77,4 92,1 77,2<br />
Plum trees<br />
area A 31,7 31,6 26,9 25,0<br />
yields B 34 42 38 44<br />
production C 106,9 131,9 102,9 109,6<br />
Sour cherry trees<br />
area A 39,3 40 39 37,8<br />
yields B 36 45 44 51<br />
production C 139,6 179,7 173,1 191,1<br />
Cherry trees<br />
area A 21,1 11,9 11,9 11<br />
yields B 32 36 34 40<br />
production C 38,6 44,6 40,8 44,1<br />
Other: peach, apricot,<br />
walnut trees<br />
area A 10,3 10,3 9,5 9,1<br />
yields B 19 22 28 28<br />
production C 20 22,3 27 25,8<br />
Total berries 409,4 523,4 414,5 433,3<br />
Strawberries<br />
area A 62 65,8 38 43,9<br />
yields B 28 37 40 30<br />
production C 171,3 242,1 153,1 131,3<br />
Raspberries<br />
area A 12,6 12,9 13,4 13,3<br />
yields B 32 35 33 32<br />
production C 39,7 44,8 44,9 42,9<br />
Currants<br />
area A 33,5 34,5 42,3 38,9<br />
yields B 44 51 37 49<br />
production C 146,8 175,3 157,5 192,5<br />
Gooseberry<br />
area A 5,9 5,8 3,6 3,6<br />
yields B 49 51 60 56<br />
production C 28,6 29,6 21,7 20,3<br />
Other: aronia, bilberry <strong>and</strong> other<br />
area A 3,3 4,5 8,4 7,6<br />
yields B 68 70 45 61<br />
production C 23 31,6 37,3 46,3<br />
Source: GUS<br />
18
Fruit <strong>and</strong> vegetables are produced almost entirely on family farms.<br />
Animal production<br />
For many years the stock of cattle, sheep <strong>and</strong> horses has been go<strong>in</strong>g down,<br />
whereas that of pigs has been fluctuat<strong>in</strong>g. The stock <strong>and</strong> production of poultry has<br />
been <strong>in</strong>creas<strong>in</strong>g every year after a periodical fall follow<strong>in</strong>g 1990.<br />
Table 7. Livestock numbers – situation <strong>in</strong> June (thous<strong>and</strong> head of animals)<br />
* pigs (situation at end-July)<br />
Source: GUS<br />
AGRICULTURE<br />
Specification<br />
1990 1995 2000*<br />
2003*<br />
1990=100<br />
Cattle 10049 7306 6083 5489 54,6<br />
of which cows 4919 3579 3098 2897 58,9<br />
Pigs 19464 20418 17122 18605 95,5<br />
of which sows 1837 1875 1577 1782 97,0<br />
Sheep 4159 713 362 338 8,1<br />
of which ewes 2564 450 223 185 7,2<br />
Horses 941 636 550 333 35,4<br />
19
AGRICULTURE<br />
Farm animals are ma<strong>in</strong>ly raised <strong>in</strong> private agricultural hold<strong>in</strong>gs, which <strong>in</strong> 2003<br />
kept 94.3% of the total cattle, <strong>in</strong>clud<strong>in</strong>g 95% of cows, 91% of pigs <strong>and</strong> 91% of sheep.<br />
In consequence of cattle <strong>and</strong> sheep stock reduction, animal density per 100 ha of<br />
UAA fell. In 2002 animal density was as follows:<br />
• cattle – a decrease from 55.1 head/100 ha of UAA <strong>in</strong> 1988 to 32.6 head/100 ha<br />
of UAA <strong>in</strong> 2002<br />
• sheep – a decrease from 23.4 head/100 ha of UAA <strong>in</strong> 1988 to 2.0 head/100 ha of<br />
UAA <strong>in</strong> 2002,<br />
• horses – a decrease from 5.6 head/100 ha of UAA <strong>in</strong> 1988 to 1.9 head/100 ha of<br />
UAA <strong>in</strong> 2002<br />
<strong>and</strong> density of pigs <strong>in</strong>creased per 100 ha of arable l<strong>and</strong> from 135.5 head to 142.6<br />
head.<br />
On average, one farm keeps 1.9 head of cattle, 6.4 head of pigs, 0.1 head of sheep,<br />
horses <strong>and</strong> goats, <strong>and</strong> 67.8 head of all k<strong>in</strong>ds of poultry.<br />
Preparations for accession to the EU <strong>and</strong> the consequent necessity of sanitary<br />
<strong>and</strong> veter<strong>in</strong>ary adjustments <strong>in</strong> the <strong>food</strong> process<strong>in</strong>g sector <strong>and</strong> agricultural hold<strong>in</strong>gs<br />
alike accelerated the process of concentrat<strong>in</strong>g slaughter animals <strong>and</strong> milk cows’<br />
rear<strong>in</strong>g <strong>and</strong> as a result led to the elim<strong>in</strong>ation of small producers from the market.<br />
Accord<strong>in</strong>g to the 2002 General Agricultural Census, 935 200 agricultural<br />
hold<strong>in</strong>gs were <strong>in</strong>volved <strong>in</strong> cattle rear<strong>in</strong>g <strong>and</strong> breed<strong>in</strong>g (i.e. 31.9% of the hold<strong>in</strong>gs<br />
surveyed of an area from 0.10 ha), of which:<br />
- 48.4% kept 1-2 head (44.1% <strong>in</strong> 1996),<br />
- 36.1% kept 3-9 head (44.3%),<br />
- 10.2% kept 10-19 head (9.3%),<br />
- 5.3% kept 20 <strong>and</strong> more head (2.3%).<br />
As regards pig rear<strong>in</strong>g <strong>and</strong> breed<strong>in</strong>g, 760 600 agricultural hold<strong>in</strong>gs were<br />
engaged <strong>in</strong> it (i.e. 25.9% of the total hold<strong>in</strong>gs surveyed), of which:<br />
- 24% kept 1-2 head (28.9% <strong>in</strong> 1996)<br />
- 28.8% kept 3-9 head (34.1%)<br />
- 19.2% kept 10-19 head (18.5%)<br />
- 28% kept 20 <strong>and</strong> more head (18.5%)<br />
Despite an <strong>in</strong>crease <strong>in</strong> the concentration of domestic animals’ rear<strong>in</strong>g, it rema<strong>in</strong>s<br />
low <strong>and</strong> does not damage the environment. Restrictive national regulations on the<br />
environmental protection, controls of compliance with such regulations on pig farms<br />
<strong>and</strong> non-issuance of permits to set up large <strong>in</strong>dustrial farms held up activities aimed<br />
at excessive concentration of pig production.<br />
Intensity of animal (particularly pig) rear<strong>in</strong>g varies greatly <strong>in</strong> particular<br />
voivodships.<br />
20
AGRICULTURE<br />
Figure 13. Cattle livestock per 100 ha of UAA, by voivodships, <strong>in</strong> 2003 (head of animals)<br />
42 – 66,1<br />
30 – 41,9<br />
22,0 – 29,9<br />
11,2 – 21,9<br />
Figure 14. Pig livestock per 100 ha of UAA, by voivodships, <strong>in</strong> 2003 (head of animals)<br />
Source: GUS<br />
Cattle<br />
33,9<br />
Pigs<br />
115,1<br />
Pol<strong>and</strong> – on average<br />
200 – 262<br />
100 – 199<br />
70 – 99<br />
47 – 69<br />
Average for Pol<strong>and</strong><br />
Productivity of beef cattle <strong>and</strong> milk cattle is much lower <strong>in</strong> Pol<strong>and</strong> than the<br />
average <strong>in</strong> the EU-15, whereas that of pigs is at a similar level. Accord<strong>in</strong>g to the 2002<br />
data, yield of beef per head of cattle was on average 278 kg <strong>in</strong> the EU <strong>and</strong> 148 kg <strong>in</strong><br />
Pol<strong>and</strong>, that of pork: 87 kg <strong>and</strong> 86 kg <strong>in</strong> the EU <strong>and</strong> Pol<strong>and</strong> respectively <strong>and</strong> milk<br />
yield per cow was 5 735 litres <strong>in</strong> the EU <strong>and</strong> 3 778 litres <strong>in</strong> Pol<strong>and</strong>.<br />
21<br />
Zachodniopomorskie<br />
Lubuskie<br />
Wielkopolskie<br />
DolnoÊlàskie<br />
Zachodniopomorskie<br />
Lubuskie<br />
Pomorskie<br />
Kujawskopomorskie<br />
¸ódzkie<br />
Opolskie<br />
Âlàskie<br />
Wielkopolskie<br />
DolnoÊlàskie<br />
Pomorskie<br />
Kujawskopomorskie<br />
Warmiƒskomazurskie<br />
Mazowieckie<br />
Âwi´tokrzyskie<br />
Ma∏opolskie<br />
¸ódzkie<br />
Opolskie<br />
Âlàskie<br />
Podlaskie<br />
Lubelskie<br />
Podkarpackie<br />
Warmiƒskomazurskie<br />
Mazowieckie<br />
Âwi´tokrzyskie<br />
Ma∏opolskie<br />
Podlaskie<br />
Lubelskie<br />
Podkarpackie
Table 8. Production of major animal products <strong>in</strong> 1990 – 2003<br />
Source: GUS<br />
Type of production<br />
AGRICULTURE<br />
Unit 1990 1998 1999 2000 2001 2002 2003<br />
Total slaughter animals<br />
by live weight, <strong>in</strong>clud<strong>in</strong>g: ’000 t 4493 4307 4356 4112 4107 4369 4776<br />
- pigs ’000 t 2341 2601 2671 2501 2419 2601 2833<br />
- cattle ’000 t 1428 805 710 635 562 523 591<br />
- calves ’000 t 105 87 88 83 81 76 76<br />
- poultry ’000 t 474 742 819 834 994 1134 1228<br />
- horses ’000 t 37 55 52 45 36 30 30<br />
- sheep ’000 t 96 8 8 7 6 5 6<br />
Milk million l 15371 12229 11915 11543 11538 11527 11546<br />
Eggs million units 7597 7276 7462 7621 8081 8925 9168<br />
Wool T 14783 1496 1374 132 1339 1317 1218<br />
For the second consecutive year a considerable <strong>in</strong>crease <strong>in</strong> meat production <strong>and</strong><br />
supply was observed, which was advantageous to consumers (low prices) <strong>and</strong><br />
disadvantageous to livestock producers.<br />
Progress<strong>in</strong>g, though slow, concentration of cow rear<strong>in</strong>g resulted <strong>in</strong> an <strong>in</strong>crease <strong>in</strong><br />
milk yield per cow. In 2003 an average annual milk yield per cow rose to 3 969 litres,<br />
i.e. by 67 litres aga<strong>in</strong>st 2002. On the other h<strong>and</strong>, no <strong>in</strong>crease was noted <strong>in</strong> the<br />
number of eggs per lay<strong>in</strong>g hen, which was 203 eggs annually aga<strong>in</strong>st 208 eggs <strong>in</strong><br />
2002. To encourage <strong>in</strong>terest <strong>in</strong> the quality of milk sold to dairy plants, payments to<br />
extra-grade milk have been made s<strong>in</strong>ce 2002:<br />
- PLN 0.07 per litre <strong>in</strong> 2002,<br />
- PLN 0.04 per litre for Jan. – Apr. 2003,<br />
- PLN 0.07 per litre <strong>in</strong> 2003 <strong>and</strong> until the accession date, i.e. 1 May 2004.<br />
Result<strong>in</strong>g from these payments as well as grow<strong>in</strong>g requirements of the dairy <strong>in</strong>dustry,<br />
the share of extra grade milk constituted 81.4% of the total milk bought <strong>in</strong> <strong>and</strong> the<br />
number of extra grade milk suppliers accounted for 54% of the total suppliers <strong>in</strong> 2003.<br />
Follow<strong>in</strong>g accession to the EU, Pol<strong>and</strong> ab<strong>and</strong>oned payments to extra-grade milk<br />
bought <strong>in</strong> <strong>and</strong> other support <strong>in</strong>struments for milk <strong>and</strong> meat processors not comply<strong>in</strong>g<br />
with the Common Agricultural Policy. Pol<strong>and</strong> negotiated the follow<strong>in</strong>g rights to<br />
animal production premiums: special beef premium - 926 000 head, slaughter<br />
premium for calves - 839 500 head, slaughter premium for adult cattle - 1 815 400<br />
head, suckler cow premium - 325 500 head, extensification premium – 1 251 600<br />
head, a national envelope to <strong>in</strong>crease cattle premium levels – Euro 27.3 million, ewe<br />
premium - 335 800 head <strong>and</strong> Euro 355 000 to <strong>in</strong>crease premiums for sheep.<br />
Other forms of support such as <strong>in</strong>tervention, storage aid, export subsidies, milk<br />
<strong>and</strong> milk product consumption schemes at schools, subsidies to certa<strong>in</strong> dairy<br />
products will be applicable based on the rules established by the European<br />
Commission.<br />
22
Organic farm<strong>in</strong>g<br />
AGRICULTURE<br />
Food production by organic methods <strong>in</strong> the clean <strong>and</strong> safe environment,<br />
without m<strong>in</strong>eral fertilisers <strong>and</strong> synthetic plant protection substances, free of<br />
antibiotics, growth hormones or genetically modified organisms is covered by<br />
the special official control <strong>and</strong> certification scheme. Such scheme is run <strong>in</strong><br />
Pol<strong>and</strong> by the M<strong>in</strong>ister of Agriculture <strong>and</strong> Rural Development who gives<br />
authorisation to certify<strong>in</strong>g bodies, the Agriculture <strong>and</strong> Food Quality Inspection<br />
as the supervisory authority of the authorised certify<strong>in</strong>g bodies, <strong>and</strong> to certify<strong>in</strong>g<br />
bodies accredited at the Polish Accreditation Centre accord<strong>in</strong>g to norm PN/EN<br />
45011.<br />
In 2004 six authorised certify<strong>in</strong>g authorities are responsible for control <strong>and</strong><br />
certification of organic farm<strong>in</strong>g:<br />
• Polish Test<strong>in</strong>g <strong>and</strong> Certification Centre, Office for Test<strong>in</strong>g <strong>and</strong> Certification,<br />
Branch <strong>in</strong> Pi∏a, 64-920 Pi∏a, ul. Âniadeckich 5<br />
• Organic Food Certification Unit PNG Sp. z o.o. <strong>in</strong> Zajàczkowo, 26-065<br />
Piekoszów<br />
• BIOEKSPERT s.c., 02-120 Warszawa, ul. Grójecka 109<br />
• AGRO BIO TEST Sp. z o.o., 02-787 Warszawa, ul. Nowoursynowska 166<br />
• COBICO Sp. z o. o., 26-065 Kraków, ul. Lekarska 1<br />
• Ekogwarancja PSTRE Sp. z o.o. 20-834 Lubl<strong>in</strong>, ul. Irysowa 12/2<br />
23
Figure 13. Organic farms <strong>in</strong> Pol<strong>and</strong> <strong>in</strong> 2003.<br />
2286 farms<br />
50 000 ha of UAA<br />
Source: Agriculture <strong>and</strong> Food Quality Inspection<br />
AGRICULTURE<br />
Zachodniopomorskie<br />
85<br />
6876.07<br />
Pomorskie<br />
46<br />
2448.86<br />
Kujawskopomorskie<br />
62<br />
Warmiƒskomazurskie<br />
126<br />
6573.41 Podlaskie<br />
122<br />
2307.78<br />
Lubuskie<br />
20<br />
1037.91<br />
1165.16<br />
Wielkopolskie<br />
40<br />
1817.23<br />
¸ódzkie<br />
Mazowieckie<br />
249<br />
2862.09<br />
DolnoÊlàskie<br />
110<br />
4572 Opolskie<br />
19<br />
250.51<br />
34<br />
485.60<br />
Âwi´tokrzyskie<br />
382<br />
Âlàskie 3422.77<br />
33<br />
Lubelskie<br />
263<br />
3393.05<br />
217.49<br />
Ma∏opolskie<br />
407<br />
5488.42<br />
Podkarpackie<br />
288<br />
7010.03<br />
Every producer <strong>in</strong>volved <strong>in</strong> organic farm<strong>in</strong>g is <strong>in</strong>spected at least once a year by<br />
the authorised certify<strong>in</strong>g body which issues certificates for 12 months. In addition,<br />
unannounced checks are carried out.<br />
Figure 14. Number of organic farms <strong>in</strong>spected <strong>in</strong> Pol<strong>and</strong> <strong>in</strong> 1990-2003<br />
2500<br />
2000<br />
1500<br />
1000<br />
500<br />
0<br />
27 49 94<br />
180<br />
246 263 238<br />
24<br />
324<br />
417<br />
555<br />
1419<br />
1787<br />
1977<br />
1990 1991 1992 1993 1994 1995 1996 1997 1998 1999 2000 2001 2002 2003<br />
Source: Agriculture <strong>and</strong> Food Quality Inspection<br />
2286
The number of organic farms has been cont<strong>in</strong>uously go<strong>in</strong>g up; <strong>in</strong> 2003 it<br />
<strong>in</strong>creased by 15.6% on the previous year. Nevertheless, the number of organic farms<br />
<strong>in</strong> Pol<strong>and</strong> rema<strong>in</strong>s small, consider<strong>in</strong>g that nearly all its soils meet high<br />
environmental requirements, i.e. they are not polluted with heavy metals <strong>and</strong> other<br />
<strong>in</strong>dustrial pollutants as well as fertilisers <strong>and</strong> pesticides.<br />
Population <strong>and</strong> human resources <strong>in</strong> <strong>agriculture</strong><br />
Accord<strong>in</strong>g to the General Population <strong>and</strong> Hous<strong>in</strong>g Census <strong>and</strong> the Agricultural<br />
Census, conducted <strong>in</strong> 2002, 10 474 500 people, i.e. 27.4% of Pol<strong>and</strong>’s population,<br />
lived <strong>in</strong> households connected with a farm (area of more than 10 ares) user. Eighty<br />
per cent or 8 504 900 people were <strong>in</strong>habitants of rural areas. This implies that<br />
58.2% of the total rural population was connected with farm<strong>in</strong>g through a common<br />
household.<br />
As compared to the results of the 1996 General Agricultural Census, the number<br />
of people <strong>in</strong> agricultural hold<strong>in</strong>gs fell by 1 084 700 or 9.4%. The number of persons<br />
liv<strong>in</strong>g off work <strong>in</strong> agricultural hold<strong>in</strong>gs is constantly decreas<strong>in</strong>g, whereas that of<br />
people ma<strong>in</strong>ta<strong>in</strong>ed by farmers or with non-ga<strong>in</strong>ful sources of <strong>in</strong>come (ma<strong>in</strong>ly old age<br />
<strong>and</strong> disability pensions) is <strong>in</strong>creas<strong>in</strong>g.<br />
As regards the education level, the situation improved, though the number of<br />
people with tertiary, post-secondary or secondary education is much lower <strong>in</strong> rural<br />
areas <strong>and</strong> the farm<strong>in</strong>g sector than <strong>in</strong> towns.<br />
Compared to the EU-15 average, the structure of agricultural hold<strong>in</strong>g users <strong>in</strong><br />
Pol<strong>and</strong> is more favourable.<br />
Figure 15. Structure of agricultural hold<strong>in</strong>g users <strong>in</strong> the EU <strong>and</strong> <strong>in</strong> Pol<strong>and</strong> (%)<br />
13,3<br />
12,3<br />
56,8<br />
AGRICULTURE<br />
Pol<strong>and</strong> UE<br />
17,5<br />
Source: GUS <strong>and</strong> FAPA (data for the EU – 1993, for Pol<strong>and</strong> – 2002)<br />
25<br />
24,9<br />
28,3<br />
up tp 35 36-54 55-64 >65<br />
years years years years<br />
8,7<br />
38,1
AGRICULTURE<br />
The number of agricultural hold<strong>in</strong>g users with tertiary education almost<br />
doubled (from 2.6% <strong>in</strong> 1996 to 5.1% <strong>in</strong> 2002). The percentage of users with post<br />
secondary, secondary vocational <strong>and</strong> general secondary education rose considerably,<br />
whereas that with primary, not complete primary <strong>and</strong> without school education fell<br />
(from 49.7% <strong>in</strong> 1996 to 34.8%).<br />
A reduction of employment <strong>in</strong> <strong>agriculture</strong>, an <strong>in</strong>crease <strong>in</strong> labour efficiency<br />
<strong>and</strong> elim<strong>in</strong>ation of hidden unemployment <strong>in</strong> <strong>agriculture</strong> are major issues to be<br />
resolved <strong>in</strong> Polish <strong>agriculture</strong>, <strong>in</strong> order to improve, <strong>in</strong>ter alia, <strong>in</strong>comes of farmers’<br />
families.<br />
At the same time ab<strong>and</strong>on<strong>in</strong>g farm<strong>in</strong>g or f<strong>in</strong>d<strong>in</strong>g a new job is extremely difficult<br />
due to high unemployment <strong>in</strong> Pol<strong>and</strong> <strong>and</strong> will require the commitment of ample<br />
funds <strong>in</strong> the long term.<br />
Economic situation of agricultural population<br />
Similarly as <strong>in</strong> other countries, farm owners have various sources of <strong>in</strong>come. Due<br />
to a decl<strong>in</strong>e <strong>in</strong> <strong>in</strong>comes from farm<strong>in</strong>g, observed practically <strong>in</strong> the whole period of<br />
socio-economic transition, for a grow<strong>in</strong>g number of farmers’ families <strong>in</strong>comes from<br />
work on own farms is not the ma<strong>in</strong> source of ma<strong>in</strong>tenance.<br />
Figure 16. Population structure <strong>in</strong> agricultural hold<strong>in</strong>gs by sources of <strong>in</strong>come <strong>in</strong> 1996 <strong>and</strong> 2002 (%)<br />
Total population <strong>in</strong> agricultural hold<strong>in</strong>gs<br />
(’ooo people)<br />
1996 - 11559,9<br />
2002 - 10474,5<br />
Liv<strong>in</strong>g off work;<br />
- exclusively <strong>in</strong> agricultural hold<strong>in</strong>gs<br />
- ma<strong>in</strong>ly <strong>in</strong> agricultural hold<strong>in</strong>gs<br />
- exlusively or ma<strong>in</strong>ly <strong>in</strong> agricultural hold<strong>in</strong>gs<br />
Liv<strong>in</strong>g off:<br />
- exclusively or ma<strong>in</strong>ly non-ga<strong>in</strong>ful employment<br />
- ma<strong>in</strong>ta<strong>in</strong>ed<br />
- not established sources of liv<strong>in</strong>g<br />
26<br />
32,8<br />
38,8<br />
28,5<br />
1996<br />
0,5<br />
2002<br />
Source: GUS, General Agricultural Census <strong>in</strong> 1996 <strong>and</strong> National General Census of Population <strong>and</strong> Hous<strong>in</strong>g <strong>in</strong> 2002.<br />
0,4<br />
25,8<br />
16<br />
12,3<br />
1,5<br />
1,6<br />
20,6<br />
21,2
AGRICULTURE<br />
In Pol<strong>and</strong>, there is a large share of persons liv<strong>in</strong>g off non-ga<strong>in</strong>ful sources of <strong>in</strong>come,<br />
i.e. ma<strong>in</strong>ly old-age <strong>and</strong> disability pensions <strong>and</strong> persons ma<strong>in</strong>ta<strong>in</strong>ed, ma<strong>in</strong>ly children.<br />
The ma<strong>in</strong> cause of the fall <strong>in</strong> agricultural production profitability <strong>and</strong> farmers’<br />
<strong>in</strong>comes were prices of agricultural products unfavourable for <strong>agriculture</strong>, actually<br />
the disadvantageous relationship between the prices of such products <strong>and</strong> those of<br />
agricultural <strong>in</strong>puts <strong>and</strong> other goods <strong>and</strong> services.<br />
Figure 17. Dynamics of real gross <strong>in</strong>come at the disposal <strong>in</strong> the household sector<br />
Source: GUS<br />
140<br />
120<br />
100<br />
80<br />
60<br />
40<br />
20<br />
0<br />
1995=100<br />
1996 1997 1998 1999 2000 2001 2002<br />
Aga<strong>in</strong>st other social groups, the pay for work <strong>in</strong> <strong>agriculture</strong> is much lower. As<br />
compared to the remuneration of employees <strong>in</strong> other sectors of the <strong>economy</strong>,<br />
farmers earned 36% less.<br />
A representative survey of household budgets shows that a share of <strong>in</strong>come<br />
generated from hired labour <strong>and</strong> self-employment rema<strong>in</strong>s at a low level <strong>in</strong> farmers’<br />
households.<br />
Figure 18. Structure of agricultural families’ <strong>in</strong>come per capita <strong>in</strong> 1995 <strong>and</strong> 2002<br />
Source: GUS<br />
Total households Farmers’ households<br />
Total <strong>in</strong>come generated from private farm<br />
Total <strong>in</strong>come generated from hired labour<br />
Total <strong>in</strong>come generated from self-employment<br />
Social benefits<br />
Other <strong>in</strong>come<br />
0,6<br />
1,4<br />
1,4<br />
0,1<br />
27<br />
19,6<br />
19,9<br />
1995<br />
2,2<br />
2002<br />
3<br />
124,7<br />
48,7<br />
76,2<br />
75,6
AGRICULTURE<br />
The level of farms’ <strong>in</strong>comes <strong>and</strong> the share of particular categories <strong>in</strong> the<br />
total <strong>in</strong>come vary, ma<strong>in</strong>ly depend<strong>in</strong>g on the area size <strong>and</strong> the type of<br />
production.<br />
Off-farm<strong>in</strong>g activities <strong>in</strong> agricultural hold<strong>in</strong>gs<br />
The General Agricultural Census conducted <strong>in</strong> 2002 showed that economic<br />
activities (farm<strong>in</strong>g <strong>and</strong> off-farm<strong>in</strong>g) <strong>in</strong> the form of self-employment were pursued<br />
by 2 281 600 agricultural hold<strong>in</strong>gs of an area of 10 ares <strong>and</strong> more, i.e. 77.8% of the<br />
total farms. There were 2 280 400 private farms <strong>and</strong> 1 200 public sector farms<br />
carry<strong>in</strong>g on bus<strong>in</strong>ess. Holders of 651 600 farms (22.2%) were not <strong>in</strong>volved <strong>in</strong><br />
farm<strong>in</strong>g (their whole UAA was left idle <strong>and</strong> they did not have any farm animals),<br />
neither <strong>in</strong> off-farm<strong>in</strong>g activities, <strong>and</strong> the source of their <strong>in</strong>comes were, <strong>in</strong>ter alia,<br />
social benefits <strong>and</strong> hired labour.<br />
Users of 363 400 agricultural hold<strong>in</strong>gs, i.e. 12.4% of all farm users aga<strong>in</strong>st 8.1%<br />
<strong>in</strong> 1996, were engaged exclusively or additionally <strong>in</strong> off-farm<strong>in</strong>g activities. Compared<br />
to 1996, <strong>in</strong> 2002 the number of such farms went up by 46%, however, it is still too<br />
small.<br />
Out of the total number of farms <strong>in</strong>volved <strong>in</strong> non-agricultural bus<strong>in</strong>ess, 104 000<br />
or 28.6% temporarily suspended their agricultural activities, whereas 259 400<br />
pursued farm<strong>in</strong>g <strong>and</strong> off-farm<strong>in</strong>g activities simultaneously.<br />
28
AGRICULTURE<br />
Figure 19. Agricultural hold<strong>in</strong>gs <strong>in</strong>volved <strong>in</strong> off-farm<strong>in</strong>g activities, by area, <strong>in</strong> 1996 <strong>and</strong> 2002<br />
Agricultural hold<strong>in</strong>gs <strong>in</strong>volved <strong>in</strong> off-farm<strong>in</strong>g<br />
activities (’000)<br />
1996 - 249,0<br />
2002 - 363,4<br />
Up to 1 ha<br />
1-5 ha<br />
5-10 ha<br />
10-20 ha<br />
20-50 ha<br />
50 ha <strong>and</strong> more<br />
Source: General Agricultural Census <strong>in</strong> 1996 <strong>and</strong> 2002.GUS.<br />
12,0%<br />
14,0%<br />
Agricultural hold<strong>in</strong>gs <strong>in</strong>volved <strong>in</strong> one of the off-farm<strong>in</strong>g activity sections<br />
dom<strong>in</strong>ate (93.2%), while those engaged <strong>in</strong> two sections make up 6.2% <strong>and</strong> those <strong>in</strong><br />
three or more sections only 0.6%.<br />
One of major bus<strong>in</strong>esses conducted by farms is agro-tourism, eco-tourism <strong>and</strong><br />
rural tourism, whose development varies depend<strong>in</strong>g on the region. Of decisive<br />
importance is the region’s attractiveness. Agro-tourism <strong>and</strong> rural tourism are<br />
concentrated <strong>in</strong> the mounta<strong>in</strong>ous areas, at the seaside <strong>and</strong> <strong>in</strong> the vic<strong>in</strong>ity of lakes,<br />
rivers <strong>and</strong> forests.<br />
At present holiday makers <strong>in</strong> rural areas take <strong>in</strong>to account the criteria less<br />
appreciated so far, such as:<br />
– protected flora <strong>and</strong> fauna enabl<strong>in</strong>g the development of nature tourism<br />
<strong>in</strong>dividually,<br />
– nature reserves enabl<strong>in</strong>g nature observation comb<strong>in</strong>ed with film<strong>in</strong>g <strong>and</strong><br />
photograph<strong>in</strong>g as well as areas characterised by historically formed dist<strong>in</strong>ct<br />
regional features with well-preserved artisan traditions, e.g. sculpture, pottery,<br />
smithery, bee-keep<strong>in</strong>g, etc.,<br />
– proximity to health resort communes (48 <strong>in</strong> Pol<strong>and</strong>) – a possibility of<br />
benefit<strong>in</strong>g from professional treatment while preserv<strong>in</strong>g anonymity <strong>and</strong><br />
enjoy<strong>in</strong>g leisure time <strong>in</strong> a family atmosphere full of peace <strong>and</strong> quiet,<br />
– a significant element of rural cultural heritage – tak<strong>in</strong>g part <strong>in</strong> hunt<strong>in</strong>g, feasts<br />
organised <strong>in</strong> cottages <strong>in</strong> rural areas,<br />
– stay<strong>in</strong>g at an ecological farm where <strong>food</strong> is organic, as confirmed by the<br />
29<br />
37,4%<br />
1996<br />
7,0% 2,7%1,6%<br />
8,0%<br />
2002<br />
3,2%1,5%<br />
43,5%<br />
39,3%<br />
29,8%
AGRICULTURE<br />
EKOLAND certificate, as well as the whole environment (build<strong>in</strong>g, on-farm<br />
treatment plant).<br />
The data below <strong>in</strong>dicate the development of agro-tourism <strong>and</strong> rural tourism<br />
with<strong>in</strong> recent years: <strong>in</strong> 1990 there were as little as 590 agro-tourism households,<br />
whereas <strong>in</strong> 2002, accord<strong>in</strong>g to the General Agricultural Census, there were 12 000<br />
of such households of which 4 000 private rooms on farms. There are 128 000 beds<br />
<strong>in</strong> these private rooms from the hostel level to a luxurious suite at attractive <strong>and</strong><br />
competitive prices.<br />
Most agricultural hold<strong>in</strong>gs ensur<strong>in</strong>g agro-tourism <strong>and</strong> rural tourism services are<br />
located <strong>in</strong> ma∏opolskie (3 433), warmiƒsko-mazurskie (2 500), pomorskie (2 392)<br />
voivodships.<br />
Around 600 agro-tourism farms obta<strong>in</strong>ed categorisation from the Polish<br />
Federation of Rural Tourism “Guest Farms”.<br />
Further <strong>in</strong>formation on agro-tourism <strong>and</strong> rural tourism may be found on the<br />
website (www.agritourism.pl). Every year the rural tourism atlas Polish Villages<br />
Invite You <strong>and</strong> the map Rural Tourism are published.<br />
30
AGRICULTURE<br />
Organisation of the agricultural market<br />
For many years measures have been carried out <strong>in</strong> Pol<strong>and</strong> to establish market<br />
<strong>in</strong>stitutions <strong>in</strong>volved <strong>in</strong> the professional organisation of wholesale trade <strong>in</strong> agri-<strong>food</strong><br />
products <strong>and</strong> to set up agricultural producer groups co-operat<strong>in</strong>g with such<br />
markets.<br />
Result<strong>in</strong>g from the implementation of the m<strong>in</strong>isterial programme <strong>and</strong><br />
government programmes to establish <strong>and</strong> develop wholesale markets <strong>and</strong> the<br />
Warsaw Commodity Exchange – stages 1 <strong>and</strong> 2, over a dozen or so wholesale<br />
markets, established <strong>in</strong> the form of jo<strong>in</strong>t stock companies, operate <strong>in</strong> Pol<strong>and</strong>. The<br />
ma<strong>in</strong> shareholders of these companies are the State Treasury, Agency for<br />
Restructur<strong>in</strong>g <strong>and</strong> Modernisation of Agriculture, traders, self-government<br />
organisations, agricultural producers <strong>and</strong> other bodies.<br />
The operation of wholesale markets contributes to an improvement of<br />
agricultural hold<strong>in</strong>g effectiveness by ensur<strong>in</strong>g:<br />
– greater price stabilisation,<br />
– supply <strong>and</strong> dem<strong>and</strong> equilibrium,<br />
– <strong>in</strong>troduction of st<strong>and</strong>ards,<br />
– reduction <strong>in</strong> the number of <strong>in</strong>termediaries <strong>in</strong> trade <strong>and</strong> consequently an<br />
<strong>in</strong>crease <strong>in</strong> producers’ <strong>in</strong>comes,<br />
– stimulation of a process of adjust<strong>in</strong>g agricultural production to market<br />
requirements,<br />
– establishment of a producer market (supply organisation).<br />
Thanks to co-ord<strong>in</strong>ation <strong>and</strong> concentration of supplies from producers <strong>and</strong><br />
technical <strong>and</strong> logistics capabilities, wholesale markets offer large <strong>and</strong> homogenous<br />
product batches. They also offer services related to the promotion <strong>and</strong> advertis<strong>in</strong>g<br />
of agri-<strong>food</strong> products, quality control, st<strong>and</strong>ardisation, process<strong>in</strong>g <strong>and</strong> packag<strong>in</strong>g.<br />
The pan-regional wholesale markets built from scratch <strong>in</strong> Poznaƒ, Warsaw<br />
(Bronisze), Gdaƒsk, Wroc∏aw <strong>and</strong> Lubl<strong>in</strong> (Elizówka) are state-of-the-art facilities,<br />
fulfill<strong>in</strong>g European requirements. In addition, there are also local markets which were<br />
often established as a result of adaptation of the exist<strong>in</strong>g facilities. The wholesale<br />
markets are not only a trad<strong>in</strong>g place but also <strong>in</strong>formation databases on supply <strong>and</strong><br />
dem<strong>and</strong>. The markets are now start<strong>in</strong>g establish<strong>in</strong>g logistics centres that will<br />
facilitate trade <strong>in</strong> commodities <strong>in</strong> the area with<strong>in</strong> the wholesale market <strong>in</strong>fluence.<br />
The proper function<strong>in</strong>g of the wholesale markets largely depends on the<br />
development of producer groups <strong>and</strong> their entry on the wholesale markets. The<br />
development of producer groups <strong>in</strong> Pol<strong>and</strong> – tak<strong>in</strong>g <strong>in</strong>to account particularly large<br />
fragmentation of agricultural hold<strong>in</strong>gs – is the primary task aimed at the proper<br />
operation of the Polish agricultural market <strong>and</strong> adaptation to EU requirements,<br />
especially those concern<strong>in</strong>g the organisation of the fruit <strong>and</strong> vegetable markets.<br />
The process of sett<strong>in</strong>g up agricultural producer groups was commenced <strong>in</strong><br />
Pol<strong>and</strong> <strong>in</strong> 1992-1993. It was preceded by a rapid, fourfold fall <strong>in</strong> the share of the<br />
cooperative sector <strong>in</strong> buy<strong>in</strong>g <strong>in</strong> agri-<strong>food</strong> products <strong>and</strong> a five to sixfold fall <strong>in</strong> <strong>food</strong><br />
process<strong>in</strong>g.<br />
31
AGRICULTURE<br />
Accord<strong>in</strong>g to the Accession Treaty, agricultural producer groups (exclud<strong>in</strong>g fruit,<br />
vegetable, mushroom <strong>and</strong> fish producers whose groups operate pursuant to subsector<br />
arrangements) are entered <strong>in</strong> voivods’ registers <strong>and</strong> as from 1 May 2004 to 31<br />
December 2006 they will receive f<strong>in</strong>ancial assistance result<strong>in</strong>g from the measures of<br />
the Rural Areas Development Plan.<br />
Adopted on 16 November 2000, the Law establish<strong>in</strong>g warehouses <strong>and</strong> amend<strong>in</strong>g<br />
the Civil Code, the Code of Civil Proceed<strong>in</strong>gs <strong>and</strong> other laws (Dz. U. (OJ) No 114,<br />
item. 1191) provides for the creation of new <strong>in</strong>stitutions – warehouses. It lays down<br />
the rules of their operation <strong>and</strong> issuance of warehouse receipts <strong>and</strong> trade <strong>in</strong> such<br />
receipts.<br />
Based on contracts with the entities giv<strong>in</strong>g their commodities for storage,<br />
warehouses store such goods <strong>and</strong> are authorised <strong>in</strong> certa<strong>in</strong> circumstances to issue<br />
securities – warehouse receipts. The objectives of this <strong>in</strong>stitution are:<br />
– to improve <strong>and</strong> secure trade <strong>in</strong> commodities,<br />
– to <strong>in</strong>troduce a new basis for credit.<br />
Warehouses are a significant factor <strong>in</strong> regulat<strong>in</strong>g trade <strong>in</strong> agri-<strong>food</strong> products.<br />
They ensure the preservation of the commodity ownership, permitt<strong>in</strong>g at the same<br />
time to make payments <strong>and</strong> to contract credits due to future sales of the stored<br />
commodities. Regulations lay<strong>in</strong>g down the rules for establishment <strong>and</strong> supervision<br />
of warehouses guarantee the proper operation of such <strong>in</strong>stitutions. The M<strong>in</strong>ister<br />
competent for agricultural markets is responsible for supervision of agricultural<br />
goods warehouses.<br />
By the end of June 2004 permission to operate warehouses was granted to 34<br />
entities that have the total storage capacity of 455 000 t. The warehouses are<br />
authorised to store cereal gra<strong>in</strong>s, rape seeds <strong>and</strong> papilionaceous plant seeds.<br />
32
FOOD INDUSTRY<br />
General <strong>in</strong>formation about the <strong>food</strong> <strong>in</strong>dustry<br />
Food <strong>in</strong>dustry, compris<strong>in</strong>g the production of <strong>food</strong>stuffs <strong>and</strong> beverages as well as<br />
tobacco products, accounts for 1/5 of the total sales of the Polish <strong>in</strong>dustry. There are<br />
over 30 000 <strong>food</strong> process<strong>in</strong>g establishments, however, <strong>in</strong> 2003 only 1526 enterprises<br />
employed 50 <strong>and</strong> more people <strong>and</strong> ca 1 250 medium-size companies employed 9-50<br />
people. The rema<strong>in</strong><strong>in</strong>g establishments have small production capacities <strong>and</strong> operate<br />
on local markets. In 2003 the number of the smallest <strong>and</strong> the biggest enterprises fell<br />
down, whereas that of medium enterprises rema<strong>in</strong>ed stable.<br />
The majority of the Polish <strong>food</strong> <strong>in</strong>dustry is privately owned. In 2003 with<strong>in</strong> the<br />
group of the biggest enterprises (50 <strong>and</strong> more employees) as little as 7.7% of<br />
product <strong>and</strong> raw material sales came from the public sector establishments.<br />
With<strong>in</strong> the last three years the <strong>food</strong> <strong>in</strong>dustry output has been <strong>in</strong>creas<strong>in</strong>g faster<br />
than domestic dem<strong>and</strong> <strong>and</strong> agricultural production. This implies that the share of<br />
the <strong>in</strong>dustry <strong>in</strong> the fulfilment of the dem<strong>and</strong> <strong>and</strong> utilisation of agricultural produce<br />
is <strong>in</strong>creas<strong>in</strong>g.<br />
One of the major factors of the <strong>food</strong> <strong>in</strong>dustry development has been export, <strong>in</strong><br />
particular with<strong>in</strong> the last two years. As compared to the period prior to the economic<br />
transformation, the output of <strong>food</strong>, beverages <strong>and</strong> tobacco products rose by 35%.<br />
33
Table 9. Sold output 1) , average employment <strong>and</strong> remuneration <strong>in</strong> 2003 <strong>in</strong> enterprises employ<strong>in</strong>g 50 <strong>and</strong> more<br />
employees<br />
1) at current prices; dynamics at constant prices<br />
Source: GUS<br />
FOOD INDUSTRY<br />
Sold output Average employment Average monthy<br />
Sections, subsection <strong>and</strong> groups gross remuneration<br />
PLN million 2002=100 (’000) 2002=100 PLN 2002=100<br />
Industrial process<strong>in</strong>g<br />
Production of <strong>food</strong>stuffs<br />
362253,0 113,5 1534,8 99,9 2197,83 103,0<br />
<strong>and</strong> beverages<br />
Production, process<strong>in</strong>g <strong>and</strong> preservation<br />
75340,5 108,0 286,9 101,1 2086,08 101,7<br />
of meat <strong>and</strong> meat products 18268,5 114,2 82,4 111,3 1538,57 100,9<br />
Process<strong>in</strong>g <strong>and</strong> preservation of fish 1845,5 137,9 8,9 105,5 1556,79 103,3<br />
Fruit <strong>and</strong> vegetable process<strong>in</strong>g<br />
Production of oils <strong>and</strong> fats of plant <strong>and</strong><br />
7647,9 117,4 30,6 102,8 2061,31 103,6<br />
animal orig<strong>in</strong> 2049,4 99,7 2,8 84,2 3317,37 105,4<br />
Production of dairy products<br />
Production of gra<strong>in</strong> mill<strong>in</strong>g products,<br />
12210,4 103,9 44,3 96,5 1985,07 103,9<br />
starch <strong>and</strong> starch products 2462,9 107,8 6,8 100,4 2269,98 101,3<br />
Production of animal feed<strong>in</strong>gstuffs<br />
Production<br />
5202,0 105,4 6,5 94,2 3888,61 103,1<br />
of other <strong>food</strong>stuffs 14511,7 100,9 75,8 94,4 2169,02 103,1<br />
Production of beverages 11142,2 105,3 29,0 101,4 3203,80 102,5<br />
Tobacco products output 3313,1 102,5 6,2 84,2 4426,37 107,7<br />
As regards average monthly remuneration, it amounted to ca Euro 500 (prior to<br />
taxation) <strong>in</strong> the <strong>in</strong>dustrial process<strong>in</strong>g sector, Euro 474 <strong>in</strong> <strong>food</strong> <strong>and</strong> beverage<br />
establishments <strong>and</strong> Euro 1 006 <strong>in</strong> the tobacco <strong>in</strong>dustry.<br />
Despite a rise <strong>in</strong> the output <strong>in</strong>tended for export, it is ma<strong>in</strong>ly sold on the domestic<br />
market. The share of exports <strong>in</strong> the total revenues of the <strong>food</strong> <strong>in</strong>dustry <strong>in</strong>creased<br />
from 6.9% <strong>in</strong> 2002 to 8.8% <strong>in</strong> 2003. Although mult<strong>in</strong>ational companies have a<br />
significant share <strong>in</strong> the tobacco <strong>in</strong>dustry, exports of tobacco products rema<strong>in</strong>ed at a<br />
low level (2.5% <strong>in</strong> 2003 aga<strong>in</strong>st 1.2% <strong>in</strong> 2002.<br />
Pol<strong>and</strong>’s major exports are fish products (36.8%) <strong>and</strong> fruit <strong>and</strong> vegetable<br />
products (28.6%), <strong>in</strong>clud<strong>in</strong>g processed potatoes (25.1%) <strong>and</strong> processed fruit <strong>and</strong><br />
vegetables (33.8%).<br />
An important feature of the <strong>food</strong> <strong>in</strong>dustry development with<strong>in</strong> the recent years<br />
is accelerated <strong>in</strong>dustrialisation of agricultural produce process<strong>in</strong>g (an <strong>in</strong>crease <strong>in</strong><br />
large <strong>in</strong>dustrial establishments). This is an effect of speed<strong>in</strong>g up alignment with<br />
EU st<strong>and</strong>ards <strong>and</strong> conditions for conduct<strong>in</strong>g bus<strong>in</strong>ess operations on the European<br />
market. Despite a considerable progress, the share of the <strong>food</strong> <strong>in</strong>dustry <strong>in</strong> the<br />
utilisation of agricultural output rema<strong>in</strong>s low <strong>and</strong> is equal to ca 25-30% <strong>in</strong><br />
vegetable <strong>and</strong> potato process<strong>in</strong>g sector, nearly 50% <strong>in</strong> the case of the slaughter of<br />
34
FOOD INDUSTRY<br />
animals for slaughter, ca 65% <strong>in</strong> cereals <strong>and</strong> milk process<strong>in</strong>g <strong>and</strong> over 80% <strong>in</strong> fruit<br />
process<strong>in</strong>g.<br />
Adjustment processes contributed to a significant <strong>in</strong>vestment recovery<br />
after a 3-year decl<strong>in</strong>e <strong>in</strong> expenditure on fixed assets. In 2003 <strong>in</strong>vestment<br />
expenditure <strong>in</strong>creased by approximately 30% <strong>and</strong> was equal to more than<br />
USD 1.5 billion <strong>and</strong> the <strong>in</strong>vestment rate rose from 5.8% <strong>in</strong> 2002 to 7% <strong>in</strong> 2003.<br />
Investment outlays were allocated ma<strong>in</strong>ly for modernisation processes, adaptation<br />
to sanitary <strong>and</strong> veter<strong>in</strong>ary as well as quality requirements <strong>and</strong> environmental<br />
protection.<br />
Economic situation of the <strong>food</strong> <strong>in</strong>dustry<br />
In 2003 the performance of <strong>food</strong> <strong>in</strong>dustry deteriorated, though it cont<strong>in</strong>ued to<br />
operate at a profit. Losses were <strong>in</strong>curred by the public sector, where the cost level<br />
<strong>in</strong>dex was 103.8% aga<strong>in</strong>st 97.3% <strong>in</strong> the private sector. The performance of <strong>food</strong> <strong>and</strong><br />
beverage <strong>in</strong>dustry is much better than that of the tobacco <strong>in</strong>dustry.<br />
Table 10. Costs <strong>and</strong> profitability of <strong>food</strong> <strong>in</strong>dustry <strong>in</strong> enterprises employ<strong>in</strong>g 50 persons <strong>and</strong> more<br />
<strong>in</strong> 2002-2003<br />
Cost Profitability*<br />
Specification<br />
level <strong>in</strong>dex Gross net<br />
2002 2003 2002 2003 2002 2003<br />
Total <strong>food</strong> <strong>in</strong>dustry<br />
<strong>in</strong>clud<strong>in</strong>g:<br />
97,3 97,7 2,8 2,3 1,8 1,4<br />
- public sector 100,2 103,8 0 -3,1 -0,8 -3,9<br />
- private sector 97,0 97,3 3,1 2,7 2,1 1,8<br />
Production of <strong>food</strong>stuffs <strong>and</strong> beverages,<br />
<strong>in</strong>clud<strong>in</strong>g:<br />
97,0 97,6 3,1 2,5 2,0 1,5<br />
- public sector 100,3 103,9 0 -3,2 -0,8 -4,0<br />
- private sector 96,6 97,0 3,4 3,0 2,3 1,9<br />
Manufacture of tobacco products<br />
<strong>in</strong>clud<strong>in</strong>g:<br />
99,2 99,1 0,8 0,9 0,5 0,7<br />
- public sector 99,4 99,6 0,6 0,4 0,3 0,3<br />
- private sector 99,2 99,0 0,8 0,9 0,5 0,7<br />
* relation of the gross or net f<strong>in</strong>ancial result to revenues from all operations<br />
Source: GUS<br />
Out of 1 526 <strong>food</strong> <strong>in</strong>dustry establishments employ<strong>in</strong>g 50 <strong>and</strong> more persons,<br />
74.2% generated net profit (79.9% <strong>in</strong> 2002). A share of <strong>food</strong> <strong>and</strong> beverage<br />
enterprises operat<strong>in</strong>g at a profit is much bigger <strong>in</strong> the private sector (76.3%) than <strong>in</strong><br />
the public sector (42.2%). As opposed to it, the share of the private sector tobacco<br />
enterprises that generate a net profit is smaller (42.9%).<br />
35
As regards the process<strong>in</strong>g of products of animal orig<strong>in</strong>, <strong>in</strong> 2003 profitability<br />
improved <strong>in</strong> dairy, poultry <strong>and</strong> fish <strong>in</strong>dustries <strong>and</strong> deteriorated <strong>in</strong> the meat<br />
<strong>in</strong>dustry. As for the process<strong>in</strong>g of plant products, f<strong>in</strong>ancial results of<br />
enterprises deteriorated, <strong>in</strong> particular <strong>in</strong> the sugar <strong>in</strong>dustry <strong>in</strong> which losses<br />
exceeded 10%.<br />
Secondary process<strong>in</strong>g (non-alcoholic beverages, bakery goods, spices, dietary<br />
supplements, tea, coffee <strong>and</strong> sugar confectionary <strong>in</strong>dustries) <strong>and</strong> production of<br />
stimulants (spirit, brewery <strong>and</strong> tobacco <strong>in</strong>dustries) make relatively high profits with<br />
the exception of the w<strong>in</strong>ery <strong>in</strong>dustry.<br />
Food <strong>in</strong>dustry output<br />
For many years, meat, dairy product <strong>and</strong> beverage sectors have had the biggest<br />
share <strong>in</strong> the sales pattern of the <strong>food</strong> <strong>in</strong>dustry.<br />
Figure 20. Pattern of product group sales <strong>in</strong> <strong>food</strong> <strong>in</strong>dustry <strong>in</strong> 2000 <strong>and</strong> 2003 (%)<br />
20,9<br />
14,4<br />
Source: GUS<br />
5,9<br />
5,1<br />
3,4<br />
2000<br />
meat products<br />
fish products<br />
fruit <strong>and</strong> vegetable<br />
oils <strong>and</strong> fats<br />
dairy products<br />
15,7<br />
FOOD INDUSTRY<br />
21,5<br />
2,1<br />
8,2<br />
2,8<br />
36<br />
18,5<br />
14,2<br />
6,6<br />
3,1<br />
4,2<br />
2003<br />
15,5<br />
gra<strong>in</strong> mill<strong>in</strong>g products <strong>and</strong> starch<br />
animal feed<strong>in</strong>gstuffs<br />
other <strong>food</strong>stuffs<br />
beverages<br />
tobacco products<br />
23,2<br />
2,6<br />
9,7<br />
2,4
The quantity of goods produced by the <strong>food</strong> <strong>in</strong>dustry is adapted ma<strong>in</strong>ly to<br />
dem<strong>and</strong> on the domestic market <strong>and</strong> export capabilities.<br />
In 2003 the output of meat products, most of dairy products, chocolate <strong>and</strong><br />
chocolate articles, spirit products, feed<strong>in</strong>gstuffs <strong>and</strong> cigarettes <strong>in</strong>creased, whereas<br />
that of sugar, bakery goods <strong>and</strong> vegetable oils decreased.<br />
Consumption of <strong>food</strong>stuffs<br />
FOOD INDUSTRY<br />
Incomes of the population determ<strong>in</strong>e the dem<strong>and</strong> for <strong>food</strong> <strong>and</strong> are a derivative of<br />
the growth <strong>in</strong> GDP, which <strong>in</strong>creased by 3.7% <strong>in</strong> 2003 compared to 2002. The total<br />
<strong>food</strong> consumption rose by 2.5%, the average remuneration <strong>in</strong> the enterprise sector<br />
<strong>in</strong>creased <strong>in</strong> real terms by 2% <strong>and</strong> the average old-age <strong>and</strong> disability pensions from<br />
the non-agricultural social <strong>in</strong>surance system – by 4.1%. The consumption of<br />
particular products fluctuated depend<strong>in</strong>g on their prices. More favourable supply of<br />
products of animal orig<strong>in</strong> impacted the rise <strong>in</strong> the consumption thereof, whereas the<br />
consumption of certa<strong>in</strong> products of plant orig<strong>in</strong> decreased slightly due to the worse<br />
harvest of cereals, rapeseed <strong>and</strong> potatoes. An <strong>in</strong>crease <strong>in</strong> fruit production did not<br />
contribute to a rise <strong>in</strong> the consumption thereof.<br />
Table 11. Annual consumption per capita of staple <strong>food</strong>stuffs <strong>in</strong> 1995-2003<br />
Specification<br />
unit<br />
1995 2000 2001 2002 2003*<br />
Processed cereals kg 120 119 119 120 120<br />
Potatoes kg 138 132 130 131 130<br />
Vegetables kg 120 120 121 111 110<br />
Fruit kg 40,9 51,1 57,1 56,7 54,5<br />
Meat <strong>and</strong> offal kg 63,4 65,4 65,9 69,5 72,4<br />
<strong>in</strong>clud<strong>in</strong>g: total meat kg 59,4 61,4 61,8 65,3 67,7<br />
- pork kg 39,1 38,0 38,2 39,2 41,2<br />
- beef kg 8,7 6,8 5,5 5,2 5,8<br />
- poultry meat kg 10,2 14,1 17,0 19,8 19,7<br />
Edible oils by<br />
kg<br />
marketable weight kg 25,3 28,4 29,5 30,8 29,2<br />
<strong>in</strong>clud<strong>in</strong>g: animal fats kg 7,2 6,6 6,7 6,7 6,9<br />
- vegetable oils kg 14,4 17,6 18,5 19,5 17,6<br />
- butter kg 3,7 4,2 4,3 4,6 4,7<br />
Cow’s milk l 195 191 187 182 181<br />
Hen eggs (units) 154 186 198 211 214<br />
Sugar kg<br />
41,9 41,2 41,2 43,6 40,3<br />
Source: GUS, Statistical Yearbooks; Gulbiecka, prelim<strong>in</strong>ary estimates of the Institute of Food <strong>and</strong> Agriculture Economics, data for 2003<br />
As for the meat pattern consumption <strong>in</strong> 2003, the previous years’ changes<br />
cont<strong>in</strong>ued, i.e. a decl<strong>in</strong>e <strong>in</strong> beef <strong>and</strong> a rise <strong>in</strong> poultry meat consumption.<br />
37
FOOD INDUSTRY<br />
Consumption of various products differs among ma<strong>in</strong> socio-economic groups of<br />
households, though an average energy <strong>and</strong> nutritious value of a daily <strong>food</strong> <strong>in</strong>take<br />
differs <strong>in</strong>significantly. In addition, <strong>food</strong> consumption varies depend<strong>in</strong>g on the family<br />
size, the education level, the place of residence, etc.<br />
There are marked differences <strong>in</strong> the consumption level of staple <strong>food</strong>stuffs<br />
between Pol<strong>and</strong> <strong>and</strong> the UE <strong>and</strong> among particular EU member states. The<br />
consumption of staple <strong>food</strong>stuffs <strong>in</strong> Pol<strong>and</strong>, exclud<strong>in</strong>g fruit, beef, fish <strong>and</strong> milk,<br />
is with<strong>in</strong> the bracket to be found <strong>in</strong> the EU. The consumption of the<br />
aforementioned products is lower, ma<strong>in</strong>ly due to their relatively high prices or<br />
cul<strong>in</strong>ary habits. Moreover, the consumption eggs, vegetable oils <strong>and</strong> animal fats<br />
<strong>and</strong> meat is lower, exclud<strong>in</strong>g pork, the consumption of which is higher. It can be<br />
stated that a cheaper nutrition model is used <strong>in</strong> Pol<strong>and</strong> than on average <strong>in</strong> the EU.<br />
At the same time relatively cheap <strong>food</strong> <strong>in</strong> Pol<strong>and</strong> offsets a difficult <strong>in</strong>come<br />
situation, enabl<strong>in</strong>g the consumption of majority of products at the level close to<br />
that of the EU.<br />
38
Programme PD˚, Try F<strong>in</strong>e Food<br />
FOOD INDUSTRY<br />
On 1 May 2004 the M<strong>in</strong>ister of Agriculture <strong>and</strong> Rural Development took a<br />
decision to embark on a new Programme, PD˚ Try F<strong>in</strong>e Food to replace the hitherto<br />
programme Polish F<strong>in</strong>e Food.<br />
The ma<strong>in</strong> objective of the programme is to <strong>in</strong>form consumers of high<br />
quality <strong>food</strong> products. The programme is voluntary <strong>and</strong> open to each<br />
entrepreneur from the European Union. The PD˚ logo will be assigned only to<br />
those products which comply with the criteria established by the Scientific<br />
Council for Food Product Quality composed of <strong>in</strong>dependent experts. The PD˚<br />
Tr y F<strong>in</strong>e Food logo is to help the consumer to know<strong>in</strong>gly choose the product<br />
suitable for him or her. Simultaneously, the objective of the Community <strong>food</strong><br />
policy is be<strong>in</strong>g pursued, i.e. exp<strong>and</strong><strong>in</strong>g the range of diverse products of high<br />
quality on the Common Market.<br />
The logo’s aim is also to enhance consumer’s confidence <strong>in</strong> the <strong>food</strong> product<br />
through <strong>in</strong>formation on its high <strong>and</strong> stable quality.<br />
It is only <strong>food</strong> producers that have a right to submit applications for PD˚ Try<br />
F<strong>in</strong>e Food logo <strong>and</strong> the application is free of charge.<br />
POZNAJ DOBRA ZYWNOSC<br />
The Programme covers the follow<strong>in</strong>g groups of products:<br />
1) meat <strong>and</strong> meat products<br />
2) eggs <strong>and</strong> egg products<br />
3) milk <strong>and</strong> milk products<br />
4) fruit <strong>and</strong> vegetables (<strong>in</strong>clud<strong>in</strong>g potatoes), mushrooms <strong>and</strong> preparations<br />
thereof,<br />
39
FOOD INDUSTRY<br />
5) cereals <strong>and</strong> preparations thereof, <strong>in</strong>clud<strong>in</strong>g bakery goods<br />
6) fish, sea<strong>food</strong> <strong>and</strong> preparations thereof<br />
7) non-alcoholic beverages<br />
8) m<strong>in</strong>eral waters<br />
9) honey<br />
10) sugar confectionary <strong>and</strong> cakes<br />
11) herbs <strong>and</strong> spices<br />
12) consumer fats <strong>and</strong> oils<br />
13) mixed <strong>and</strong> highly processed products based on the above mentioned raw<br />
materials<br />
The products that are awarded the PD˚ Try F<strong>in</strong>e Food logo are <strong>in</strong>spected by the<br />
Scientific Committee for Food Product Quality through numerous <strong>in</strong>dependent<br />
control bodies.<br />
In order to ma<strong>in</strong>ta<strong>in</strong> the <strong>in</strong>variably high quality of the products with the logo <strong>and</strong><br />
reliability of the orig<strong>in</strong> of raw materials, the Programme envisages the maximum<br />
periods of the logo validity:<br />
- up to three years, when awarded for the first time,<br />
- up to five years, if cont<strong>in</strong>ued.<br />
Prior to the expiry of the logo validity, entrepreneurs can apply for the logo<br />
renewal. Then the products will undergo a renewal procedure as specified by the<br />
Scientific Council for Food Product Quality. Should they fail to comply with the<br />
quality requirements, the logo may be withdrawn by the Scientific Council prior to<br />
the expiry of its validity.<br />
Protection of regional <strong>and</strong> traditional <strong>food</strong><br />
The idea of protection <strong>and</strong> promotion of regional products is to save<br />
disappear<strong>in</strong>g traditions typical of the culture of a given region or country.<br />
In 1992 the system of registration <strong>and</strong> protection of regional <strong>and</strong> traditional<br />
product designations was set up. The product whose orig<strong>in</strong> is guaranteed by the EU<br />
promotes the image of the place it comes from, thereby <strong>in</strong>vit<strong>in</strong>g consumers to visit<br />
the region.<br />
Assign<strong>in</strong>g designations confirm<strong>in</strong>g high quality of agri-<strong>food</strong> products orig<strong>in</strong>at<strong>in</strong>g<br />
<strong>in</strong> particular regions <strong>and</strong> those produced us<strong>in</strong>g traditional methods is one of the key<br />
ways of pursu<strong>in</strong>g quality policy <strong>in</strong> the EU. The designation is to confirm the<br />
authenticity of a given product <strong>and</strong> to guarantee its quality as well. Thanks to its l<strong>in</strong>k<br />
with the region, the purchase of the product means the beg<strong>in</strong>n<strong>in</strong>g of the contact with<br />
the exceptional culture, tradition <strong>and</strong> history of a given area.<br />
To protect Europe’s cul<strong>in</strong>ary heritage, a special legal system was established<br />
to guarantee the compliance with the declared method of manufactur<strong>in</strong>g<br />
traditional products. To this end, legal <strong>in</strong>struments, i.e. three types of<br />
designations, were created to confirm a traditional or regional character of the<br />
product.<br />
Geographical <strong>in</strong>dications, designations of orig<strong>in</strong> <strong>and</strong> Traditional Speciality<br />
40
FOOD INDUSTRY<br />
Guaranteed certificates are prestigious marks recognised by consumers <strong>in</strong> the EU,<br />
strongly <strong>in</strong>fluenc<strong>in</strong>g the dem<strong>and</strong> side.<br />
Protected Designation of Orig<strong>in</strong> (PDO) means the name of a region or a<br />
specific place or, <strong>in</strong> exceptional cases, of the country used to describe an agricultural<br />
or <strong>food</strong> product orig<strong>in</strong>at<strong>in</strong>g <strong>in</strong> that region, specific place or country.<br />
Protected Geographical Indications (PGI) means the name of a region or a<br />
specific place or, <strong>in</strong> exceptional cases, of the country used to describe an agricultural<br />
or <strong>food</strong> product orig<strong>in</strong>at<strong>in</strong>g <strong>in</strong> that region, specific place or country. The product is<br />
characterised by special quality, reputation or other properties attributable to its<br />
geographical orig<strong>in</strong>.<br />
The essential difference between the protected designation of orig<strong>in</strong> <strong>and</strong> the<br />
protected geographical <strong>in</strong>dication lies <strong>in</strong> the strength of the product l<strong>in</strong>k with the<br />
place of its orig<strong>in</strong>. Protected designations of orig<strong>in</strong> are used to mark products very<br />
closely l<strong>in</strong>ked with a given geographical area. If a protected designation of orig<strong>in</strong> is<br />
used, both the production of raw materials <strong>and</strong> the process<strong>in</strong>g until the f<strong>in</strong>al product<br />
must take place <strong>in</strong> a given (def<strong>in</strong>ed) area. In the case of the protected geographical<br />
<strong>in</strong>dication the product must be produced <strong>in</strong> the region specified <strong>in</strong> its <strong>in</strong>dication,<br />
however, as dist<strong>in</strong>ct from the protected designation of orig<strong>in</strong>, only one of the three<br />
production stages (production or process<strong>in</strong>g or preparation) must take place <strong>in</strong> a<br />
given area.<br />
The follow<strong>in</strong>g products are covered by protected designations of orig<strong>in</strong> <strong>and</strong><br />
geographical <strong>in</strong>dications: fresh meat, meat products (salted, smoked, cooked, etc.),<br />
cheeses, other products of animal orig<strong>in</strong> (eggs, honey, milk products not conta<strong>in</strong><strong>in</strong>g<br />
butter), oils <strong>and</strong> fats (butter, margar<strong>in</strong>e, oil, etc.); fruit, vegetables, cereals (whether<br />
processed or not), fresh fish, molluscs, crustaceans <strong>and</strong> other products based on<br />
fish, sugar confectionery, bread, cakes, cookies, biscuits <strong>and</strong> other bakery articles,<br />
beer, beverages from plant extracts, other <strong>food</strong> products <strong>and</strong> beverages.<br />
In addition, the follow<strong>in</strong>g <strong>food</strong>stuffs are covered by protection: beer, beverages<br />
made from plant extracts, bread, cakes, cookies, biscuits <strong>and</strong> other sugar<br />
confectionery, natural gums <strong>and</strong> res<strong>in</strong>s, hay <strong>and</strong> volatile oils.<br />
As regards w<strong>in</strong>es <strong>and</strong> sprit dr<strong>in</strong>ks, they are not covered by protection.<br />
Traditional Speciality Guaranteed certificate (TSG) means recognition by<br />
the Community of a special (traditional character) of the product designation<br />
through its registration.<br />
The European Commission keeps the Register of Traditional Speciality<br />
Guaranteed Certificates for Agricultural <strong>and</strong> Food Products conta<strong>in</strong><strong>in</strong>g designations<br />
of agricultural <strong>and</strong> <strong>food</strong> products whose special character was recognised at the<br />
Community level.<br />
What is meant by “special character” are properties or a set of properties which<br />
make the agricultural or <strong>food</strong> product clearly dist<strong>in</strong>ct from other similar agricultural<br />
or <strong>food</strong> products of the same category.<br />
41
FOOD INDUSTRY<br />
Graphic symbols confirm<strong>in</strong>g a special character of the product:<br />
Protected Designation of Orig<strong>in</strong><br />
Protected Geographical Indication<br />
Traditional Speciality Guaranteed<br />
To obta<strong>in</strong> one of the aforementioned designations creates an opportunity for its<br />
recipients – producers as their products acquire prestige. Consequently the dem<strong>and</strong><br />
<strong>and</strong> production of such protected articles <strong>in</strong>creases.<br />
The products protected as described above guarantee the purchaser permanent<br />
high quality <strong>and</strong> preservation of centuries old recipes used dur<strong>in</strong>g their<br />
manufacture. So far approximately 650 products with such designations have been<br />
registered.<br />
Given a wealth <strong>and</strong> variety of Polish culture, a great <strong>in</strong>terest <strong>in</strong> this subject<br />
should be expected. Producers associated <strong>in</strong> groups will aim at preserv<strong>in</strong>g the<br />
tradition of manufactur<strong>in</strong>g products typical of their geographical areas such as<br />
mounta<strong>in</strong>s or ethnically different regions (Silesia, Podhale, Kaszuby), where folk <strong>and</strong><br />
cul<strong>in</strong>ary traditions have been ma<strong>in</strong>ta<strong>in</strong>ed for centuries. Confirmation of the product<br />
traditional or regional character by mark<strong>in</strong>g it with one of the three <strong>in</strong>dications will<br />
contribute to <strong>in</strong>creased dem<strong>and</strong> for such product <strong>and</strong> encourage <strong>in</strong>terest <strong>in</strong> the very<br />
idea of such product protection.<br />
For detailed <strong>in</strong>formation, see website www.m<strong>in</strong>rol.gov.pl.<br />
42
General Information on Fisheries<br />
FISHERIES<br />
Fisheries <strong>in</strong> Pol<strong>and</strong> cover the Baltic Sea fisheries, deep sea fish<strong>in</strong>g <strong>and</strong> <strong>in</strong>l<strong>and</strong><br />
fisheries.<br />
The coastl<strong>in</strong>e, <strong>in</strong>clud<strong>in</strong>g the Hel pen<strong>in</strong>sula, the Szczec<strong>in</strong> Bay <strong>and</strong> the Vistula<br />
Bay, is 788 km long. The <strong>in</strong>ternal sea waters occupy 1 991 km 2 , <strong>and</strong> the<br />
territorial sea – 8 682 km 2 . The Baltic Sea coastal zone comprises 36 gm<strong>in</strong>as <strong>in</strong><br />
18 poviats <strong>in</strong> pomorskie, zachodniopomorskie <strong>and</strong> warmiƒsko-mazurskie<br />
voivodships.<br />
The Baltic Sea sal<strong>in</strong>ity is very low; the further from the Danish Straits, the lower<br />
its average sal<strong>in</strong>ity. Most of Polish rivers are situated <strong>in</strong> the Baltic Sea bas<strong>in</strong>. Pol<strong>and</strong>’s<br />
water system is characterised by a low number of dam reservoirs <strong>and</strong> their small<br />
capacity.<br />
Pol<strong>and</strong> is a country with a relatively large number of lakes; there are more than<br />
7 000 reservoirs of more than 1 ha <strong>and</strong> their total area is over 280 000 ha.<br />
In 2003 supply of fish for human consumption on the domestic market was over<br />
400 000 t, a 4.3% rise compared to 2002, however, a nearly 17% decl<strong>in</strong>e compared<br />
to 2000. For many years Polish sea fish<strong>in</strong>g has shown a downward tendency, which<br />
has been partly offset by import growth. Inl<strong>and</strong> fisheries have rema<strong>in</strong>ed at a stable<br />
level.<br />
Table 12. Fish balance <strong>in</strong> Pol<strong>and</strong>, by live weight (‘000 t), <strong>in</strong> 1995-2003<br />
Specification<br />
1995 2000 2001 2002 2003<br />
Sea catches 405,2 220,5 230,7 204,4 160,3 39,6 72,7 78,4<br />
<strong>in</strong>clud<strong>in</strong>g: Baltic Sea 129,6 141,1 156,6 146,9 142,7 110,1 101,1 97,1<br />
- deep sea<br />
- buy<strong>in</strong>g <strong>in</strong> of fish <strong>in</strong> deep sea<br />
275,6 59,0 50,8 57,5 17,6 6,4 29,8 30,6<br />
- fish<strong>in</strong>g grounds - 20,4 23,3 - - . . .<br />
Inl<strong>and</strong> fisheries <strong>and</strong> acquaculture catches 45,0 55,0 54,0 52,0 54,0 120,0 98,2 103,8<br />
Imports 316,1 456,2 441,0 374,1 424,5 134,4 93,1 112,5<br />
Exports<br />
<strong>in</strong>clud<strong>in</strong>g export<br />
327,6 249,8 246,8 246,1 238,0 72,6 95,3 96,7<br />
- from vessels 196,8 86,7 80,6 88,2 66,3 336,9 76,5 75,2<br />
- from l<strong>and</strong><br />
Supply of fish for human<br />
130,8 163,1 166,2 157,9 171,7 131,3 105,3 108,7<br />
consumption on the domestic market 438,7 481,9 478,9 384,4 400,8 91,4 83,2 104,3<br />
Source: Institute of Agriculture <strong>and</strong> Food Economics (IERiG˚) based on the Mar<strong>in</strong>e Fishery Institute (MIR) <strong>and</strong> Inl<strong>and</strong> Fisheries Institute (IRÂ) data.<br />
Fish consumption <strong>in</strong> Pol<strong>and</strong> is rather low. In 2003 it was equal to 10.5 kg per<br />
capita <strong>and</strong> was on average by 56.1% lower than that <strong>in</strong> the EU-15 on average<br />
(rang<strong>in</strong>g from 11 kg <strong>in</strong> Austria to 60 kg <strong>in</strong> Portugal on average <strong>in</strong> 1997-1999) <strong>and</strong> by<br />
35.2% lower than on average <strong>in</strong> the world.<br />
43<br />
1995=100<br />
2003<br />
2000=100 2002=100
In new EU member states that jo<strong>in</strong>ed the EU together with Pol<strong>and</strong> fish<br />
consumption ranges from 3.8 kg <strong>in</strong> Hungary to 30.1 <strong>in</strong> Malta.<br />
Sea fish<strong>in</strong>g<br />
FISHERIES<br />
The collapse of sea fish<strong>in</strong>g is related to an almost total elim<strong>in</strong>ation of the stateowned<br />
deep sea fish<strong>in</strong>g fleet, reduced <strong>in</strong> the 1990s from 86 vessels to 5 trawlers at<br />
end-2002 <strong>and</strong> 4 trawlers at end-2003, owned by PPPiH “Dolmar” S.A., of which 3<br />
were chartered by foreign entities <strong>and</strong> are not engaged <strong>in</strong> fish<strong>in</strong>g for Pol<strong>and</strong>. The<br />
collapse of the Polish deep sea fish<strong>in</strong>g was connected with the worldwide process of<br />
fish<strong>in</strong>g grounds appropriation by coastal countries tak<strong>in</strong>g place from 1970s, which<br />
was legally sanctioned by the Law of the Sea Convention <strong>in</strong> 1982.<br />
44
Follow<strong>in</strong>g 1990, the pattern of mar<strong>in</strong>e fish catches changed. Even <strong>in</strong> 1995 cod<br />
was dom<strong>in</strong>at<strong>in</strong>g, whereas at present it is sprat.<br />
Figure 21. Pattern of mar<strong>in</strong>e fish catches by major fish species (%)<br />
11,3<br />
Total fish (’000 t)<br />
1995 – 405.2<br />
2000 – 200.1<br />
2003 – 160.3<br />
11,4<br />
7,3<br />
In 2003 Baltic Sea catches accounted for 89% of total catches as compared to<br />
32% <strong>in</strong> 1995. The maximum Baltic Sea catches are dependent on the size of annual<br />
fish<strong>in</strong>g quotas determ<strong>in</strong>ed by the International Baltic Sea Fishery Commission for<br />
four fish species: sprat, herr<strong>in</strong>g, cod <strong>and</strong> salmon.<br />
Inl<strong>and</strong> fisheries<br />
1995<br />
Source: M<strong>in</strong>istry of Agriculture <strong>and</strong> Rural Development<br />
FISHERIES<br />
70<br />
Production of <strong>in</strong>l<strong>and</strong> fisheries covers:<br />
- rear<strong>in</strong>g <strong>and</strong> breed<strong>in</strong>g carp <strong>and</strong> trout,<br />
- professional lake <strong>and</strong> river fish<strong>in</strong>g,<br />
- amateur fish<strong>in</strong>g <strong>in</strong> <strong>in</strong>l<strong>and</strong> waters (angl<strong>in</strong>g).<br />
Accord<strong>in</strong>g to the General Agricultural Census data, over 10 000 agricultural<br />
hold<strong>in</strong>gs were <strong>in</strong>volved <strong>in</strong> fish production <strong>in</strong> 2002, i.e. by 25% fewer than <strong>in</strong> 1996. In<br />
accordance with the Inl<strong>and</strong> Fisheries Institute <strong>in</strong>formation for 2003:<br />
- there were ca 150 commercial carp production facilities<br />
- there were ca 600 farms utilis<strong>in</strong>g lakes for fish<strong>in</strong>g purposes<br />
- there were ca 300 large carp production facilities.<br />
In 2003, about 1 million people were engaged <strong>in</strong> angl<strong>in</strong>g <strong>and</strong> 1 500 companies<br />
provided services for angl<strong>in</strong>g.<br />
45<br />
42,1<br />
16,5<br />
17,5<br />
52,5<br />
2000<br />
2003<br />
cod herr<strong>in</strong>g sprat other<br />
10,8<br />
29,1<br />
12,3<br />
19,2
The total area of <strong>in</strong>l<strong>and</strong> waters is 566 000 ha, of which 85% is utilised for fish<strong>in</strong>g<br />
purposes.<br />
Source: Institute of Agriculture <strong>and</strong> Food Economics (IERiG˚), A. Wo∏os, PZW, ANR, GUS data<br />
Carp <strong>and</strong> trout are dom<strong>in</strong>ant species <strong>in</strong> <strong>in</strong>l<strong>and</strong> fisheries production; they account at<br />
present for 60% of the total <strong>in</strong>l<strong>and</strong> fisheries production, whereas angl<strong>in</strong>g – for 26.5%.<br />
Acquaculture <strong>in</strong> Pol<strong>and</strong> (ma<strong>in</strong>ly carp ponds <strong>and</strong> trout production centres) differs<br />
significantly from that <strong>in</strong> the EU where mar<strong>in</strong>e aquaculture dom<strong>in</strong>ates <strong>and</strong> <strong>in</strong>l<strong>and</strong><br />
waters acquaculture covers ma<strong>in</strong>ly trout production.<br />
Pol<strong>and</strong> is one of the largest carp producers <strong>in</strong> Europe (a 15% share) <strong>and</strong> carp<br />
output is by ca 5 000 t greater than that of the whole EU-15.<br />
Table 14. Sales of freshwater fish <strong>in</strong> 1995-2003 (‘000 t)<br />
Source: IERiG˚ based on IRÂ data<br />
Fish process<strong>in</strong>g<br />
FISHERIES<br />
Table 13. Area of waters utilised for fish<strong>in</strong>g purposes <strong>in</strong> 2003 (‘000 ha)<br />
Specification<br />
Total Pol<strong>and</strong><br />
<strong>in</strong>clud<strong>in</strong>g:<br />
owned by the Agricultural utilised by the Polish<br />
Inl<strong>and</strong> waters suitable<br />
Property Agency Angl<strong>in</strong>g Union<br />
for fish<strong>in</strong>g 566 317,3 214,6<br />
of which those utilised for fish<strong>in</strong>g 480 299,7 214,6<br />
Rivers 140 - 89,1<br />
of which those situated <strong>in</strong> the mounta<strong>in</strong>s 26 - 16,5<br />
Lakes 280 270,2 69,6<br />
Dammed reservoirs 50 - 46,9<br />
Ponds<br />
Other waters (clay-pits,<br />
56 47,1 -<br />
old river-beds, small waters) 40 - 9,1<br />
Specification 1995 2000 2003<br />
Total sales 28,19 37,98 35,48 125,9 93,4<br />
<strong>in</strong>clud<strong>in</strong>g: carp 19,60 23,50 21,40 109,2 91,1<br />
of which: export 0,52 0,24 0,25 48,1 104,2<br />
Trout 4,99 11,45 11,00 220,4 96,1<br />
of which: export 1,18 1,98 3,15 266,9 159,1<br />
Follow<strong>in</strong>g 1990 a rapid growth <strong>in</strong> the number of private fish process<strong>in</strong>g<br />
establishments was observed. In mid-1990s the largest number thereof was recorded,<br />
i.e. ca 400 establishments, however s<strong>in</strong>ce then it has fallen down to reach 313 at end-<br />
2003. Employment <strong>in</strong> these establishments was reduced from 16 000 to 12 500 people.<br />
46<br />
2003<br />
1995=100 2000=100
FISHERIES<br />
As <strong>in</strong> the agri-<strong>food</strong> process<strong>in</strong>g sector, fish process<strong>in</strong>g establishments embarked<br />
on numerous <strong>in</strong>vestment projects with the view to harmonisation with EU sanitary<br />
<strong>and</strong> veter<strong>in</strong>ary requirements.<br />
In 2003 the fish process<strong>in</strong>g <strong>in</strong>dustry output was 260 500 t valued at PLN 2 350 million,<br />
i.e. by 3.9% more <strong>in</strong> terms of tonnage <strong>and</strong> by 3.4% less <strong>in</strong> terms of value than <strong>in</strong> 2000.<br />
Figure 22. Pattern of processed fish production <strong>in</strong> 2000 <strong>and</strong> 2003 (%)<br />
22<br />
22,4<br />
5,7<br />
2000<br />
Source: Mar<strong>in</strong>e Fishery Institute (MIR)<br />
9,3<br />
13,6<br />
Fresh <strong>and</strong> frozen fish<br />
Fresh <strong>and</strong> frozen fillets<br />
Salted fish<br />
Smoked fish<br />
21,1<br />
Fishery policy <strong>and</strong> fish market regulations<br />
5,9<br />
The Total Allowable Catch for Pol<strong>and</strong> (as determ<strong>in</strong>ed by the International Baltic<br />
Sea Fishery Commission) is distributed among particular vessels or groups of<br />
vessels <strong>in</strong> conformity with the M<strong>in</strong>ister’s of Agriculture <strong>and</strong> Rural Development<br />
Regulation.<br />
In April 2003 the Regulation of the M<strong>in</strong>istry of Agriculture <strong>and</strong> Rural Development<br />
(MARD) lay<strong>in</strong>g down the maximum number of vessels authorised to fish <strong>in</strong> the Polish<br />
area of the territorial sea <strong>and</strong> the Polish economic zone took effect. The total number<br />
of fish<strong>in</strong>g vessels authorised to fish <strong>in</strong> the Polish sea area was established at 994 (by 14<br />
fewer than <strong>in</strong> the previous year), <strong>in</strong>clud<strong>in</strong>g 8 vessels of a length above 30 m <strong>and</strong> power<br />
of 611 kW (fish<strong>in</strong>g trawlers), 408 vessels of a length from 15 metres to 30 metres<br />
(cutters) <strong>and</strong> 578 vessels of a length up to 15 m (fish<strong>in</strong>g boats).<br />
In 2003 the m<strong>in</strong>imum size of cod under protection was <strong>in</strong>creased from 35 cm to<br />
38 cm.<br />
Accord<strong>in</strong>g to the Sectoral Operational Programme Fisheries <strong>and</strong> Fish<br />
Process<strong>in</strong>g, adopted by the government, it is planned to allocate Euro 330 million<br />
(250 million from public funds <strong>and</strong> 80 million Euro as private <strong>in</strong>vestors’ cof<strong>in</strong>anc<strong>in</strong>g)<br />
for <strong>in</strong>vestment <strong>in</strong> the fish sector. The funds will be ma<strong>in</strong>ly spent on<br />
alleviat<strong>in</strong>g the consequences of vessel scrapp<strong>in</strong>g due to the planned reduction <strong>in</strong> the<br />
47<br />
19,8<br />
22,9<br />
6,5<br />
2003<br />
7,3<br />
Canned <strong>and</strong> preserved fish<br />
Pickled fish<br />
Other products<br />
18,2<br />
6<br />
19,3
FISHERIES<br />
fish<strong>in</strong>g capacity by 30%-40% (around 200 vessels). The <strong>in</strong>vestment will be ma<strong>in</strong>ly<br />
aimed at modernisation of fish<strong>in</strong>g vessels, <strong>in</strong>clud<strong>in</strong>g improvement of safety <strong>in</strong><br />
fish<strong>in</strong>g vessels <strong>and</strong> the sanitary situation as well as protection <strong>and</strong> development of<br />
water resources, construction of harbour <strong>in</strong>frastructure <strong>and</strong> support for the state-ofthe-art<br />
fish market.<br />
Fisheries <strong>in</strong> Pol<strong>and</strong> comply with EU legislation. Most of the harmonisation<br />
provisions were <strong>in</strong>troduced based on the Law of 6 September 2001 on sea fish<strong>in</strong>g.<br />
Furthermore, legal framework for the organisation of the fish market <strong>in</strong><br />
conformity with EU regulations was provided <strong>in</strong> the Law of 10 October 2002 on<br />
organisation of the market <strong>in</strong> fish <strong>and</strong> amend<strong>in</strong>g the Law on sea fish<strong>in</strong>g, replaced<br />
subsequently by the Law on organisation of the market <strong>in</strong> fish <strong>and</strong> f<strong>in</strong>ancial aid for<br />
fisheries of 22 January 2004.<br />
These laws along with the regulations <strong>in</strong>troduced provisions on market<br />
st<strong>and</strong>ards, keep<strong>in</strong>g the register of operators buy<strong>in</strong>g <strong>in</strong> fishery products, issu<strong>in</strong>g by<br />
such operators the sales document upon plac<strong>in</strong>g fishery products on the market <strong>and</strong><br />
receipt declarations upon storage thereof. The legislation <strong>in</strong> question lays down the<br />
rules for the sett<strong>in</strong>g up <strong>and</strong> function<strong>in</strong>g of fish producer organisations as well as<br />
<strong>in</strong>ter-branch organisations <strong>and</strong> types of <strong>in</strong>tervention measures taken by producer<br />
organisations on the fish market <strong>and</strong> rules for grant<strong>in</strong>g state aid to such<br />
organisations.<br />
48
General <strong>in</strong>formation on trade <strong>in</strong> agri-<strong>food</strong> products<br />
2003 saw for the first time <strong>in</strong> 10 years a surplus <strong>in</strong> foreign trade <strong>in</strong> agri-<strong>food</strong><br />
products. The positive trade balance was observed <strong>in</strong> the case of all Pol<strong>and</strong>’s major<br />
trad<strong>in</strong>g partners thanks to a much more rapid growth <strong>in</strong> Polish exports than<br />
imports.<br />
The value of exports grew by 37.6% <strong>and</strong> that of imports by 12.2%. In<br />
consequence the trade balance was positive, amount<strong>in</strong>g to USD 506 million.<br />
Aga<strong>in</strong>st Pol<strong>and</strong>’s total foreign trade, <strong>in</strong> which a significant growth was<br />
observed, agri-<strong>food</strong> products obta<strong>in</strong>ed better results. In 2003 the total export<br />
was valued at USD 53.6 billion (an <strong>in</strong>crease by almost one third compared<br />
to 2002), import at USD 68.0 billion (an <strong>in</strong>crease by nearly one fourth) <strong>and</strong><br />
the negative trade balance was equal to USD 14.4 billion aga<strong>in</strong>st USD 14.1<br />
billion <strong>in</strong> 2002.<br />
Figure 23. Results of foreign trade <strong>in</strong> agri-<strong>food</strong> products aga<strong>in</strong>st total products <strong>in</strong> 2000 – 2003<br />
(million USD)<br />
5000<br />
4000<br />
3000<br />
2000<br />
1000<br />
Table 15. Share of agri-<strong>food</strong> products <strong>in</strong> total foreign trade (%)<br />
Source: CIHZ<br />
0<br />
-1000<br />
FOREIGN TRADE IN AGRI-FOOD PRODUCTS<br />
2650<br />
3183<br />
-533<br />
Source: CIHZ (Foreign Trade IT Centre)<br />
3030<br />
3406<br />
-376<br />
49<br />
3285 3576<br />
-291<br />
4519<br />
4013<br />
2000 2001 2002 2003<br />
Export Import Balance<br />
Specification 2000 2001 2002 2003<br />
% share of agri-<strong>food</strong> products <strong>in</strong>:<br />
- total exports 8,4 8,4 8,0 8,4<br />
- total import 6,5 6,8 6,5 5,9<br />
506
Geographical pattern of trade <strong>in</strong> agri-<strong>food</strong> products<br />
Pol<strong>and</strong>’s major trad<strong>in</strong>g partner with respect to trade <strong>in</strong> agri-<strong>food</strong> products is the<br />
European Union with which trade has been systematically exp<strong>and</strong><strong>in</strong>g. In 2003, the<br />
share of the EU <strong>in</strong> both exports <strong>and</strong> imports was over 50%.<br />
Table 16. Foreign trade <strong>in</strong> agri-<strong>food</strong> products, by groups of countries, <strong>in</strong> 2000-2003 (USD million)<br />
Source: CIHZ<br />
FOREIGN TRADE IN AGRI-FOOD PRODUCTS<br />
Specification<br />
2000<br />
Export<br />
2001 2002 2003 2000<br />
Import<br />
2001 2002 2003 2000<br />
Balance<br />
2001 2002 2003<br />
Total 2650 3030 3285 4519 3183 3406 3576 4013 -533 -376 -291 506<br />
EU 1287 1456 1605 2309 1622 1790 1903 2090 -335 -334 -298 218<br />
Former Soviet Union States 602 608 648 890 106 113 97 114 496 495 551 776<br />
CEFTA 316 353 399 544 352 325 345 400 -37 28 54 144<br />
EFTA 30 40 37 58 140 174 148 170 -110 -134 -111 -112<br />
USA 107 116 150 170 74 81 99 92 34 35 51 79<br />
Other 308 457 446 548 888 923 983 1148 -581 -466 -538 -600<br />
Figure 24. Geographical pattern of trade <strong>in</strong> agri-<strong>food</strong> products <strong>in</strong> 2000 <strong>and</strong> 2003 (%)<br />
1,1<br />
11,9<br />
4,1<br />
2,3<br />
4,4<br />
27,9<br />
Source: CIHZ<br />
22,7<br />
11,1<br />
11,6<br />
3,3<br />
2000<br />
2000<br />
EU<br />
Former Soviet Union States<br />
48,6<br />
51<br />
Export<br />
Import<br />
CEFTA<br />
EFTA<br />
50<br />
1,3<br />
12<br />
3,8<br />
2,3<br />
4,2<br />
28,6<br />
19,7<br />
10<br />
12,1<br />
2,8<br />
2003<br />
2003<br />
USA<br />
Other<br />
51,1<br />
52,1
Among the European Union member states, Pol<strong>and</strong>’s major trad<strong>in</strong>g partner as<br />
regards agri-<strong>food</strong> products is Germany. In 2003 this country had a 38% share <strong>in</strong><br />
Pol<strong>and</strong>’s agri-<strong>food</strong> trade with the EU as compared to 36% <strong>in</strong> 2002. As <strong>in</strong> the previous<br />
years, the second largest trad<strong>in</strong>g partner from the EU was the Netherl<strong>and</strong>s with a<br />
share of 15%, then Italy – 9%, Spa<strong>in</strong> – 8% <strong>and</strong> France – 7%.<br />
With the total positive trade balance with the EU, the negative trade balance was<br />
noted for Spa<strong>in</strong>, the Netherl<strong>and</strong>s, Greece, France, Belgium, Denmark, Irel<strong>and</strong> <strong>and</strong><br />
Italy.<br />
As for other EU member states, the trade balance was positive, <strong>in</strong> particular with<br />
Germany <strong>and</strong> the UK.<br />
In 2003 trade <strong>in</strong> agri-<strong>food</strong> products showed favourable tendencies not only with<br />
the EU-15 but also new EU member states.<br />
Table 17. Trade <strong>in</strong> agri-<strong>food</strong> products with the EU-15 <strong>and</strong> new EU member states (USD million)<br />
Source: IERiG˚ based on CIHZ data<br />
FOREIGN TRADE IN AGRI-FOOD PRODUCTS<br />
Specification<br />
European Union – 25<br />
1995 2000 2002 2003<br />
1995=100<br />
2003<br />
2000=100 2002=100<br />
Export 1464,3 1663,5 2101,3 2959,2 202,1 177,9 140,8<br />
Import 1646,8 1957,7 2222,3 2460,6 149,4 125,7 110,7<br />
Balance<br />
European Union – 15<br />
-182,5 -294,1 -121,0 498,5 x x x<br />
Export 1335,7 1286,9 1605,0 2308,7 172,8 179,4 143,8<br />
Import 1403,6 1622,2 1902,9 2090,4 148,9 128,9 109,9<br />
Balance<br />
European Union – 9<br />
-67,9 -335,3 -297,9 218,3 x x x<br />
Export 128,6 376,6 496,3 650,4 505,8 172,7 131,0<br />
Import 243,2 335,5 319,4 370,2 152,2 110,3 115,9<br />
Balance -114,6 41,2 176,9 280,2 x x x<br />
Improvement <strong>in</strong> trade balance with EU member states <strong>in</strong>dicates a positive<br />
impact of liberalisation of mutual trade <strong>in</strong> agri-<strong>food</strong> products <strong>and</strong> acceleration of<br />
Polish exporters’ adaptation to new conditions exist<strong>in</strong>g after the entry <strong>in</strong>to force of<br />
the relevant agreement <strong>and</strong> its subsequent amendments as well as to trade with<strong>in</strong><br />
the Common Market.<br />
Similarly, trade agreements concluded with CEFTA member states, some of<br />
which jo<strong>in</strong>ed the EU together with Pol<strong>and</strong>, resulted <strong>in</strong> an <strong>in</strong>crease <strong>in</strong> trade <strong>and</strong> a<br />
positive trade balance for Pol<strong>and</strong>.<br />
As <strong>in</strong> the previous years, <strong>in</strong> 2003 Pol<strong>and</strong>’s major trad<strong>in</strong>g partner among the<br />
former Soviet Union states was Russia with a nearly 40% share <strong>in</strong> trade with these<br />
countries. Pol<strong>and</strong>’s exports dom<strong>in</strong>ate over imports to Russia <strong>and</strong> all former Soviet<br />
Union states.<br />
Overall, exports to these countries were eightfold greater than imports. The<br />
second largest partner is Ukra<strong>in</strong>e (40% share), the third Lithuania (18.2% share).<br />
51
FOREIGN TRADE IN AGRI-FOOD PRODUCTS<br />
For years Pol<strong>and</strong>’s trade balance has been positive with the whole group <strong>and</strong><br />
particular states.<br />
2003 saw a significant growth (36.2%) <strong>in</strong> exports to the CEFTA member states<br />
<strong>and</strong> a twice as low <strong>in</strong>crease <strong>in</strong> imports. Among CEFTA countries, the Czech<br />
Republic is Pol<strong>and</strong>’s major trad<strong>in</strong>g partner with a 40% share of trade with this group<br />
of countries, then Hungary – 26%, Slovakia – 15% <strong>and</strong> Romania – 12%.<br />
With regard to trade with EFTA states, a negative balance of trade <strong>in</strong> agri-<strong>food</strong><br />
products was noted despite a 56% <strong>in</strong>crease <strong>in</strong> exports <strong>and</strong> as low as 14.7% <strong>in</strong>crease<br />
<strong>in</strong> imports. Pol<strong>and</strong>’s exports went ma<strong>in</strong>ly to Norway (a 44% share <strong>in</strong> exports to that<br />
group of countries) <strong>and</strong> Switzerl<strong>and</strong> (52%). As for imports, it was primarily fish<br />
from Norway (a 76% share <strong>in</strong> imports) <strong>and</strong> Icel<strong>and</strong> (13%).<br />
As regards trade <strong>in</strong> agri-<strong>food</strong> products with the United States, it rema<strong>in</strong>ed at a<br />
low level as the US share was barely 3.8% <strong>and</strong> 2.3% <strong>in</strong> Pol<strong>and</strong> exports <strong>and</strong> imports<br />
respectively. Pol<strong>and</strong> exported relatively large quantities of processed meat <strong>and</strong><br />
alcohol <strong>and</strong> imported fish <strong>and</strong> various processed <strong>food</strong> articles.<br />
Among the countries that are not part of any of the groups mentioned above,<br />
major recipients of Polish agri-<strong>food</strong> products <strong>in</strong> 2003 were Algeria, Bosnia<br />
Herzegov<strong>in</strong>a, Brazil <strong>and</strong> Saudi Arabia. In terms of value, exports to these countries<br />
accounted for 32% of the total exports to all other countries. Other countries are<br />
also significant suppliers of agri-<strong>food</strong> products to the Polish market, the leaders<br />
be<strong>in</strong>g Ch<strong>in</strong>a, Argent<strong>in</strong>a <strong>and</strong> the Ivory Coast. In 2003 the share of these countries <strong>in</strong><br />
trade with this group of states was 26% <strong>in</strong> total.<br />
Commodity pattern of agri-<strong>food</strong> trade<br />
In 2003 the commodity pattern of agri-<strong>food</strong> trade did not change significantly. As<br />
compared to 2002 an <strong>in</strong>crease was observed <strong>in</strong> both exports <strong>and</strong> imports of all<br />
commodity groups, exclud<strong>in</strong>g imports of live animals.<br />
As for exports, the biggest rise was noted for processed products of animal orig<strong>in</strong><br />
<strong>and</strong> the smallest for livestock. As regards imports, an over 10% <strong>in</strong>crease was<br />
observed for raw materials of plant orig<strong>in</strong>, processed plants <strong>and</strong> animals <strong>and</strong> fish <strong>and</strong><br />
fish products.<br />
Figure 25. Commodity pattern of agri-<strong>food</strong> trade<br />
6,6<br />
7,1<br />
23,1<br />
Export Import<br />
15,7 11,2<br />
17<br />
3,8<br />
23,6<br />
Plant raw materials<br />
Livestock<br />
Processed products pf plant orig<strong>in</strong><br />
Source: IERiG˚ based on CIHZ<br />
32,5<br />
52<br />
17,5<br />
9,2<br />
Processed products of animal orig<strong>in</strong><br />
Fish <strong>and</strong> fish products<br />
Stimulants <strong>and</strong> beverages<br />
4,5<br />
Other<br />
27,1<br />
1,1
Export<br />
In 2003 exports of processed products of animal orig<strong>in</strong> grew by 53% aga<strong>in</strong>st 2002<br />
up to over USD 1 million, which accounted for almost one fourth of the total value<br />
of Polish agri-<strong>food</strong> exports.<br />
Table 18. Polish exports of animal products <strong>in</strong> 2002-2003<br />
Source: CIHZ<br />
Table 19. Polish exports of raw materials of plant orig<strong>in</strong> <strong>in</strong> 2002-2003<br />
Source: CIHZ<br />
FOREIGN TRADE IN AGRI-FOOD PRODUCTS<br />
2002 2003 % 2002 2003 % Balance<br />
Specification 2002 2003<br />
USD million ’000 t USD million<br />
1. Livestock 138,6 169,8 123 88,0 95,4 108 94,3 126,3<br />
<strong>in</strong>clud<strong>in</strong>g cattle 94,5 107,8 114 67,3 60,2 89 84,1 98,6<br />
2. Meat <strong>and</strong> offal for human<br />
consumption, <strong>in</strong>clud<strong>in</strong>g:<br />
302,2 561,8 186 181,9 391,3 215 204,2 454,7<br />
- Beef 82,8 71,3 86 64,2 44,1 69 82,6 70,6<br />
- Pork 37,7 179,9 477 36,9 199,7 541 -32,6 98,6<br />
- horse meat 25,3 28,8 114 7,9 8,8 111 25,3 28,8<br />
- poultry meat 128,3 243,8 190 51,7 100,7 195 106,4 224,3<br />
3. Dairy products <strong>in</strong>clud<strong>in</strong>g 280,2 358,8 128 227,0 231,3 102 232,9 303,7<br />
- condensed milk <strong>and</strong> cream 131,6 164,3 125 107,3 107,6 100 117,6 150,2<br />
- cheeses <strong>and</strong> cottage cheeses 89,6 132,8 148 41,8 52,0 124 73,2 112,1<br />
- butter 17,4 21,3 122 11,8 9,2 78 10,9 11,0<br />
4. Processed meat 89,1 108,3 122 41,3 34,3 83 79,5 98,6<br />
5. Bird’s eggs 5,7 25,9 454 9,4 27,2 289 0,6 20,5<br />
2002 2003 % 2002 2003 % Balance<br />
Specification 2002 2003<br />
USD million ’000 t USD million<br />
1. Cereals<br />
<strong>in</strong>clud<strong>in</strong>g:<br />
wheat <strong>and</strong> rye <strong>and</strong><br />
65,0 70,3 108 566,7 575,0 101 -49,0 -50,1<br />
wheat mixtures 62,1 67,4 109 549,2 559,8 102 34,4 49,5<br />
2. Oilseeds<br />
<strong>in</strong>clud<strong>in</strong>g:<br />
9,6 3,6 37 37,3 8,9 24 -42,5 -61,1<br />
rapeseed seeds 8,6 1,8 21 36,0 6,4 18 6,1 -4,6<br />
3. Potatoes 4,3 12,5 290 57,5 153,1 266 -8,6 4,9<br />
4. Fresh fruit<br />
<strong>in</strong>clud<strong>in</strong>g:<br />
107,9 151,0 140 428,5 459,7 107 -371,9 -400,9<br />
apples, pears <strong>and</strong> qu<strong>in</strong>ce 53,8 69,8 130 347,3 356,5 103 47,2 60,2<br />
5. Fresh vegetables 120,9 205,2 170 256,5 458,9 179 23,3 105,3<br />
6. Flowers 45,6 64,6 142 44,0 49,2 112 -42,9 -39,5<br />
53
FOREIGN TRADE IN AGRI-FOOD PRODUCTS<br />
Compared to 2002, <strong>in</strong> 2003 exports of raw materials of plant orig<strong>in</strong> grew by<br />
almost 44% up to USD 507 million account<strong>in</strong>g for 11% of Polish agri-<strong>food</strong> exports.<br />
An <strong>in</strong>crease was noted <strong>in</strong> the value of nearly all exported products except for oilseeds<br />
whose sales dropped by almost 2/3 to USD 3.5 million.<br />
As regards fresh fruit exports, traditionally apples <strong>and</strong> berries such as<br />
raspberries, currants, strawberries <strong>and</strong> sour cherries <strong>and</strong> re-export of southern fruit<br />
had the biggest share.<br />
Apples are ma<strong>in</strong>ly exported to the former Soviet Union states, <strong>in</strong> particular to<br />
Russia <strong>and</strong> Belarus. 2003 saw an <strong>in</strong>crease <strong>in</strong> export of apples to the EU, though its<br />
share rema<strong>in</strong>ed at a low level (nearly 5% <strong>in</strong> terms of value <strong>and</strong> 17% <strong>in</strong> terms of<br />
quantity). The <strong>in</strong>crease took place due to worse apple harvest <strong>in</strong> the EU.<br />
Berries are primarily exported to the EU. As much as 89% of raspberries went<br />
to the UE, <strong>in</strong> particular to Germany, France, Denmark <strong>and</strong> the Netherl<strong>and</strong>s.<br />
Among all commodity groups exports of processed products of plant orig<strong>in</strong><br />
acquired the highest value.<br />
54
Table 20. Exports of processed plant products <strong>in</strong> 2002-2003<br />
Source: FAPA based on CIHZ data<br />
As opposed to raw materials of plant orig<strong>in</strong>, characterised by a negative trade balance<br />
at -USD 441 million (-USD 492 million <strong>in</strong> 2002), the trade balance for processed plant<br />
products was positive amount<strong>in</strong>g to USD 382 million (USD 186 million <strong>in</strong> 2002).<br />
With regard to fish exports, fish fillets <strong>and</strong> smoked fish had the biggest share. It<br />
is ma<strong>in</strong>ly sard<strong>in</strong>e, herr<strong>in</strong>g <strong>and</strong> cod which are exported. Of great importance for<br />
Polish trade <strong>in</strong> fish is re-export, <strong>in</strong> particular of shrimps <strong>and</strong> pollock <strong>and</strong> hake fillets.<br />
Most of processed fish is exported to the EU, primarily to Germany, Sweden <strong>and</strong> the<br />
Netherl<strong>and</strong>s.<br />
Stimulants <strong>and</strong> beverages play an important role <strong>in</strong> Polish agri-<strong>food</strong> trade.<br />
Table 21. Polish exports of stimulants <strong>in</strong> 2002-2003<br />
Source: FAPA based on CIHZ data<br />
Import<br />
FOREIGN TRADE IN AGRI-FOOD PRODUCTS<br />
2002 2003 % 2002 2003 % Balance<br />
Specification 2002 2003<br />
USD million ’000 t USD million<br />
1. Vegetable oils <strong>and</strong> fats 17,9 19,0 106 33,5 28,2 84 -175,5 -220,3<br />
2. Gra<strong>in</strong> mill<strong>in</strong>g products 7,9 12,4 157 22,0 23,9 109 -20,7 -22,9<br />
3. Ground gra<strong>in</strong> <strong>and</strong> oil cake 23,5 21,8 93 202,5 157,5 78 -299,7 -335,0<br />
4. Starch, grits, malt 37,4 49,3 132 166,3 183,9 111 -16,4 -13,2<br />
5. White sugar 50,4 98,6 196 207,8 425,6 205 24,2 77,2<br />
6. Molasses 25,2 24,7 98 251,8 292,8 116 25,2 24,7<br />
7. Sugar confectionery 220,0 270,2 123 89,2 102,9 115 93,1 122,9<br />
8. Processed fruit 475,6 631,1 133 552,7 557,3 101 348,4 483,6<br />
9. Processed vegetables 277,9 342,9 123 411,7 493,0 120 207,9 265,2<br />
10. Other processed plant products 365,0 499,8 137 198,8 246,3 124 -11,6 64,8<br />
2002 2003 % 2002 2003 % Balance<br />
Specification 2002 2003<br />
USD million ’000 t USD million<br />
1. Coffee, cocoa, tea 17,6 142,6 121 48,6 52,3 108 -247,8 -339,1<br />
2. Tobacco <strong>and</strong> tobacco products 49,1 83,0 169 11,5 16,1 140 -146,4 15,8<br />
3. Alcohols <strong>and</strong> alcoholic beverages 57,8 68,8 119 42,3 47,1 111 -46,9 -60,8<br />
4. Waters <strong>and</strong> non-alcoholic beverages 21,9 28,1 128 106,1 112,7 106 8,9 5,9<br />
As compared to 2002, <strong>in</strong> 2003 the value of majority of plant product imports grew,<br />
exclud<strong>in</strong>g tobacco <strong>and</strong> cigarettes, potatoes, sugar <strong>and</strong> margar<strong>in</strong>e. In the case of<br />
major products, the biggest <strong>in</strong>crease was observed <strong>in</strong> imports of stimulants, fruit,<br />
processed fruit, sugar confectionery, ornamental plants, oils, ground gra<strong>in</strong> <strong>and</strong> cake<br />
<strong>and</strong> processed cereals.<br />
55
Table 22. Agri-<strong>food</strong> imports <strong>in</strong> 2002 <strong>and</strong> 2003.<br />
Source: FAPA based on CIHZ data<br />
FOREIGN TRADE IN AGRI-FOOD PRODUCTS<br />
Specification<br />
2002 2003<br />
USD million<br />
% 2002 2003<br />
’000 t<br />
%<br />
1. Livestock 44,4 43,5 98 x x x<br />
2. Processed products of animal orig<strong>in</strong><br />
<strong>in</strong>clud<strong>in</strong>g:<br />
166,3 182,6 98 x x x<br />
- red meat 75,2 86,5 115 53,8 57,3 107<br />
- poultry meat 21,9 19,5 89 25,5 20,3 80<br />
- milk, cream, ice-cream 27,4 26,0 95 30,0 20,6 69<br />
3. Fish <strong>and</strong> fish products 321,2 369,1 115 220,3 234,8 107<br />
4. Plant produce<br />
<strong>in</strong>clud<strong>in</strong>g:<br />
844,9 948,5 112 x x x<br />
- Cereals 114,0 120,4 106 617,4 591,9 96<br />
- fresh fruit 479,8 551,8 115 950,6 918,0 97<br />
5. Processed products of plant orig<strong>in</strong><br />
<strong>in</strong>clud<strong>in</strong>g:<br />
- ground gra<strong>in</strong><br />
949,4 1087,8 115 x x x<br />
<strong>and</strong> oil cake 323,2 356,8 110 1572,7 1605,5 102<br />
- sugar confectionery 126,9 147,3 116 69,5 68,0 98<br />
- processed fruit 127,2 147,4 116 137,8 141,8 103<br />
6. Other products<br />
<strong>in</strong>clud<strong>in</strong>g:<br />
760,9 794,8 104 x x x<br />
- coffee, tea, cocoa 365,4 481,8 132 236,5 248,4 105<br />
- tobacco <strong>and</strong> tobacco products<br />
- alcohols <strong>and</strong> alcoholic<br />
195,4 67,2 34 54,4 22,3 41<br />
beverages 104,7 129,6 124 122,9 104,5 85<br />
The share of plant products fell, whereas that of animal <strong>and</strong> “other” products<br />
grew.<br />
A characteristic feature of Polish foreign trade <strong>in</strong> agri-<strong>food</strong> products is a bigger<br />
share of <strong>food</strong> <strong>in</strong>dustry products <strong>in</strong> exports than <strong>in</strong> imports <strong>and</strong> the reverse situation<br />
for agricultural products. In 2003 the share of processed products was 81.4% <strong>in</strong><br />
exports <strong>and</strong> 65.7% <strong>in</strong> imports. In 1990 the situation was different as <strong>food</strong>stuffs<br />
constituted 65% of total agri-<strong>food</strong> exports <strong>and</strong> almost 80% of imports. Thanks to the<br />
development of the Polish agri-<strong>food</strong> <strong>in</strong>dustry, product improvement <strong>and</strong> exquisite<br />
taste, exports of processed products, which are more favourable for the <strong>economy</strong>,<br />
have been systematically ris<strong>in</strong>g.<br />
56
NATIONAL SUPPORT INSTRUMENTS<br />
So far mechanisms regulat<strong>in</strong>g <strong>agriculture</strong> <strong>in</strong> Pol<strong>and</strong> have comb<strong>in</strong>ed market<br />
<strong>in</strong>struments with state <strong>in</strong>tervention.<br />
Aid was provided to <strong>agriculture</strong> primarily through national budget subsidies.<br />
Despite numerous <strong>agriculture</strong> support <strong>in</strong>struments, aid received by Polish<br />
agricultural producers <strong>in</strong> the previous years rema<strong>in</strong>ed at a much lower level than <strong>in</strong><br />
other countries. Accord<strong>in</strong>g to OECD, the Producer Subsidy Equivalent (PSE) for<br />
agricultural producers, show<strong>in</strong>g the percentage share of all forms of subsidies <strong>in</strong> the<br />
f<strong>in</strong>al production value, was one of the lowest <strong>in</strong> the world.<br />
Table 23. Producer Subsidy Equivalent for agricultural producers <strong>in</strong> selected countries <strong>in</strong> 1986-2003 (%)<br />
Source: Agra Europe 2004 No 2109, p. EP/4<br />
AGRICULTURAL POLICY<br />
Specification 1986-88 2001 2002 2003<br />
OECD average 37 31 31 32<br />
EU average 39 34 35 37<br />
USA 25 23 19 18<br />
Hungary 16 22 33 27<br />
Czech Republic 31 23 25 27<br />
Pol<strong>and</strong> 11 15 14 9<br />
State aid was provided ma<strong>in</strong>ly through the follow<strong>in</strong>g <strong>in</strong>struments:<br />
- subsidies to <strong>in</strong>terest on work<strong>in</strong>g capital bank<strong>in</strong>g credit for the purchase of<br />
agricultural <strong>in</strong>puts (fertilisers, plant protection agents, animal feed<strong>in</strong>gstuffs,<br />
fuel, etc.) <strong>and</strong> purchase of seasonal agricultural produce (cereals, potatoes, oil<br />
crops, sugar beets, fruit <strong>and</strong> vegetables, seeds) as well as storage of certa<strong>in</strong><br />
commodities<br />
- subsidies to <strong>in</strong>terest on <strong>in</strong>vestment bank<strong>in</strong>g credit for <strong>agriculture</strong> (<strong>in</strong>clud<strong>in</strong>g<br />
l<strong>and</strong> purchase <strong>and</strong> sett<strong>in</strong>g up agricultural hold<strong>in</strong>gs by young farmers), <strong>food</strong><br />
process<strong>in</strong>g <strong>and</strong> services for <strong>agriculture</strong> <strong>and</strong> for entrepreneurship development<br />
<strong>and</strong> creation of new jobs <strong>in</strong> rural areas<br />
- subsidies to credit to alleviate natural disaster consequences <strong>in</strong> <strong>agriculture</strong><br />
- guarantees <strong>and</strong> endorsements for <strong>in</strong>vestment credit repayment<br />
- subsidies to biological advancement <strong>in</strong> plant <strong>and</strong> animal production<br />
- subsidies to agricultural hold<strong>in</strong>gs <strong>in</strong>volved <strong>in</strong> organic farm<strong>in</strong>g<br />
- subsidies to plant protection, ma<strong>in</strong>tenance of hydromelioration facilities,<br />
control of <strong>in</strong>fectious animal diseases, etc.<br />
- f<strong>in</strong>ancial support for research <strong>and</strong> application the results thereof <strong>in</strong> <strong>agriculture</strong><br />
<strong>and</strong> agri-<strong>food</strong> process<strong>in</strong>g<br />
- subsidies to diesel fuel used <strong>in</strong> agricultural hold<strong>in</strong>gs for the purposes of<br />
agricultural production<br />
- agricultural tax preferences <strong>and</strong> exemptions<br />
57
AGRICULTURAL POLICY<br />
- real estate tax exemptions<br />
- subsidies to afforestation of agricultural l<strong>and</strong> of grade 5 <strong>and</strong> 6<br />
- subsidies to buy<strong>in</strong>g <strong>in</strong> prices of extra grade milk<br />
- subsidies to buy<strong>in</strong>g <strong>in</strong> prices of cereals for human consumption (wheat <strong>and</strong> rye<br />
of appropriate quality parameters)<br />
- subsidies to buy<strong>in</strong>g <strong>in</strong> prices of <strong>in</strong>dustrial tobacco<br />
- subsidies to starch <strong>and</strong> potato starch producers<br />
- f<strong>in</strong>anc<strong>in</strong>g <strong>in</strong>tervention buy<strong>in</strong>g <strong>in</strong> of major agricultural products (cereals, milk<br />
powder, butter, pig half-carcasses, etc.)<br />
- f<strong>in</strong>ancial aid for producer groups<br />
- subsidies to exports of certa<strong>in</strong> agricultural products (pork, milk powder).<br />
F<strong>in</strong>anc<strong>in</strong>g of <strong>agriculture</strong> from the national budget<br />
Every year allocations from the national budget are made for support of<br />
<strong>agriculture</strong>, agricultural markets <strong>and</strong> rural areas development as well as for social<br />
<strong>in</strong>surance.<br />
Table 24. National budget funds allocated for support of <strong>agriculture</strong>, agricultural markets <strong>and</strong> rural areas<br />
development (PLN million, nom<strong>in</strong>al amounts) <strong>in</strong> 2001-2003<br />
Specification 2001 2002 2003<br />
Funds for support of <strong>agriculture</strong>, agricultural markets <strong>and</strong> rural areas development 4005 3886 4321<br />
Funds for subsidies to Farmers’ Social Security Fund (KRUS) 15822 15390 15690<br />
Total 19827 19276 20011<br />
As translated <strong>in</strong>to Euro (at the mid exchange rate announced by the National<br />
Bank of Pol<strong>and</strong>; PLN 366.85 for Euro 100 <strong>in</strong> 2001; PLN 385.57 <strong>and</strong> PLN 439.78 for<br />
Euro 100 <strong>in</strong> 2002 <strong>and</strong> 2003 respectively), aid decreased from Euro 5 405 million to<br />
Euro 4 550 million <strong>in</strong> 2003. The share of expenditure on <strong>agriculture</strong> <strong>in</strong>clud<strong>in</strong>g<br />
KRUS <strong>in</strong> GDP is by 0.47 percentage po<strong>in</strong>ts lower than the <strong>agriculture</strong> contribution<br />
(2.6%) to GDP. In 2003 the share of expenditure on <strong>agriculture</strong> <strong>in</strong> total national<br />
budget expenditures was 2.22% <strong>and</strong> 10.29% <strong>in</strong>clud<strong>in</strong>g KRUS.<br />
Membership of the EU <strong>and</strong> application of the Common Agricultural Policy rules<br />
implies a complete change of scale <strong>and</strong> system of <strong>agriculture</strong> f<strong>in</strong>anc<strong>in</strong>g. The<br />
programmes <strong>and</strong> subsidies f<strong>in</strong>anced hitherto from the national budget will become<br />
of secondary importance or will be ab<strong>and</strong>oned.<br />
Rural Development Programme (RDP)<br />
To implement the Rural Development Programme, the Polish government<br />
contracted a loan from the World Bank totall<strong>in</strong>g Euro 118.8 million. The<br />
58
programme, whose implementation was commenced <strong>in</strong> 2002 <strong>and</strong> the<br />
completion was shifted from 2004 to 2005, is targeted at <strong>in</strong>habitants of villages<br />
<strong>and</strong> small towns.<br />
Actions <strong>and</strong> supportive measures funded from the WB loan <strong>and</strong> co-f<strong>in</strong>anced<br />
from the Polish national budget totall<strong>in</strong>g Euro 300 million comprise the follow<strong>in</strong>g:<br />
- grant<strong>in</strong>g micro-loans to create new jobs<br />
- f<strong>in</strong>anc<strong>in</strong>g programmes of reorientation/<strong>and</strong> retra<strong>in</strong><strong>in</strong>g of the workforce<br />
- f<strong>in</strong>anc<strong>in</strong>g school education <strong>in</strong> rural areas<br />
- co-f<strong>in</strong>anc<strong>in</strong>g construction of rural <strong>in</strong>frastructure<br />
- co-f<strong>in</strong>anc<strong>in</strong>g creation of local <strong>and</strong> regional adm<strong>in</strong>istration<br />
Appropriate m<strong>in</strong>istries <strong>and</strong> local self-governments are engaged <strong>in</strong> the<br />
Programme implementation.<br />
Agricultural Advisory Services<br />
AGRICULTURAL POLICY<br />
State agricultural advisory services f<strong>in</strong>anced from the national budget are an<br />
important element of aid for farmers, by provid<strong>in</strong>g advice to farmers <strong>and</strong> <strong>in</strong>habitants<br />
of rural areas on a wide scale, free of charge. Agricultural Advisory Services played a<br />
particularly important role dur<strong>in</strong>g preparations for the EU membership<br />
referendum, for accession to the EU <strong>and</strong> right after accession. Agricultural advisors<br />
were ma<strong>in</strong> providers of <strong>in</strong>formation on rules applicable to <strong>agriculture</strong> follow<strong>in</strong>g<br />
accession <strong>and</strong> a necessity of comply<strong>in</strong>g with specific sanitary <strong>and</strong> veter<strong>in</strong>ary<br />
requirements <strong>in</strong> agricultural production. Along with pay<strong>in</strong>g agencies’ staff, advisors<br />
helped farmers fill <strong>in</strong> applications for direct payments <strong>and</strong> prepared farmers <strong>and</strong><br />
<strong>in</strong>habitants of rural areas to be able to draw on Structural Funds aid.<br />
In Pol<strong>and</strong> advisory services operate with<strong>in</strong> two structures:<br />
- Voivodship Advisory Services Centres (ODRs) together with field units<br />
report<strong>in</strong>g to voivods <strong>and</strong> f<strong>in</strong>anced from voivodship budgets<br />
- National Advisory Centre for Agriculture <strong>and</strong> Rural Development<br />
(NACARD) <strong>in</strong>clud<strong>in</strong>g two divisions <strong>and</strong> seven regional centres, report<strong>in</strong>g to<br />
M<strong>in</strong>ister of Agriculture <strong>and</strong> Rural Development <strong>and</strong> f<strong>in</strong>anced from the<br />
MARD budget.<br />
Overall, 5 315 staff are employed <strong>in</strong> ODRs <strong>and</strong> NACARD, of whom 2 992 field<br />
advisors, 1 048 specialists <strong>and</strong> 322 management staff. Agricultural Advisory Centres<br />
cooperate with research <strong>and</strong> scientific units, national <strong>and</strong> regional <strong>in</strong>stitutions as<br />
well as agricultural organisations <strong>and</strong> companies work<strong>in</strong>g for the benefit of<br />
<strong>agriculture</strong> <strong>and</strong> rural development. Dissem<strong>in</strong>ation of <strong>in</strong>formation useful for farms’<br />
operations as well as enhanc<strong>in</strong>g farmers <strong>and</strong> rural areas <strong>in</strong>habitants’ qualifications,<br />
enabl<strong>in</strong>g them to benefit from state aid <strong>and</strong> external funds takes various forms, such<br />
as direct contacts with farmers, tra<strong>in</strong><strong>in</strong>g courses, sem<strong>in</strong>ars, agricultural fairs,<br />
exhibitions <strong>and</strong> other promotion events, website, advisory centres’ publications,<br />
bullet<strong>in</strong>s, magaz<strong>in</strong>es, leaflets, posters, video cassettes, etc.<br />
59
Research <strong>and</strong> development units<br />
AGRICULTURAL POLICY<br />
The M<strong>in</strong>ister of Agriculture <strong>and</strong> Rural Development is responsible for<br />
supervis<strong>in</strong>g 20 research <strong>and</strong> development units <strong>in</strong>clud<strong>in</strong>g 17 research <strong>in</strong>stitutes,<br />
2 central laboratories <strong>and</strong> 1 research <strong>and</strong> development centre.<br />
Research <strong>and</strong> development units are engaged <strong>in</strong> research <strong>and</strong> development<br />
activities <strong>in</strong> all areas <strong>and</strong> discipl<strong>in</strong>es of agricultural sciences cover<strong>in</strong>g plant<br />
production, animal production, agri-<strong>food</strong> process<strong>in</strong>g, as well as technique,<br />
economics <strong>and</strong> organisation of production.<br />
In 2003 the average number of scientific staff work<strong>in</strong>g for the M<strong>in</strong>isterial<br />
research <strong>and</strong> development centres was 1 130 persons <strong>in</strong>clud<strong>in</strong>g 179 professors.<br />
Agricultural sciences <strong>in</strong> Pol<strong>and</strong> achieved a high scientific level, <strong>in</strong> particular <strong>in</strong><br />
such discipl<strong>in</strong>es as veter<strong>in</strong>ary science, physical properties of soils, environmental<br />
pollution <strong>and</strong> <strong>food</strong> contam<strong>in</strong>ation, agricultural crops genetics, farm animal<br />
physiology <strong>and</strong> the use of biotechnology to obta<strong>in</strong> organisms with the desired<br />
characteristics. M<strong>in</strong>istry research <strong>and</strong> development units pursue over 3 000 themes<br />
annually under their statutory activities, of which 1 500 are completed each year.<br />
S<strong>in</strong>ce 1998 <strong>in</strong>formation on research conducted under statutory activities <strong>and</strong><br />
completed every year <strong>in</strong> m<strong>in</strong>isterial R&D units has been entered <strong>in</strong> the IT system<br />
“SIBROL”, run by the Central Agricultural Library. The M<strong>in</strong>ister of Agriculture <strong>and</strong><br />
Rural Development gives awards to R&D units’ staff (scientific teams) for their<br />
great achievements of significant importance for <strong>agriculture</strong>, rural development <strong>and</strong><br />
agricultural markets.<br />
Overall, 7 740 publications were issued by R&D units’ employees <strong>in</strong> 2003,<br />
<strong>in</strong>clud<strong>in</strong>g 2 968 scientific publications, reviewed <strong>and</strong> issued by m<strong>in</strong>isterial R&D<br />
units’ staff <strong>and</strong> 481 monographs <strong>and</strong> manuals.<br />
Funds allocated for f<strong>in</strong>anc<strong>in</strong>g or co-f<strong>in</strong>anc<strong>in</strong>g are transferred from the national<br />
budget as a grant def<strong>in</strong>ed as to a grantee, earmarked subsidy <strong>and</strong> based on the<br />
decision or agreement on, <strong>in</strong>ter alia, statutory activities of units, research projects,<br />
earmarked projects, contributions to <strong>in</strong>ternational <strong>in</strong>stitutions.<br />
Moreover, R&D units have other sources of funds for research <strong>and</strong> development<br />
such as participation <strong>in</strong> foreign cooperation programmes, provision of services to<br />
economic <strong>and</strong> scientific establishments as well as lease <strong>and</strong> sale of assets, <strong>in</strong>terest<br />
on capital, etc.<br />
Generally <strong>in</strong> 2003, R&D units report<strong>in</strong>g to the M<strong>in</strong>istry of Agriculture<br />
were runn<strong>in</strong>g approximately 700 national research programmes <strong>and</strong> around<br />
112 <strong>in</strong>ternational research programmes, of which 52 under EU schemes.<br />
60
EUROPEAN UNION ASSISTANCE<br />
1991 was the first year when EU assistance was provided for Pol<strong>and</strong> based on<br />
the Decision of the Council of M<strong>in</strong>isters of the European Economic Community<br />
(EEC) of 1989 channell<strong>in</strong>g assistance funds to Pol<strong>and</strong> <strong>and</strong> Hungary to support<br />
transformations <strong>and</strong> adaptation of the agricultural <strong>and</strong> rural sector to the<br />
chang<strong>in</strong>g external conditions. Pre-accession assistance was provided under<br />
Phare projects <strong>and</strong> as from 2000 from the SAPARD Programme. These<br />
programmes cont<strong>in</strong>ue to be implemented, though no new tasks have been<br />
undertaken s<strong>in</strong>ce 2004. Follow<strong>in</strong>g accession to the EU, <strong>agriculture</strong> <strong>and</strong> rural<br />
areas are funded from the European Agricultural Guarantee <strong>and</strong> Guidance Fund<br />
(EAGGF).<br />
Pre-accession Programmes<br />
Phare Projects<br />
AGRICULTURAL POLICY<br />
In the first years of Phare project implementation priority was given to<br />
privatisation of state-owned farms, renewal of rural cooperatives <strong>and</strong> cooperative<br />
banks as well as tra<strong>in</strong><strong>in</strong>g for farmers <strong>and</strong> other persons work<strong>in</strong>g for <strong>agriculture</strong> <strong>and</strong><br />
its environment.<br />
In 1994 wholesale trade structures were grow<strong>in</strong>g <strong>in</strong> importance <strong>in</strong> Phare projects<br />
as well as agri-environmental programmes the implementation of which was<br />
commenced then. In addition, projects aimed at <strong>food</strong> safety (HACCP – Hazard<br />
Analysis <strong>and</strong> Critical Control Po<strong>in</strong>ts), Good Manufacture Practices <strong>in</strong> agri-<strong>food</strong><br />
<strong>in</strong>dustry, ISO st<strong>and</strong>ards were becom<strong>in</strong>g <strong>in</strong>creas<strong>in</strong>gly important.<br />
Follow<strong>in</strong>g 1995 a large part of funds was allocated for harmonisation of Polish<br />
legislation with the acquis communautaire <strong>and</strong> adaptation of <strong>in</strong>spection services,<br />
<strong>in</strong> particular veter<strong>in</strong>ary <strong>and</strong> phytosanitary services as well as preparation of<br />
adm<strong>in</strong>istrative <strong>in</strong>stitutions for performance of new functions follow<strong>in</strong>g<br />
accession.<br />
Gradually, <strong>in</strong>vestment projects were embarked on, <strong>in</strong> particular those related to<br />
construction of technical <strong>in</strong>frastructure <strong>in</strong> rural areas (water pipel<strong>in</strong>es, sewerage<br />
systems, dump<strong>in</strong>g sites, roads, re-electrification, etc.).<br />
In 1998 the rules for Phare project fund<strong>in</strong>g were changed. S<strong>in</strong>ce then, the cof<strong>in</strong>anc<strong>in</strong>g<br />
by the Polish side has become necessary. Simultaneously, rules for aid <strong>and</strong><br />
funds allocation have been modified. Accord<strong>in</strong>g to the new rules, 30% of assistance<br />
funds were to be allocated for <strong>in</strong>stitution build<strong>in</strong>g or transformation <strong>and</strong> 70% for<br />
<strong>in</strong>vestment relat<strong>in</strong>g to such <strong>in</strong>stitutional adaptation, i.e. ma<strong>in</strong>ly purchases of<br />
computers, software <strong>and</strong> equipment for laboratories.<br />
With<strong>in</strong> 1999-2003, 39 new projects were implemented, primarily aimed at:<br />
- adaptation of veter<strong>in</strong>ary border <strong>in</strong>spection services, laboratory control <strong>and</strong><br />
control of animal feed<strong>in</strong>gstuffs, creation of adm<strong>in</strong>istration responsible for<br />
phytosanitary <strong>and</strong> <strong>food</strong> control<br />
61
- creation of fishery adm<strong>in</strong>istration <strong>and</strong> organisation of the fish market<br />
- implementation of CAP mechanisms, <strong>in</strong>clud<strong>in</strong>g establishment of the<br />
Integrated Adm<strong>in</strong>istration <strong>and</strong> Control System (IACS), L<strong>and</strong> Parcel<br />
Identification System (LPIS) <strong>and</strong> Animal Identification <strong>and</strong><br />
Registration<br />
- enforcement of st<strong>and</strong>ards for agricultural hold<strong>in</strong>gs, creation of organic farms,<br />
- preparations for the <strong>in</strong>troduction of the early retirement scheme (structural<br />
pensions), agri-environmental programmes <strong>and</strong> afforestation,<br />
- implementation of farm accountancy (FADN), the agricultural <strong>in</strong>formation<br />
system, the agricultural advisory system.<br />
Accord<strong>in</strong>g to f<strong>in</strong>ancial memor<strong>and</strong>a for particular years, nearly Euro 300 million<br />
was allocated for agricultural project implementation, of which Euro 140 million <strong>in</strong><br />
1999-2003.<br />
Phare 2003 is the last pre-accession assistance programme. However, Pol<strong>and</strong> <strong>and</strong><br />
other new EU member states will cont<strong>in</strong>ue the strengthen<strong>in</strong>g of adm<strong>in</strong>istration <strong>and</strong><br />
implementation of EU legislation follow<strong>in</strong>g accession. To this end, the European<br />
Commission proposed an additional f<strong>in</strong>ancial programme Transition Facility, which<br />
will enable fund<strong>in</strong>g of measures to strengthen adm<strong>in</strong>istration with<strong>in</strong> 3 years<br />
follow<strong>in</strong>g accession.<br />
The European Commission suggested that such transition facility should<br />
cont<strong>in</strong>ue the Phare Programme Institution Build<strong>in</strong>g, thus reta<strong>in</strong><strong>in</strong>g the programme<br />
organisational structure that was created dur<strong>in</strong>g its implementation.<br />
Accord<strong>in</strong>g to the schedule of the Transition Facility, the f<strong>in</strong>ancial proposal<br />
cover<strong>in</strong>g projects proposed for Transition Facility 2004 will be discussed by the<br />
Phare Management Committee <strong>in</strong> September 2004.<br />
The M<strong>in</strong>istry of Agriculture submitted four projects for TF 2004 <strong>and</strong> two<br />
components under the Multi-sectoral Tra<strong>in</strong><strong>in</strong>g Programme for Accession to the EU<br />
totall<strong>in</strong>g Euro 9 620 000 (Euro 7 820 000 of EU funds <strong>and</strong> Euro 1 800 000 as Polish<br />
co-f<strong>in</strong>anc<strong>in</strong>g).<br />
SAPARD Programme<br />
AGRICULTURAL POLICY<br />
SAPARD was launched <strong>in</strong> July 2002, <strong>and</strong> the deadl<strong>in</strong>e for application submission<br />
by beneficiaries was February 2004. With<strong>in</strong> the whole period of application<br />
submission, farmers, territorial self-governments <strong>and</strong> entrepreneurs lodged 31 077<br />
applications <strong>in</strong> total, <strong>in</strong>clud<strong>in</strong>g:<br />
- 1 778 for implementation of tasks related to improvement of process<strong>in</strong>g <strong>and</strong><br />
market<strong>in</strong>g of agricultural <strong>and</strong> fish products<br />
- 15 574 for <strong>in</strong>vestments <strong>in</strong> agricultural hold<strong>in</strong>gs<br />
- 6 230 for development <strong>and</strong> improvement of rural <strong>in</strong>frastructure<br />
- 7 495 for measures aimed at diversification of economic activities <strong>in</strong> rural<br />
areas.<br />
In addition, tra<strong>in</strong><strong>in</strong>g <strong>and</strong> technical assistance the beneficiary of which was<br />
MARD were provided.<br />
62
AGRICULTURAL POLICY<br />
Pol<strong>and</strong> signed with the European Commission four Annual F<strong>in</strong>anc<strong>in</strong>g<br />
Agreements for 2000-2003 totall<strong>in</strong>g Euro 708.2 million with the correspond<strong>in</strong>g<br />
national co-f<strong>in</strong>anc<strong>in</strong>g at Euro 235.8 million.<br />
From the beg<strong>in</strong>n<strong>in</strong>g of its implementation until 22 June 2004, Euro 1047.2<br />
million was disbursed to 5 378 beneficiaries.<br />
Amounts covered by applications for f<strong>in</strong>ancial aid are above the SAPARD limits<br />
<strong>and</strong> therefore the European Commission was requested to f<strong>in</strong>ance applications<br />
assessed positively from the European Agricultural Guidance <strong>and</strong> Guarantee Fund<br />
(EAGGF) resources.<br />
Assistance funds follow<strong>in</strong>g accession to the EU<br />
Follow<strong>in</strong>g accession, agricultural producers will be entitled to apply for the<br />
follow<strong>in</strong>g:<br />
- direct area payments <strong>and</strong> payments to production of tobacco raw material <strong>and</strong><br />
potato for starch,<br />
- participation <strong>in</strong> the rural development schemes covered by the Rural Areas<br />
Development Plan (RADP)<br />
- <strong>in</strong>vestment <strong>in</strong> agricultural hold<strong>in</strong>gs <strong>and</strong> enterprises <strong>and</strong> <strong>in</strong> agricultural<br />
environment, as def<strong>in</strong>ed <strong>in</strong> the Sectoral Operational Programme (SOP)<br />
63
Restructur<strong>in</strong>g <strong>and</strong> Modernisation of the Food Sector <strong>and</strong> Rural Development<br />
The aid will be f<strong>in</strong>anced from the European Agriculture Guidance <strong>and</strong><br />
Guarantee Fund (EAGGF).<br />
Agricultural producers will also benefit <strong>in</strong>directly from <strong>in</strong>tervention measures<br />
undertaken on the Common market, f<strong>in</strong>anced from the EU budget, <strong>and</strong> regional<br />
development programmes.<br />
Direct payments<br />
AGRICULTURAL POLICY<br />
The system of s<strong>in</strong>gle area payments is a new solution, not applied <strong>in</strong> the EU-15<br />
so far. The system <strong>in</strong> Pol<strong>and</strong> is based on direct payments to agricultural l<strong>and</strong><br />
<strong>in</strong>clud<strong>in</strong>g:<br />
- a s<strong>in</strong>gle area payment, f<strong>in</strong>anced <strong>in</strong> total from the EU budget constitut<strong>in</strong>g 25%,<br />
30% <strong>and</strong> 35% <strong>in</strong> 2004, 2005 <strong>and</strong> 2006 respectively of payments applicable <strong>in</strong> the<br />
EU. The rate of payment to 1 ha of UAA will be determ<strong>in</strong>ed by the European<br />
Commission based on Pol<strong>and</strong>’s envelope (f<strong>in</strong>ancial conversion of premiums<br />
<strong>and</strong> reference areas under crops covered by payments <strong>in</strong> the EU allocated for<br />
Pol<strong>and</strong> <strong>in</strong> the Accession Treaty),<br />
- supplementary payments f<strong>in</strong>anced from the national budget <strong>and</strong> partly from<br />
the shift of UE funds for Pol<strong>and</strong> allocated for RADP implementation with<strong>in</strong> the<br />
follow<strong>in</strong>g years 2004, 2005 <strong>and</strong> 2006 up to 55%, 60% <strong>and</strong> 65% for crops eligible<br />
for EU support (cereals, <strong>in</strong>clud<strong>in</strong>g maize for animal feed<strong>in</strong>gstuffs, oilseeds,<br />
high prote<strong>in</strong> crops, flax <strong>and</strong> hemp for fibre, pulses, tobacco, hops, starch<br />
potatoes) <strong>and</strong> fodder areas related to animal production covered by animal<br />
premiums <strong>in</strong> the EU (cattle, sheep, milk).<br />
It is estimated that the rate of a s<strong>in</strong>gle area payment will be ca Euro 45 per ha,<br />
which corresponds to ca PLN 200 (depend<strong>in</strong>g on the Euro exchange rate), whereas<br />
that of supplementary payments will be determ<strong>in</strong>ed by the Council of M<strong>in</strong>isters<br />
annually. The rate of supplementary payments depends on the type of crops <strong>and</strong> will<br />
range from Euro 60 per ha (cereals, oilseeds, high prote<strong>in</strong> crops, flax, hemp, vetch,<br />
crops grown for seeds <strong>and</strong> meadows <strong>and</strong> pastures) to 220 Euro/ha for hemp, 50<br />
Euro/t for starch potatoes <strong>and</strong> 5 PLN/kg for tobacco.<br />
Applications for direct payments <strong>in</strong> Pol<strong>and</strong> were submitted until the extended<br />
deadl<strong>in</strong>e of 15 June 2004 (from 15 April); 85% of eligible farmers applied for such<br />
payments, for the area of 92% of UAA.<br />
In addition, under a s<strong>in</strong>gle application for area payments, farmers applied for<br />
payments to farms <strong>in</strong> less favoured areas (LFA) (53% of the total UAA <strong>in</strong> Pol<strong>and</strong>).<br />
It is estimated that Polish farmers will receive over PLN 6 billion annually as<br />
direct payments.<br />
On 1 May 2004 payments to buy<strong>in</strong>g <strong>in</strong> prices of extra grade milk were abolished<br />
<strong>and</strong> as from the second half of 2004 fuel vouchers, or payments to certified seeds as<br />
well as the hitherto forms of <strong>in</strong>tervention on the pork market (<strong>in</strong>tervention buy<strong>in</strong>g<br />
<strong>in</strong>) will be withdrawn.<br />
64
AGRICULTURAL POLICY<br />
Rural Areas Development Plan (RADP)<br />
To implement the Plan, Euro 3 563 million will be allocated <strong>in</strong> 2004-2006,<br />
<strong>in</strong>clud<strong>in</strong>g Euro 2 866.4 million from the EU <strong>and</strong> Euro 696.6 million from the<br />
national budget.<br />
The follow<strong>in</strong>g programmes will be carried out under the Plan:<br />
- structural early retirement pensions aimed at replacement of generations<br />
<strong>in</strong> <strong>agriculture</strong> <strong>and</strong> improvement of the agrarian structure. The structural<br />
pension rate is determ<strong>in</strong>ed as a relevant percentage of the lowest old-age<br />
pension. Depend<strong>in</strong>g on the size of the farm to be transferred or the number of<br />
people (a farmer or a farmer <strong>and</strong> his wife), the basic amount of pension will<br />
range from 210% to 440% of the lowest pension (i.e. given that on 1 March<br />
2004 the lowest pension <strong>in</strong> Pol<strong>and</strong> was set at PLN 562.58, the structural<br />
pension will range from PLN 1 181 to PLN 2 475)<br />
- support for semi-subsistence farms, i.e. assistance for farms of small<br />
economic potential amount<strong>in</strong>g to 1 250 euro/farm annually. After the third<br />
year, the beneficiaries will have to prove that they have exp<strong>and</strong>ed their<br />
production<br />
- support for farm<strong>in</strong>g <strong>in</strong> LFA to compensate for unfavourable natural<br />
conditions <strong>and</strong> to counteract depopulation of rural areas <strong>and</strong> the loss of their<br />
agricultural character.<br />
The support rate will range, depend<strong>in</strong>g on difficulties <strong>in</strong> l<strong>and</strong> cultivation <strong>and</strong> its<br />
location, from 56 to 68 Euro/ha. LFA payments will be reduced for farms with an<br />
area over 50 ha <strong>and</strong> those with an area over 300 ha will not be eligible for such<br />
payments at all<br />
- support for agri-environmental measures <strong>and</strong> improvement of animal<br />
65
AGRICULTURAL POLICY<br />
welfare to strengthen susta<strong>in</strong>able <strong>agriculture</strong>, especially <strong>in</strong> protected areas<br />
<strong>and</strong> those at risk of degradation. The average subsidy rate is estimated at ca<br />
100-200 Euro/ha depend<strong>in</strong>g on the measures taken<br />
- l<strong>and</strong> afforestation <strong>and</strong> ensur<strong>in</strong>g proper care of new plant<strong>in</strong>gs at early stages<br />
of their growth.<br />
The assistance will be disbursed every year:<br />
• as a s<strong>in</strong>gle payment for afforestation at 4 300 – 5 900 PLN/ha (variation is<br />
due to differences <strong>in</strong> terra<strong>in</strong> configuration <strong>and</strong> types of trees: coniferous/leaf<br />
trees, proof<strong>in</strong>g aga<strong>in</strong>st animal (2 m grid) 2 400 PLN/ha)<br />
• as a plant husb<strong>and</strong>ry premium – 420-750 PLN/ha without us<strong>in</strong>g repellents<br />
<strong>and</strong> 700 – 1 100 PLN/ha us<strong>in</strong>g repellents<br />
• as an afforestation premium of 1 400 PLN/ha for a farmer generat<strong>in</strong>g more<br />
than 20% of <strong>in</strong>come from farm<strong>in</strong>g <strong>and</strong> 360 PLN/ha for a farmer earn<strong>in</strong>g<br />
more than 80% from off-farm<strong>in</strong>g activities<br />
- harmonisation of agricultural hold<strong>in</strong>g st<strong>and</strong>ards with those of the EU<br />
with regard to environmental protection, plant protection, health, animal<br />
welfare. The support rate will be 200 Euro/Large Production Unit <strong>in</strong> the first<br />
year <strong>and</strong> 50 <strong>and</strong> 25 Euro/LPU <strong>in</strong> the second <strong>and</strong> third year respectively. The<br />
assistance rate for hen farms will be Euro 150, Euro 50 <strong>and</strong> Euro 25 per 150<br />
stalls with<strong>in</strong> the successive three years.<br />
- agricultural producer groups set up to jo<strong>in</strong>tly harmonise production<br />
st<strong>and</strong>ards by group members. In the course of 5 years the aid will be provided<br />
for each consecutive year at 5%, 5%, 4%, 3% <strong>and</strong> 2% of the sold output value<br />
up to Euro 1 million <strong>and</strong> at 2.5%, 2.5%, 2%, 1.5% <strong>and</strong> 1.5% of the sold output<br />
value above Euro 1 million. Such aid cannot exceed Euro 100 000 <strong>in</strong> the first<br />
<strong>and</strong> second year <strong>and</strong> Euro 80 000, Euro 60 000 <strong>and</strong> Euro 50 000 with<strong>in</strong> the<br />
follow<strong>in</strong>g successive years.<br />
Sectoral Operational Programme: Restructur<strong>in</strong>g <strong>and</strong> Modernisation of the<br />
Food Sector <strong>and</strong> Rural Development (SOP)<br />
In 2004-2006 support under SAPARD will be Euro 1 784.15 million, of which<br />
Euro 1 192.68 million from the EU <strong>and</strong> Euro 591.47 million from the national<br />
budget. Some recipients of measures under the programme will be required to cof<strong>in</strong>ance<br />
the undertak<strong>in</strong>gs. Farmers, entrepreneurs, local self-governments <strong>and</strong> State<br />
Forests Authority will be eligible for aid.<br />
Under the programme the follow<strong>in</strong>g undertak<strong>in</strong>gs will be f<strong>in</strong>anced:<br />
- <strong>in</strong>vestments <strong>in</strong> agricultural hold<strong>in</strong>gs up to PLN 300 000, the aid rang<strong>in</strong>g<br />
from 50% to 65% of eligible costs. Farmers from LFA <strong>and</strong> young farmers will<br />
obta<strong>in</strong> higher rates of aid.<br />
- facilitat<strong>in</strong>g the start of young farmers by grant<strong>in</strong>g a premium of PLN<br />
50 000 to young farmers start<strong>in</strong>g to run a farm on their own. To receive such<br />
premium, they will have to comply with four conditions:<br />
• the age of 40 <strong>and</strong> the date for start<strong>in</strong>g runn<strong>in</strong>g a farm not later than with<strong>in</strong><br />
66
AGRICULTURAL POLICY<br />
12 months of assistance allocation<br />
• vocational qualifications<br />
• m<strong>in</strong>imum environmental, hygiene <strong>and</strong> animal welfare st<strong>and</strong>ards<br />
• farm economic viability<br />
- development <strong>and</strong> improvement of technical <strong>in</strong>frastructure related to<br />
<strong>agriculture</strong> up to 50% of eligible costs, with the maximum level of assistance<br />
of no more than PLN 200 000 for construction or modernisation of <strong>in</strong>ternal<br />
roads, PLN 80 000 for sewage treatment <strong>and</strong> purification <strong>and</strong> PLN 120 000 for<br />
power supply network <strong>and</strong> equipment<br />
- vocational tra<strong>in</strong><strong>in</strong>g for farmers <strong>and</strong> other people work<strong>in</strong>g <strong>agriculture</strong> <strong>and</strong><br />
forestry <strong>in</strong> production, farm management, commercially-oriented production,<br />
compliance with EU st<strong>and</strong>ards, etc. The assistance is provided as<br />
reimbursement of eligible costs borne by tra<strong>in</strong><strong>in</strong>g <strong>in</strong>stitutions<br />
- support for agricultural advisory services to be <strong>in</strong>volved <strong>in</strong> help<strong>in</strong>g<br />
farmers apply for CAP <strong>and</strong> Structural Funds f<strong>in</strong>ancial resources. 100% of<br />
eligible costs will be reimbursed<br />
- improvement of process<strong>in</strong>g <strong>and</strong> market<strong>in</strong>g of agricultural products up<br />
to 50% of eligible costs, however, no more than PLN 20 million per process<strong>in</strong>g<br />
establishment modernis<strong>in</strong>g its production potential (<strong>in</strong>ter alia, for purchases of<br />
specialist equipment ensur<strong>in</strong>g quality improvement <strong>and</strong> environmental<br />
protection)<br />
- restor<strong>in</strong>g forest production potential destroyed by natural disasters <strong>and</strong>/or<br />
fires <strong>and</strong> <strong>in</strong>troduc<strong>in</strong>g appropriate prevention <strong>in</strong>struments, up to 100% of<br />
eligible costs<br />
- l<strong>and</strong> consolidation up to 10% of eligible costs. Areas characterised by high<br />
fragmentation <strong>and</strong> split-up of parcels with<strong>in</strong> a farm will be covered by<br />
assistance<br />
- village rehabilitation <strong>and</strong> preservation <strong>and</strong> protection of cultural<br />
heritage up to 80% of eligible costs, <strong>and</strong> 20% must be contributed by the<br />
local self-government. The total public assistance for such undertak<strong>in</strong>gs is<br />
PLN 450 000.<br />
- management of agricultural water resources up to 100% of eligible costs<br />
reimbursed to L<strong>and</strong> Reclamation <strong>and</strong> Water Installations Boards. As regards<br />
detailed l<strong>and</strong> reclamation, farmers are to contribute 20%, the national budget<br />
– 30% <strong>and</strong> EU fund – 50%.<br />
Furthermore, susta<strong>in</strong>able rural development will be supported via the pilot<br />
programme Leader+. The maximum aid for formulation <strong>and</strong> pursuance of local<br />
strategies for rural areas development aimed at mak<strong>in</strong>g such areas more attractive as<br />
a place of residence <strong>and</strong> bus<strong>in</strong>ess operations may amount to PLN 150–1 500 000<br />
depend<strong>in</strong>g on the type of undertak<strong>in</strong>g.<br />
67
AGRICULTURAL CENTRAL AND LOCAL SELF-GOVERNMENT INSTITUTIONS<br />
Agricultural Market Agency (AMA)<br />
As from the date of accession AMA has been play<strong>in</strong>g the role of a pay<strong>in</strong>g agency<br />
for some of measures comply<strong>in</strong>g with EU legislation on the organisation of<br />
particular agricultural markets.<br />
In the framework of CAP mechanisms AMA will be responsible for tak<strong>in</strong>g<br />
measures on the follow<strong>in</strong>g markets: cereals, meat, milk <strong>and</strong> milk products, sugar,<br />
starch, dried fodder, flax <strong>and</strong> hemp for fibres, raw tobacco, w<strong>in</strong>e, fruit <strong>and</strong><br />
vegetables, olive oil <strong>and</strong> silkworms with regard to:<br />
- <strong>in</strong>tervention purchases, storage <strong>and</strong> sales of cereals, meat, milk products <strong>and</strong><br />
sugar<br />
- private storage aid for meat <strong>and</strong> meat products<br />
- aid to dried fodder production<br />
- production premiums for potato starch producers<br />
- aid to process<strong>in</strong>g of flax <strong>and</strong> hemp straw<br />
- aid for silkworm producers<br />
- aid for processors utilis<strong>in</strong>g starch <strong>and</strong> sugar for uses other than human<br />
consumption, for olive oil used <strong>in</strong> process<strong>in</strong>g <strong>and</strong> aid for the use of grape must<br />
to produce juice <strong>and</strong> other <strong>food</strong>stuffs <strong>and</strong> to <strong>in</strong>crease alcohol concentration <strong>in</strong><br />
w<strong>in</strong>ery products, aid for process<strong>in</strong>g <strong>and</strong> consumption of milk products<br />
- payments to producers of raw tobacco <strong>and</strong> potatoes for starch production<br />
- support for bee-keep<strong>in</strong>g<br />
- organisation of tenders for utilisation of fruit <strong>and</strong> vegetables not <strong>in</strong>tended for<br />
market<strong>in</strong>g,<br />
- adm<strong>in</strong>istration of quotas of milk production, potato starch <strong>and</strong> raw tobacco.<br />
Agency’s tasks with regard to milk products, dried fodder, flax <strong>and</strong> hemp for<br />
fibre, raw tobacco as well as fruit <strong>and</strong> vegetables are provided for <strong>in</strong> national sectoral<br />
laws.<br />
In addition, the Agency is responsible for adm<strong>in</strong>ister<strong>in</strong>g trade <strong>in</strong> agricultural<br />
products <strong>and</strong> processed products not covered by Annex 1 to the Treaty establish<strong>in</strong>g<br />
the European Community by:<br />
- issu<strong>in</strong>g <strong>and</strong> settl<strong>in</strong>g import <strong>and</strong> export licences<br />
- issu<strong>in</strong>g documents required to calculate <strong>and</strong> disburse export refunds <strong>and</strong><br />
import levies<br />
- deal<strong>in</strong>g with f<strong>in</strong>ancial security<br />
- calculat<strong>in</strong>g <strong>and</strong> disburs<strong>in</strong>g export refunds <strong>and</strong> import levies<br />
- impos<strong>in</strong>g <strong>and</strong> enforc<strong>in</strong>g adm<strong>in</strong>istrative penalties.<br />
AMA’s responsibilities will <strong>in</strong>clude both implementation of programmes to<br />
provide <strong>food</strong> surpluses for the less well-off EU citizens <strong>and</strong> measures to dissem<strong>in</strong>ate<br />
promotion <strong>and</strong> <strong>in</strong>formation programmes concern<strong>in</strong>g agri-<strong>food</strong> products.<br />
68
AGRICULTURAL CENTRAL AND LOCAL SELF-GOVERNMENT INSTITUTIONS<br />
Agency for Restructur<strong>in</strong>g <strong>and</strong> Modernisation of Agriculture (ARMA)<br />
Support<strong>in</strong>g Polish farmers <strong>and</strong> rural areas <strong>in</strong>habitants for 10 years now, ma<strong>in</strong>ly<br />
through subsidies to <strong>in</strong>terest on bank<strong>in</strong>g work<strong>in</strong>g capital <strong>and</strong> <strong>in</strong>vestment credits as<br />
well as co-f<strong>in</strong>anc<strong>in</strong>g rural <strong>in</strong>frastructure, measures aimed at tra<strong>in</strong><strong>in</strong>g <strong>and</strong> education<br />
of the youth <strong>and</strong> adults, the Agency for Restructur<strong>in</strong>g <strong>and</strong> Modernisation of<br />
Agriculture has become the second, beside AMA, pay<strong>in</strong>g agency.<br />
ARMA is responsible for direct payments, accompany<strong>in</strong>g measures <strong>and</strong> other<br />
<strong>in</strong>struments implemented under the CAP, f<strong>in</strong>anced from the EAGGF.<br />
Previously ARMA took measures related to payment of EU funds by<br />
implement<strong>in</strong>g the SAPARD Programme to be f<strong>in</strong>alised by end-2006 (disbursement<br />
of payments).<br />
Follow<strong>in</strong>g accession, ARMA has been perform<strong>in</strong>g the follow<strong>in</strong>g ma<strong>in</strong> functions:<br />
- of a pay<strong>in</strong>g agency<br />
- of the Implement<strong>in</strong>g Authority <strong>and</strong> f<strong>in</strong>al beneficiary for SOP <strong>and</strong> RADP<br />
- of an <strong>in</strong>stitution implement<strong>in</strong>g national aid schemes<br />
In order to efficiently perform new functions, ARMA was engaged <strong>in</strong><br />
implement<strong>in</strong>g the IACS (Integrated Adm<strong>in</strong>istration <strong>and</strong> Control System)<br />
system, preceded by agricultural producers’ registration <strong>and</strong> <strong>in</strong>troduction of the<br />
Animal Identification <strong>and</strong> Registration System. IACS was established from scratch<br />
<strong>and</strong> its implementation was related to the change of the ARMA organisational<br />
structure <strong>and</strong> development of relevant procedures for receipt <strong>and</strong> exam<strong>in</strong>ation of<br />
applications. Three hundred <strong>and</strong> fourteen ARMA’s poviat offices were set up under<br />
a new structure.<br />
The IT software operat<strong>in</strong>g <strong>in</strong> the Agency is an <strong>in</strong>tegral part of the national <strong>food</strong><br />
security system.<br />
From 15 April to 30 June 2004 the Agency received 1.6 million applications for a<br />
farm registration number <strong>and</strong> 1.4 million for direct payments. ARMA is also<br />
responsible for adm<strong>in</strong>istrative control of payment disbursement correctness.<br />
Agricultural Property Agency (APA)<br />
Pursu<strong>in</strong>g its activities from 1992 to 15 July as the Agricultural Property Agency of<br />
the State Treasury, APA is a state legal entity entrusted with the exercise of the<br />
ownership right <strong>and</strong> other rights <strong>in</strong> property with regard to state-owned agricultural<br />
real estate.<br />
APA carries out tasks of sett<strong>in</strong>g up family farms, improv<strong>in</strong>g agrarian structure,<br />
creat<strong>in</strong>g conditions for a regional use of APA Resource production potential,<br />
restructur<strong>in</strong>g <strong>and</strong> privatis<strong>in</strong>g State Treasury property utilised for agricultural<br />
purposes, trad<strong>in</strong>g <strong>in</strong> property <strong>and</strong> other State Treasury assets used for agricultural<br />
purposes, secur<strong>in</strong>g the State Treasury <strong>and</strong> support<strong>in</strong>g the establishment of private<br />
farms on State Treasury l<strong>and</strong>.<br />
APA operates on the self-f<strong>in</strong>anc<strong>in</strong>g basis. The ma<strong>in</strong> sources of its <strong>in</strong>come are<br />
revenues from property sales <strong>and</strong> leases. In the <strong>in</strong>itial years of APA’s operation, a<br />
69
AGRICULTURAL CENTRAL AND LOCAL SELF-GOVERNMENT INSTITUTIONS<br />
significant part of such revenues was allocated for the repayment of commitments<br />
taken over worth almost PLN 2 billion. At present, a large part of funds from the APA<br />
Resource privatisation is channelled to the national budget, Labour Fund <strong>and</strong><br />
Agricultural Market Agency.<br />
On 16 July 2003, the Law on agricultural structure entered <strong>in</strong>to force. Its<br />
provisions lay down new Agency’s tasks <strong>and</strong> <strong>in</strong>struments to implement such tasks.<br />
These provisions enable the Agency to control that part of trade <strong>in</strong> agricultural<br />
property that has been beyond its control so far <strong>and</strong> to <strong>in</strong>tervene, if necessary, to<br />
achieve the Law objectives, i.e. to improve the agrarian structure of agricultural<br />
hold<strong>in</strong>gs, to counteract excessive concentration of agricultural property <strong>and</strong> to<br />
ensure farm<strong>in</strong>g <strong>in</strong> agricultural hold<strong>in</strong>gs by persons with appropriate qualifications.<br />
Through such objectives the provision of Article 23 of the Constitution of the<br />
Republic of Pol<strong>and</strong> is enforced; pursuant to it the basis of the agricultural structure<br />
<strong>in</strong> Pol<strong>and</strong> is a family farm.<br />
The Agency can supervise trade <strong>in</strong> agricultural property thanks to new rights<br />
it was granted, i.e. the pre-emption right (<strong>in</strong> the case of sale agreements) <strong>and</strong> the<br />
so called buyout right (for other agreements transferr<strong>in</strong>g ownership of agricultural<br />
property). The pre-emption <strong>and</strong> buyout rights are not applicable, among other<br />
th<strong>in</strong>gs, to transfer of agricultural property result<strong>in</strong>g <strong>in</strong> enlargement of a family<br />
farm up to 300 ha of UAA <strong>and</strong> to trade <strong>in</strong> agricultural property between related<br />
persons.<br />
In addition to the aforementioned tasks, the Agency performs ownership<br />
functions <strong>in</strong> crops breed<strong>in</strong>g companies <strong>and</strong> animal breed<strong>in</strong>g companies<br />
<strong>in</strong>dicated by the M<strong>in</strong>ister of Agriculture as particularly important for the<br />
national <strong>economy</strong>. Currently, APA exercises ownership right <strong>in</strong> relation to 59<br />
such companies.<br />
By the end of May 200, <strong>in</strong> performance of its statutory tasks the Agency took<br />
over 4.7 million ha of l<strong>and</strong>, <strong>in</strong>clud<strong>in</strong>g 80% from the former state-owned farms<br />
(PPGR) of an average area of 2 250 ha. So far 1.7 million ha of l<strong>and</strong> has been<br />
permanently distributed, of which 1.4 million ha has been sold. At present there is<br />
3 million ha <strong>in</strong> the Agency Resource, of which 2.4 million ha of l<strong>and</strong> (78%) has<br />
been leased. There is still 504 000 ha of l<strong>and</strong> to be distributed, largely of little<br />
agricultural usability.<br />
The property taken over by the Agency from the former PPGR <strong>in</strong>cluded<br />
objects of a special character such as <strong>food</strong> process<strong>in</strong>g plants as well as manor<br />
houses <strong>and</strong> palaces with parks. Most of such objects has been sold or rented. In<br />
addition, the Agency took over 333 000 flats of which 306 000 have been<br />
distributed, primarily via sales to the tenants. At present there is 27 000 flats <strong>in</strong><br />
the APA Resource.<br />
The ma<strong>in</strong> method of distribut<strong>in</strong>g the property taken over is sale <strong>and</strong> lease<br />
through Agency’s branch <strong>and</strong> local offices via oral public tenders (auctions) <strong>and</strong><br />
tenders <strong>in</strong>volv<strong>in</strong>g written bids (competition).<br />
70
AGRICULTURAL CENTRAL AND LOCAL SELF-GOVERNMENT INSTITUTIONS<br />
Agricultural Chambers<br />
Re-established on the basis of the Law of 1995 (with subsequent amendments),<br />
agricultural chambers have an over one hundred years' tradition <strong>in</strong> Pol<strong>and</strong>. It is a<br />
form of common agricultural self-government with a legal status. Members are<br />
obligatorily all agricultural tax payers <strong>and</strong> payers of <strong>in</strong>come tax on specific sectors of<br />
agricultural production as well as members of agricultural cooperatives that<br />
contribute l<strong>and</strong> to such cooperatives.<br />
Statutory bodies of agricultural chambers are elected <strong>in</strong> a democratic election,<br />
<strong>and</strong> the supreme body, e.g. the General Assembly - <strong>in</strong> a general election among<br />
farmers. Currently, there are 16 voivodship agricultural chambers <strong>in</strong> Pol<strong>and</strong>. Their<br />
activities are aimed at ensur<strong>in</strong>g effectiveness of agricultural production <strong>and</strong><br />
<strong>in</strong>creas<strong>in</strong>g rural <strong>in</strong>habitants’ <strong>in</strong>comes <strong>and</strong> improv<strong>in</strong>g liv<strong>in</strong>g st<strong>and</strong>ards of the rural<br />
population.<br />
Such objectives are be<strong>in</strong>g pursued by consult<strong>in</strong>g regulations by law concern<strong>in</strong>g<br />
<strong>agriculture</strong> <strong>and</strong> co-participat<strong>in</strong>g <strong>in</strong> comprehensive activities to improve an economic<br />
<strong>and</strong> production situation.<br />
The representation of agricultural chambers at the national level is the National<br />
Council of Agricultural Chambers (KRIR) composed of Presidents of chambers <strong>and</strong><br />
delegates elected by the General Assembly, one delegate from each chamber. Both<br />
the National Council <strong>and</strong> particular chambers co-operate with their counterparts <strong>in</strong><br />
EU member states <strong>and</strong> <strong>in</strong> new EU member states. As a result of foreign cooperation<br />
established by agricultural chambers, tra<strong>in</strong><strong>in</strong>g <strong>and</strong> study missions are organised<br />
dur<strong>in</strong>g which exchange of <strong>in</strong>formation <strong>and</strong> experiences between agricultural selfgovernment<br />
of particular countries takes place. In particular KRIR has been closely<br />
cooperat<strong>in</strong>g with French agricultural chambers, e.g. each of the voivodship<br />
chambers cooperates with at least one departmental agricultural chamber <strong>in</strong> France.<br />
Such cooperation covers project implementation <strong>in</strong> particular sectors, improvement<br />
of labour organisation, agro-tourism development, exchange of the youth from<br />
agricultural schools, etc.<br />
An important element of KRIR’s <strong>in</strong>ternational cooperation is an attempt at<br />
provid<strong>in</strong>g <strong>in</strong>formation on specific features of Polish <strong>agriculture</strong> to EU farmers. It<br />
takes the form of organised trips of EU farmers to Pol<strong>and</strong> dur<strong>in</strong>g which both<br />
achievements <strong>and</strong> problems of Polish <strong>agriculture</strong> are presented. For <strong>in</strong>stance, every<br />
year KRIR organises missions of agricultural counsellors from the EU member<br />
states’ embassies to familiarise them with Polish <strong>agriculture</strong>.<br />
Moreover, KRIR cooperates with pan-national European agricultural<br />
<strong>in</strong>stitutions. S<strong>in</strong>ce the beg<strong>in</strong>n<strong>in</strong>g of 1998 the National Council of Agricultural<br />
Chambers has been a member of the Confederation of European Agriculture<br />
(CEA). From September 2002 it was an associated member of COPA/COGECA <strong>and</strong><br />
s<strong>in</strong>ce 1 July it has been a fully fledged member of this organisation (Committee of<br />
Agricultural Professional Organisations – COPA <strong>and</strong> General Committee of<br />
Agricultural Cooperatives – COGECA).<br />
71
AGRICULTURAL CENTRAL AND LOCAL SELF-GOVERNMENT INSTITUTIONS<br />
Agricultural Circles<br />
The National Union of Farmers, Agricultural Circles <strong>and</strong> Organisations<br />
(KZRKiOR) is a professional union of private farmers <strong>and</strong> the national, selfgovern<strong>in</strong>g<br />
association of Agricultural Circles <strong>and</strong> Rural Housewives’ Circles (KGW),<br />
local farmers’ unions, agricultural circles <strong>and</strong> organisations, cooperatives of<br />
agricultural circles <strong>and</strong> other agricultural organisations associated on a voluntary<br />
basis. Agricultural circles br<strong>in</strong>g together approximately 1.2 million members <strong>and</strong><br />
KGW – 850 000 members associated <strong>in</strong> 25 000 KGWs.<br />
As a social <strong>and</strong> professional farmers’ organisation, agricultural circles have a<br />
142-year old tradition <strong>and</strong> Rural Housewives’ Circles – a 135-year old tradition.<br />
Agricultural circles pursue their activities based on three laws: the Law of 8 October<br />
1982 on farmers’ socio-economic organisations, the Law of 7 April 1989 on farmers’<br />
trade unions <strong>and</strong> the Cooperative Law of 16 September 1982. There are 49<br />
KZRKiOR regional offices operat<strong>in</strong>g all across the country.<br />
As the largest socio-professional organisation, KZRKiOR has been cooperat<strong>in</strong>g<br />
with other agricultural organisations from EU member states. Thus, professional<br />
organisations <strong>and</strong> trade unions from EU member states <strong>and</strong> the then EU c<strong>and</strong>idate<br />
countries pay visits to KZRKiOR. Close contacts have also been forged with<br />
representatives of numerous embassies. KZRKiOR organises study tours to EU<br />
member states to get acqua<strong>in</strong>ted with other agricultural organisations’ activities <strong>and</strong><br />
the rules applicable to EU <strong>agriculture</strong>.<br />
Result<strong>in</strong>g from the Union’s activities <strong>in</strong> the period prior to Pol<strong>and</strong>’s accession to<br />
the EU, on 3 October 2002, i.e. the 140th anniversary of the found<strong>in</strong>g of agricultural<br />
circles, the decision was taken to set up the KZRKiOR representative office <strong>in</strong><br />
Brussels. As the only agricultural organisation from Pol<strong>and</strong>, the Union started<br />
monitor<strong>in</strong>g all decisions on Pol<strong>and</strong>’s accession to the EU.<br />
On 23 <strong>and</strong> 24 September 2000 KZRKiOR organised the Congress of European<br />
Agriculture <strong>in</strong> Kraków. The Congress’ dom<strong>in</strong>ant theme was New Prospects for an<br />
Enlarged Europe.<br />
On KZRKiOR’s <strong>in</strong>itiative, under the honorary auspices of A. KwaÊniewski,<br />
President of the Republic of Pol<strong>and</strong>, on 8 <strong>and</strong> 9 February the conference br<strong>in</strong>g<strong>in</strong>g<br />
together 100 leaders of agricultural <strong>and</strong> cooperative organisations was convened.<br />
The theme was Future of Agriculture <strong>in</strong> an Enlarged Europe. Development,<br />
Opportunities, Threats. In September 2002 KZRKiOR was accepted as an<br />
associated member of COPA-COGECA until May 2004. In April 2003 dur<strong>in</strong>g the<br />
COPA-COGECA Presidium W. Seraf<strong>in</strong>, President of KZRKiOR, was elected Vice-<br />
President of COPA. On 6 May 2004 KZRKiOR became a fully-fledged member of<br />
COGECA <strong>and</strong> on 13 May 2004 – a fully-fledged member of COPA.<br />
72
ADDRESSES<br />
Adresses of <strong>in</strong>stitutions related to <strong>agriculture</strong><br />
GOVERNMENT AND OTHER INSTITUTIONS<br />
MINISTRY OF AGRICULTURE AND RURAL DEVELOPMENT (MARD)<br />
00-930 Warszawa, ul. Wspólna 30<br />
tel./fax (+48 22) 623 10 00; (+48 22) 629 55 99<br />
http://www.m<strong>in</strong>rol.gov.pl e-mail: kancelaria@m<strong>in</strong>rol.gov.pl<br />
AGRICULTURAL MARKET AGENCY (AMA)<br />
Information <strong>and</strong> Promotion Office<br />
00-400 Warszawa, ul. Nowy Âwiat 6/12<br />
tel./fax (+48 22) 661 72 72; (+48 22) 628 93 53<br />
http://www.arr.gov.pl e-mail: b.demska@arr.gov.pl<br />
AGENCY FOR RESTRUCTURING AND MODERNISATION OF<br />
AGRICULTURE (ARMA)<br />
00-175 Warszawa, Al. Jana Paw∏a II 70<br />
tel./fax (+48 22) 860 29 23; (+48 22) 636 17 75<br />
http://www.arimr.gov.pl e-mail: <strong>in</strong>fo@arimr.gov.pl<br />
AGRICULTURAL PROPERTY AGENCY (APA)<br />
00-215 Warszawa, ul. Dolaƒskiego 2<br />
tel./fax (+48 22) 635 80 09; (+48 22) 635 00 60<br />
http://www.anr.gov.pl<br />
FOUNDATION OF ASSISTANCE PROGRAMMES FOR AGRICULTURE<br />
(FAPA)<br />
00-930 Warszawa, ul. Wspólna 30<br />
tel. /fax (+48 22) 623 16 03; (+48 22) 628 93 87<br />
http://www.fapa.com.pl e-mail: fapa@fapa.com.pl<br />
FARMERS’ SOCIAL SECURITY FUND (KRUS)<br />
00-608 Warszawa, Al. Niepodleg∏oÊci 190<br />
tel./fax (+48 22) 825 99 41; (+48 22) 825 95 97<br />
http://www.krus.gov.pl e-mail: centrala@krus.gov.pl<br />
CENTRAL STATISTICAL OFFICE (GUS)<br />
Information <strong>and</strong> Publications Office<br />
00-925 Warszawa, Al. Niepodleg∏oÊci 208<br />
tel./fax (+48 22) 608 38 04; (+48 22) 608 31 87<br />
http://www.stat.gov.pl e-mail: rzecznik@stat.gov.pl<br />
73
ADDRESSES<br />
AGRICULTURE AND FOOD QUALITY INSPECTION<br />
00-930 Warszawa, ul. Wspólna 30<br />
tel./fax (+48 22) 621 64 21; (+48 22) 621 48 58<br />
http://www.cis.gov.pl e-mail: sekretariat@ijhar-s.gov.pl<br />
GENERAL VETERINARY INSPECTORATE, VETERINARY<br />
INSPECTION SERVICE<br />
00-930 Warszawa, ul. Wspólna 30<br />
tel./fax (+48 22) 628 85 11; (+48 22) 623 14 08<br />
http://www.wetgiw.gov.pl e-mail: wet@wetgiv.gov.pl<br />
PLANT PROTECTION AND SEEDS INSPECTION SERVICE (PIORIN)<br />
00-930 Warszawa, ul. Wspólna 30<br />
tel./fax (+48 22) 623 23 02; (+48 22) 623 23 04<br />
http://www.pior<strong>in</strong>.gov.pl e-mail: gi@pior.gov.pl<br />
NATIONAL ADVISORY CENTRE FOR AGRICULTURE AND RURAL<br />
DEVELOPMENT IN BRWINÓW<br />
05-840 Brw<strong>in</strong>ów, ul. Pszczeliƒska 99<br />
tel. /fax (+48 22) 729 66 34 (38); (+48 22) 729 72 91<br />
http://www.cdr.gov.pl e-mail: brw<strong>in</strong>ow_sekretariat@cdr.gov.pl<br />
NATIONAL ADVISORY CENTRE FOR AGRICULTURE AND RURAL<br />
DEVELOPMENT, BRANCH IN KRAKÓW<br />
31-063 Kraków, ul. Meiselsa 1<br />
tel./fax (+48 12) 424 05 00; (+48 12) 424 05 05<br />
http://www.cdr.gov.pl/krakow e-mail: krakow@centrum.cdr.net.pl<br />
NATIONAL ADVISORY CENTRE FOR AGRICULTURE AND RURAL<br />
DEVELOPMENT, BRANCH IN POZNA¡<br />
61-659 Poznaƒ, ul. W<strong>in</strong>ogrady 63<br />
tel./fax (+48 61) 823 20 81; (+48 61) 820 19 71<br />
http://www.cdr.gov.pl/poznan e-mail: poznan_sekretariat@cdr.gov.pl<br />
NATIONAL COUNCIL OF AGRICULTURAL CHAMBERS<br />
00-930 Warszawa, ul. Wspólna 30<br />
tel./fax (+48 22) 623 21 65; (+48 22) 623 11 55<br />
http://www.krir.republika.pl e-mail krir@z.pl<br />
NATIONAL UNION OF FARMERS, AGRICULTURAL CIRCLES AND<br />
ORGANISATIONS<br />
00-006 Warszawa , ul. Szkolna 2/4<br />
tel./ fax (+48 22) 826 55 55; (+48 22) 827 30 01<br />
http://www.kolkarolnicze.pl e-mail: biuro@kolkarolnicze.pl<br />
74
NOTES<br />
75
NOTES<br />
76
ISSN 1427-0757