agriculture and food economy in poland
agriculture and food economy in poland
agriculture and food economy in poland

Create successful ePaper yourself
Turn your PDF publications into a flip-book with our unique Google optimized e-Paper software.
AGRICULTURE<br />
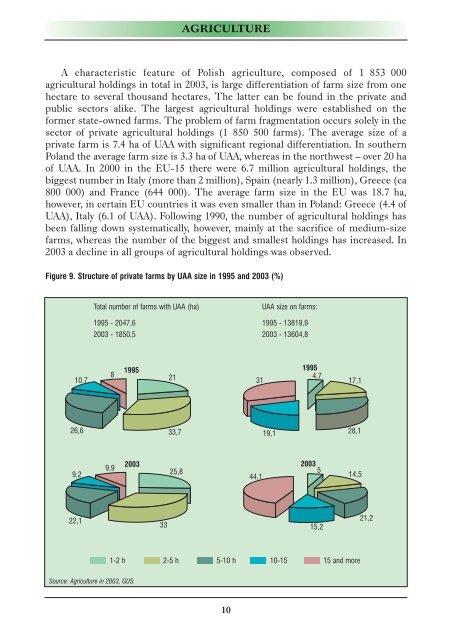
A characteristic feature of Polish <strong>agriculture</strong>, composed of 1 853 000<br />
agricultural hold<strong>in</strong>gs <strong>in</strong> total <strong>in</strong> 2003, is large differentiation of farm size from one<br />
hectare to several thous<strong>and</strong> hectares. The latter can be found <strong>in</strong> the private <strong>and</strong><br />
public sectors alike. The largest agricultural hold<strong>in</strong>gs were established on the<br />
former state-owned farms. The problem of farm fragmentation occurs solely <strong>in</strong> the<br />
sector of private agricultural hold<strong>in</strong>gs (1 850 500 farms). The average size of a<br />
private farm is 7.4 ha of UAA with significant regional differentiation. In southern<br />
Pol<strong>and</strong> the average farm size is 3.3 ha of UAA, whereas <strong>in</strong> the northwest – over 20 ha<br />
of UAA. In 2000 <strong>in</strong> the EU-15 there were 6.7 million agricultural hold<strong>in</strong>gs, the<br />
biggest number <strong>in</strong> Italy (more than 2 million), Spa<strong>in</strong> (nearly 1.3 million), Greece (ca<br />
800 000) <strong>and</strong> France (644 000). The average farm size <strong>in</strong> the EU was 18.7 ha,<br />
however, <strong>in</strong> certa<strong>in</strong> EU countries it was even smaller than <strong>in</strong> Pol<strong>and</strong>: Greece (4.4 of<br />
UAA), Italy (6.1 of UAA). Follow<strong>in</strong>g 1990, the number of agricultural hold<strong>in</strong>gs has<br />
been fall<strong>in</strong>g down systematically, however, ma<strong>in</strong>ly at the sacrifice of medium-size<br />
farms, whereas the number of the biggest <strong>and</strong> smallest hold<strong>in</strong>gs has <strong>in</strong>creased. In<br />
2003 a decl<strong>in</strong>e <strong>in</strong> all groups of agricultural hold<strong>in</strong>gs was observed.<br />
Figure 9. Structure of private farms by UAA size <strong>in</strong> 1995 <strong>and</strong> 2003 (%)<br />
10,7<br />
26,6<br />
9,2<br />
22,1<br />
8<br />
9,9<br />
1995<br />
2003<br />
Source: Agriculture <strong>in</strong> 2003, GUS.<br />
Total number of farms with UAA (ha)<br />
1995 - 2047,6<br />
2003 - 1850,5<br />
33<br />
21<br />
33,7<br />
25,8<br />
10<br />
31<br />
44,1<br />
UAA size on farms:<br />
1995 - 13819,9<br />
2003 - 13604,8<br />
19,1<br />
1995<br />
4,7<br />
2003 5<br />
15,2<br />
17,1<br />
28,1<br />
14,5<br />
1-2 h 2-5 h 5-10 h 10-15 15 <strong>and</strong> more<br />
21,2