agriculture and food economy in poland
agriculture and food economy in poland
agriculture and food economy in poland

Create successful ePaper yourself
Turn your PDF publications into a flip-book with our unique Google optimized e-Paper software.
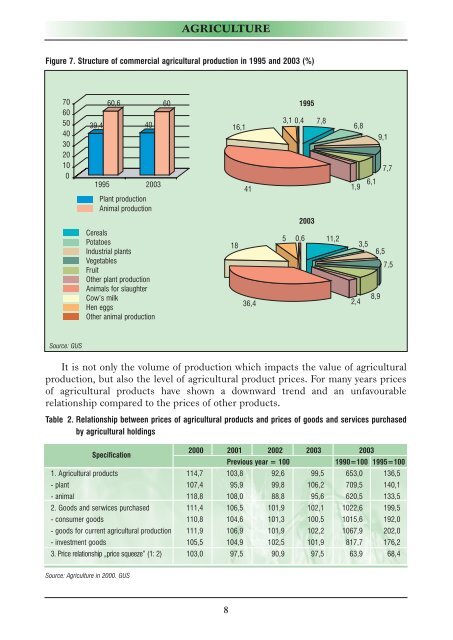
Figure 7. Structure of commercial agricultural production <strong>in</strong> 1995 <strong>and</strong> 2003 (%)<br />
70<br />
60<br />
50<br />
40<br />
30<br />
20<br />
10<br />
0<br />
Source: GUS<br />
39,4<br />
60,6<br />
It is not only the volume of production which impacts the value of agricultural<br />
production, but also the level of agricultural product prices. For many years prices<br />
of agricultural products have shown a downward trend <strong>and</strong> an unfavourable<br />
relationship compared to the prices of other products.<br />
Table 2. Relationship between prices of agricultural products <strong>and</strong> prices of goods <strong>and</strong> services purchased<br />
by agricultural hold<strong>in</strong>gs<br />
Source: Agriculture <strong>in</strong> 2000. GUS<br />
40<br />
1995 2003<br />
Plant production<br />
Animal production<br />
Cereals<br />
Potatoes<br />
Industrial plants<br />
Vegetables<br />
Fruit<br />
Other plant production<br />
Animals for slaughter<br />
Cow’s milk<br />
Hen eggs<br />
Other animal production<br />
60<br />
AGRICULTURE<br />
8<br />
16,1<br />
18<br />
41<br />
36,4<br />
3,1 0,4<br />
5 0,6<br />
1995<br />
2003<br />
7,8<br />
11,2<br />
6,8<br />
1,9<br />
2,4<br />
6,1<br />
3,5<br />
6,5<br />
7,5<br />
Specification<br />
2000 2001 2002<br />
Previous year = 100<br />
2003 2003<br />
1990=100 1995=100<br />
1. Agricultural products 114,7 103,8 92,6 99,5 653,0 136,5<br />
- plant 107,4 95,9 99,8 106,2 709,5 140,1<br />
- animal 118,8 108,0 88,8 95,6 620,5 133,5<br />
2. Goods <strong>and</strong> serwices purchased 111,4 106,5 101,9 102,1 1022,6 199,5<br />
- consumer goods 110,8 104,6 101,3 100,5 1015,6 192,0<br />
- goods for current agricultural production 111,9 106,9 101,9 102,2 1067,9 202,0<br />
- <strong>in</strong>vestment goods 105,5 104,9 102,5 101,9 817,7 176,2<br />
3. Price relationship „price squeeze” (1: 2) 103,0 97,5 90,9 97,5 63,9 68,4<br />
8,9<br />
9,1<br />
7,7