Assessment of water quality and quantity of Lake Nakuru, Kenya
Assessment of water quality and quantity of Lake Nakuru, Kenya
Assessment of water quality and quantity of Lake Nakuru, Kenya
You also want an ePaper? Increase the reach of your titles
YUMPU automatically turns print PDFs into web optimized ePapers that Google loves.
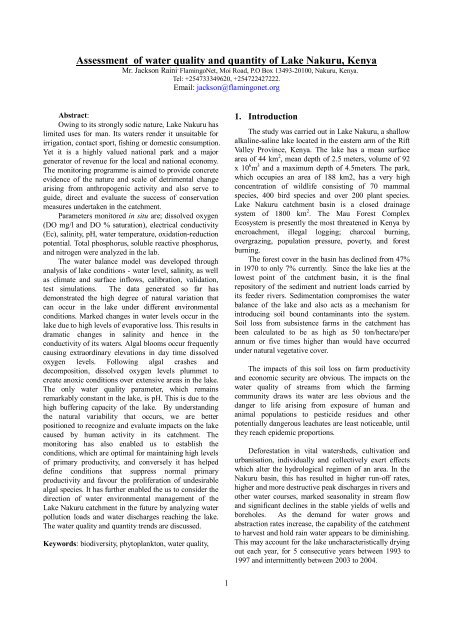
<strong>Assessment</strong> <strong>of</strong> <strong>water</strong> <strong>quality</strong> <strong>and</strong> <strong>quantity</strong> <strong>of</strong> <strong>Lake</strong> <strong>Nakuru</strong>, <strong>Kenya</strong>Mr. Jackson Raini , FlamingoNet, Moi Road, P.O Box 13493-20100, <strong>Nakuru</strong>, <strong>Kenya</strong>.Tel: +254733349620, +254722427222.Email: jackson@flamingonet.orgAbstract:Owing to its strongly sodic nature, <strong>Lake</strong> <strong>Nakuru</strong> haslimited uses for man. Its <strong>water</strong>s render it unsuitable forirrigation, contact sport, fishing or domestic consumption.Yet it is a highly valued national park <strong>and</strong> a majorgenerator <strong>of</strong> revenue for the local <strong>and</strong> national economy.The monitoring programme is aimed to provide concreteevidence <strong>of</strong> the nature <strong>and</strong> scale <strong>of</strong> detrimental changearising from anthropogenic activity <strong>and</strong> also serve toguide, direct <strong>and</strong> evaluate the success <strong>of</strong> conservationmeasures undertaken in the catchment.Parameters monitored in situ are; dissolved oxygen(DO mg/l <strong>and</strong> DO % saturation), electrical conductivity(Ec), salinity, pH, <strong>water</strong> temperature, oxidation-reductionpotential. Total phosphorus, soluble reactive phosphorus,<strong>and</strong> nitrogen were analyzed in the lab.The <strong>water</strong> balance model was developed throughanalysis <strong>of</strong> lake conditions - <strong>water</strong> level, salinity, as wellas climate <strong>and</strong> surface inflows, calibration, validation,test simulations. The data generated so far hasdemonstrated the high degree <strong>of</strong> natural variation thatcan occur in the lake under different environmentalconditions. Marked changes in <strong>water</strong> levels occur in thelake due to high levels <strong>of</strong> evaporative loss. This results indramatic changes in salinity <strong>and</strong> hence in theconductivity <strong>of</strong> its <strong>water</strong>s. Algal blooms occur frequentlycausing extraordinary elevations in day time dissolvedoxygen levels. Following algal crashes <strong>and</strong>decomposition, dissolved oxygen levels plummet tocreate anoxic conditions over extensive areas in the lake.The only <strong>water</strong> <strong>quality</strong> parameter, which remainsremarkably constant in the lake, is pH. This is due to thehigh buffering capacity <strong>of</strong> the lake. By underst<strong>and</strong>ingthe natural variability that occurs, we are betterpositioned to recognize <strong>and</strong> evaluate impacts on the lakecaused by human activity in its catchment. Themonitoring has also enabled us to establish theconditions, which are optimal for maintaining high levels<strong>of</strong> primary productivity, <strong>and</strong> conversely it has helpeddefine conditions that suppress normal primaryproductivity <strong>and</strong> favour the proliferation <strong>of</strong> undesirablealgal species. It has further enabled the us to consider thedirection <strong>of</strong> <strong>water</strong> environmental management <strong>of</strong> the<strong>Lake</strong> <strong>Nakuru</strong> catchment in the future by analyzing <strong>water</strong>pollution loads <strong>and</strong> <strong>water</strong> discharges reaching the lake.The <strong>water</strong> <strong>quality</strong> <strong>and</strong> <strong>quantity</strong> trends are discussed.Keywords: biodiversity, phytoplankton, <strong>water</strong> <strong>quality</strong>,1. IntroductionThe study was carried out in <strong>Lake</strong> <strong>Nakuru</strong>, a shallowalkaline-saline lake located in the eastern arm <strong>of</strong> the RiftValley Province, <strong>Kenya</strong>. The lake has a mean surfacearea <strong>of</strong> 44 km 2 , mean depth <strong>of</strong> 2.5 meters, volume <strong>of</strong> 92x 10 6 m 3 <strong>and</strong> a maximum depth <strong>of</strong> 4.5meters. The park,which occupies an area <strong>of</strong> 188 km2, has a very highconcentration <strong>of</strong> wildlife consisting <strong>of</strong> 70 mammalspecies, 400 bird species <strong>and</strong> over 200 plant species.<strong>Lake</strong> <strong>Nakuru</strong> catchment basin is a closed drainagesystem <strong>of</strong> 1800 km 2 . The Mau Forest ComplexEcosystem is presently the most threatened in <strong>Kenya</strong> byencroachment, illegal logging; charcoal burning,overgrazing, population pressure, poverty, <strong>and</strong> forestburning.The forest cover in the basin has declined from 47%in 1970 to only 7% currently. Since the lake lies at thelowest point <strong>of</strong> the catchment basin, it is the finalrepository <strong>of</strong> the sediment <strong>and</strong> nutrient loads carried byits feeder rivers. Sedimentation compromises the <strong>water</strong>balance <strong>of</strong> the lake <strong>and</strong> also acts as a mechanism forintroducing soil bound contaminants into the system.Soil loss from subsistence farms in the catchment hasbeen calculated to be as high as 50 ton/hectare/perannum or five times higher than would have occurredunder natural vegetative cover.The impacts <strong>of</strong> this soil loss on farm productivity<strong>and</strong> economic security are obvious. The impacts on the<strong>water</strong> <strong>quality</strong> <strong>of</strong> streams from which the farmingcommunity draws its <strong>water</strong> are less obvious <strong>and</strong> thedanger to life arising from exposure <strong>of</strong> human <strong>and</strong>animal populations to pesticide residues <strong>and</strong> otherpotentially dangerous leachates are least noticeable, untilthey reach epidemic proportions.Deforestation in vital <strong>water</strong>sheds, cultivation <strong>and</strong>urbanisation, individually <strong>and</strong> collectively exert effectswhich alter the hydrological regimen <strong>of</strong> an area. In the<strong>Nakuru</strong> basin, this has resulted in higher run-<strong>of</strong>f rates,higher <strong>and</strong> more destructive peak discharges in rivers <strong>and</strong>other <strong>water</strong> courses, marked seasonality in stream flow<strong>and</strong> significant declines in the stable yields <strong>of</strong> wells <strong>and</strong>boreholes. As the dem<strong>and</strong> for <strong>water</strong> grows <strong>and</strong>abstraction rates increase, the capability <strong>of</strong> the catchmentto harvest <strong>and</strong> hold rain <strong>water</strong> appears to be diminishing.This may account for the lake uncharacteristically dryingout each year, for 5 consecutive years between 1993 to1997 <strong>and</strong> intermittently between 2003 to 2004.1
Urban discharges into the environment <strong>of</strong> <strong>Nakuru</strong>pose a threat to human <strong>and</strong> wildlife. The practices <strong>of</strong>dumping urban waste in a geologically porous <strong>and</strong>fissured areas <strong>and</strong> discharging poorly or untreatedsewage <strong>and</strong> storm <strong>water</strong> into the lake are questionable interms <strong>of</strong> environmental safety.Contamination <strong>of</strong> the lake with pesticide residues,heavy metals <strong>and</strong> other associated contaminants hasalready occurred <strong>and</strong> appears to be growing problem.Enrichment <strong>of</strong> the lake with nutrients from agricultural<strong>and</strong> urban sources is also occurring giving rise to blooms<strong>of</strong> toxic algae which out-compete the natural biota <strong>of</strong> thelake.<strong>Lake</strong> <strong>Nakuru</strong> can be seen as "the canary in the cage".As the focal point for the interaction <strong>of</strong> a multiplicity <strong>of</strong>environmental effects brought about by natural events<strong>and</strong> anthropogenic activity in its catchment area, itprovides measure <strong>of</strong> the state <strong>of</strong> the environment. Thedegradation <strong>of</strong> the lake should serve as a warning that theenvironment is losing its vitality. The extinction <strong>of</strong> life inthe lake as we know it will be forewarning <strong>of</strong> the fatethat awaits the human occupants <strong>of</strong> the catchment basin.2. Methodology2.1 Data collectionIn situ measurements <strong>of</strong> basic <strong>water</strong> <strong>quality</strong>parameters were carried out from 1992, fortnightly at 8sampling sites in <strong>Lake</strong> <strong>Nakuru</strong> <strong>and</strong> at 5 sites alonginfluent streams <strong>and</strong> sewage channels. The sites are asfollows: (a) <strong>Lake</strong> shore gauges, (b) Mouth <strong>of</strong> RiverNjoro, (c) <strong>Lake</strong>shore drums, (d) Presidents pavilion, (e)Mouth <strong>of</strong> River Makalia, (f) Between Makalia & Nderit,(g) Mouth <strong>of</strong> River Nderit, (h) Kampi ya Nyati, <strong>and</strong> (i)Kampi ya Nyuki. River sampling sites were as follows (j)Baharini springs (k) Town sewage channel (l) RiverNjoro downstream (m) River Makalia downstream (n)River Nderit downstream. Pelagic sampling sites were asfollows: (1) Njoro River Mouth to Kambi Nyati transect(2) Drums to Sarova transect (3) PresidentPavilion to Point E transect, (4) <strong>Lake</strong> Shore gauges-Kampi ya Nyuki transect <strong>and</strong> (5) Makalia to Nderittransect.The lakeshore sites were accessed by wading. Arubber dingy or a fiber glass boat <strong>and</strong> a 15/40 hp Endurooutboard engine were used for sampling 10 mid lakesites located along 5 established transects. In the pelagiczone, <strong>water</strong> samples for vertical limnological pr<strong>of</strong>ileswere collected at different depths (0-4m) using a plasticvan dorn-type messenger closed sample bottle with acapacity <strong>of</strong> 1.25lts. The physico-chemical parameterswere measured in situ using a WTW multiline p4portable meter. The meter is fitted with drift-controlledcombined electrodes, <strong>and</strong> has an accuracy level <strong>of</strong> ±1 <strong>of</strong>measured value. Water transparency was measured usinga calibrated 20cm black <strong>and</strong> white Secchi disc.Parameters monitored were; dissolved oxygen (DO mg/l<strong>and</strong> DO % saturation), electrical conductivity (Ec),salinity, pH, <strong>water</strong> temperature, oxidation-reductionpotential (ORP).2.2 Laboratory analysisLab. analysis was done on replicate samples <strong>of</strong><strong>water</strong> stored in a cool box <strong>and</strong> later transferred to a fridge.Total phosphorus, soluble reactive phosphorus, <strong>and</strong>nitrogen were analyzed, in the lab using a HACHDR/2010 Spectrophotometer. Algal biomass wasestimated by using Chl a. Chlorophyll a (µg/l) wascalculated after reading the absorbance at 665 nm <strong>and</strong>750 nm. This was done after leaving the samples in arefrigerator for 23 hours in an extraction process using94.1 methanol. The Chl a represents 1.5 % <strong>of</strong> the dryweight <strong>of</strong> organic matter (ash-free weight) <strong>of</strong> algae. TheChl a content was multiplied by a factor <strong>of</strong> 67 (St<strong>and</strong>ardmethods, 1998). Algae identification was done using anOlympus compound microscope.Weather data was recorded from 1993 to 2002 at the<strong>Lake</strong> <strong>Nakuru</strong> National Park Weather Station No.9036359, located about 500 meters from the northernlakeshore (0o17’S, 36o04’E). River discharge volumewas measured using a Bargo calibrated OTT C 2 SmallCurrent Meter (Ref: # 10.150.005.B.E at the Baharinisprings (2FC17), R. Njoro (2FC15), R. Nderit (2FC16),R. Makalia (2FC18), R. Ngosur (2FC27). <strong>Lake</strong> levelswere measured at <strong>Lake</strong> <strong>Nakuru</strong> RGS 2FC14.The <strong>water</strong>balance model was developed through analysis <strong>of</strong> lakeconditions - <strong>water</strong> level, salinity, as well as climate <strong>and</strong>surface inflows, calibration, validation, test simulations.Calibration is done by using Excel's "goal seek" tool onRMSE value, adjusting the calibration terms to minimizethat value.3. Results3.1. Water & sediment <strong>quality</strong> monitoring3.1.1 Dissolved oxygenThe dissolved oxygen trends display spatial <strong>and</strong>temporal variations. During the study period, monthlymean DO levels in the lake were 8.7±7.7 mg/l with amedian <strong>of</strong> 7.7 mg/l (Fig 1&2). The highest levels wererecorded at theFig. 1. Mean monthly DO levels (mg/l).2
Peso depreciation is beneficialCurrency depreciation puts more pressure on countries which have chronic current account deficits likeIndia <strong>and</strong> Brazil.India registered a current account deficit equivalent to 4.8 percent <strong>of</strong> GDP in 2012, while Brazil had acurrent account deficit equivalent to 2.4 percent <strong>of</strong> GDP over the same period. The Philippines,meanwhile, had a current account surplus equivalent to 2.8 percent <strong>of</strong> GDP in 2012.So while the currency depreciation is bad for India <strong>and</strong> Brazil, it is actually beneficial to the Philippinesbecause <strong>of</strong> the continued strength in BPO revenues <strong>and</strong> OFW remittances, which would eventuallytranslate to higher domestic consumption.Fed policy to remain highly accommodative in the foreseeable future“Highly accommodative monetary policy for the foreseeable future is what is needed.” - Ben BernankeThis is another important quote that happened last week which propelled stock markets worldwide <strong>and</strong>caused currencies to rally against the US dollar. US stocks ended at record levels as the S&P 500 index<strong>and</strong> the Dow Jones Industrial Average registered new all-time highs while the Nasdaq ended at its bestclose since 2012.Emerging markets also rebounded with the iShares MSCI Emerging Markets Index (symbol: EEM)rallying 4.9 percent in Thursday’s trading. This reinforces our view that PSE Index has indeed made anintermediate bottom last June 25 when it hit an intraday low <strong>of</strong> 5,678 (see our article 5-6-7-8, July 1,2013).From a technical st<strong>and</strong>point, the chart below shows a potential Head <strong>and</strong> Shoulders reversal formation inthe PSE Index. If the 6,600 level is broken to the upside, this means that the PSE index will now go tothe next resistance at 7,000 <strong>and</strong> potentially retest the all-time high <strong>of</strong> 7,403 registered last May.Please visit our online trading platform at www.wealthsec.com or call 634-5038 for detailed stock marketresearch. You can also visit www.philequity.net to learn more about the Philequity Fund <strong>and</strong> view ourarchived articles. You can email us at feedback@philequity.net for feedback on the Philequity Cornerarticles.
The results showed that during the early morningsampling events the lake exhibited a slight thermalstratification. Due to the lakes' shallow depth thepersistence <strong>of</strong> the thermocline was limited to onlyseveral hours.The lake <strong>water</strong> pH was fairly constant, showingvery small fluctuations (Fig 7). The mean pH in L.<strong>Nakuru</strong> as measured at 8 sites was 10.2±0.7 with acorresponding median <strong>of</strong> 10.24. The lake wascharacterized by high phytoplankton or suspended solidscontent which inhibited <strong>water</strong> transparency. Seasonalvariations were quite distinct, with values <strong>of</strong> lower than5cm being recorded during the 1993-1997 periodcharacterized by very low lake levels. Annual meanSecchi disc transparency increased between 10cm to over25 cm in from 1997, showing much higher values duringrainfall seasons.Fig 7. Mean monthly pH at L. <strong>Nakuru</strong>Fig 5. Mean monthly <strong>water</strong> temperature (oC)3.2. Hydro-meteorological monitoringWater flows in perennial streams draining thebasin have become erratic <strong>and</strong> highly seasonal. The meanannual temperature ( o C) was 18.2 ±0.9, total evaporation(mm) 4,158,597; total rainfall (mm) 2,908,567, surfaceinflow from all inlets (m 3 ) was 1,033,968; ground <strong>water</strong>inflow (m 3 ) 464,013. The lake levels fluctuated, with arecorded mean depth <strong>of</strong> 1.9 meters.Fig. 5. Mean Temperature (Vertical pr<strong>of</strong>ile)Fig.8. Mean monthly weather parameters (Rainfall,Humidity <strong>and</strong> Evaporation)4
Fig.9. Average <strong>water</strong> balance.Fig.10. Mean monthly lake level vs. rain- evap. (mm)3.3. DiscussionThe long-term mean dissolved oxygen level ishigh (9.2±7.4mg/l). The DO levels vary from supersaturation to near anoxia as a function <strong>of</strong> stratification<strong>and</strong> high biological activity <strong>of</strong> the productive, naturalcommunity living the lake. Super saturation <strong>of</strong> dissolvedoxygen in the upper <strong>water</strong>s during the day <strong>of</strong>ten resultsfrom the high rates <strong>of</strong> photosynthesis (Melack & Kilham1974, Vareschi 1982). The fish in L. <strong>Nakuru</strong>,Sarotherodon alcalicus grahami is known to tolerate DOlevels as low as 3 mg/ l. Similarly, Arthrospira fusiformisproductivity is lowered significantly at DO levels <strong>of</strong>below 2 mg/l (Vareschi, 1982).The rate <strong>of</strong> change in conductivity that alsoinfluences Arthrospira growth was low, rarely exceeding2 mS/cm per week. Sampling sites located at Rivermouths recorded wide ranges due to dilution. Theconductivity <strong>of</strong> <strong>water</strong> increased from 20.38mS/cm (Sep.1973) to 23.28mS/cm (Jan. 1974) <strong>and</strong> then 25.18mS/cmby March 1974. This was accompanied by a decline <strong>of</strong>Chl a from 910-200 Chl a m-3. Detailed descriptions <strong>of</strong>the biotic responses are provided in (Melack 1979, 1981,1988, Vareschi 1982, Vareschi & Vareschi, 1984). Theconductivity tolerance threshold for copepod Lovenulaafricana range between 6 to 24 mS/cm (Vareschi 1982).The only <strong>water</strong> <strong>quality</strong> parameter, whichremains remarkably constant in the lake, is pH. This isdue to the high buffering capacity <strong>of</strong> the lake. The meanlong-term pH <strong>of</strong> the lake at the 8 lake sampling sites is10.2. Tuite (1978) reported a declined <strong>of</strong> pH from about10.45 in early 1974 to between 10-10.15 during most <strong>of</strong>the period 1974-1976. These pH changes or differencesmay among other factors be as a result <strong>of</strong> alterations inphotosynthetic activity by algae (Talling et al, cited byTuite 1978). The mean <strong>of</strong> 10.5 is that recorded by5between 1972-1979 Vareschi (1978, 1979, 1982) <strong>and</strong> isreported as the only environmental factor which remains“exceptionally constant” <strong>and</strong> unsusceptible to alkalinity<strong>and</strong> conductivity.Surface <strong>water</strong> temperature are typically 25-27oC (Vareschi, 1982) <strong>and</strong> have not changed much in thelast decade (10 year median=27.3 o C).As is typical <strong>of</strong> shallow, saline lakes, worldwide,climatic variations have caused large changes in depth<strong>and</strong> salinity on annual, decadal <strong>and</strong> longer time scales<strong>and</strong> have had major consequences for the ecology <strong>of</strong> thelake. Daily fluctuations in heating <strong>and</strong> cooling result instrong diel cycles <strong>of</strong> stratification <strong>and</strong> mixing (Melack &Kilham 1974). High insolation <strong>and</strong> adequate supply <strong>of</strong>nutrients usually support abundant phytoplankton (Peters& MacIntyre 1976, Melack et al. 1982, Vareschi 1982).The long term mean electrical conductivity(44.7±39.8mS/cm) is higher, compared to historicalvalues, Tuite, 1978 (mean = 23.8mS -1 ; Range: 15.3-39.28mS -1 ) Vareschi (1978, 1979, 1982) recorded a range<strong>of</strong> 8.5-165.5mS -1 . The lower <strong>and</strong> upper ranges have beenexceed in the last 10 years (5-222µS -1 ). The lower valueswere recorded during floods while upper ones duringdry-outs (1961 <strong>and</strong> between 1993-1997).During the study it was evident that somesamples were dominated by blue green algae formingblooms. These are Arthrospira fusiformis (=Spirulinaplatensis), Anabaenopsis magna, Anabaenopsis abijatae,Anabaena arnoldii, Anabaena flos aquae var. circinalis,Synechococcus elongates <strong>and</strong> Rhabdoderma linearis.Recently, cyanobacterial toxins were suggested aspotentially lethal agents for <strong>Lake</strong> <strong>Nakuru</strong> lesserflamingos (WWF, 1998, Krienitz et al 2003, 2005., Codeet al, 2003., Metcalf et al., 2006).The lesser flamingo <strong>and</strong> tilapia fish both sharethe same food base, which is formed by the cyanophyteArthrospira fusiformis. There have been a number <strong>of</strong>unexplained lesser flamingo <strong>and</strong> fish die-<strong>of</strong>fs in the pastin <strong>Lake</strong> <strong>Nakuru</strong>. Mass flamingo die <strong>of</strong>fs in 1993, 1995,100, 2002, 2004, (Beasley et al 2005), <strong>and</strong> 2006 (Raini,2009), raised concerns regarding populationsustainability. The lake experienced high populationfluctuation. The flamingo breeding attempt at <strong>Lake</strong><strong>Nakuru</strong> in 2001 flopped <strong>and</strong> over 3000 nests ab<strong>and</strong>oneddue to rapid <strong>water</strong> level recession. A fish kill occurred in1992 <strong>and</strong> fish stock failed to recover until 1998 due thepersistently low lake levels (Fig.10). As a result <strong>of</strong> thisdecline in fish population, the fish eating birds were verydifficult to find in the lake, a negative change inbiodiversity. The recent fish kill occurred in August 2004<strong>and</strong> was attributed to extreme oxygen depletion.The mean lake level has declined from 2.5 m to
1.9 meters. The preliminary <strong>water</strong> balance model is afirst attempt at underst<strong>and</strong>ing the lakes <strong>water</strong> budget.Better data (ground <strong>water</strong> recharge, rainfall <strong>and</strong> riverflow) should be used to re-calibrate the Water Balancemodel before a final <strong>water</strong> balance model can bedeveloped.3.2 Abbreviation <strong>and</strong> acronymsWTW-Wisesens-chaftlich Technische WerkstättenWeiheim, (Germany).DO-Dissolved OxygenWWF-World Wide Fund for Nature3.3. AcknowledgmentI wish to thank the management <strong>of</strong> the WWF <strong>and</strong> theDarwin Initiative for financing the study.3.4. ConclusionTo improve <strong>and</strong> maintain surface flows <strong>and</strong> <strong>water</strong> <strong>quality</strong>in the catchment, more information needs to be generatedon the status <strong>of</strong> <strong>water</strong> resources, with particular emphasison the current rates <strong>of</strong> utilization <strong>and</strong> the rate <strong>of</strong>replenishment <strong>and</strong> other changes that may affect theavailability <strong>and</strong> <strong>quality</strong> <strong>of</strong> <strong>water</strong>. . There is also need toestablish a framework for integration <strong>of</strong> sound <strong>and</strong>sustainable practices in resource management <strong>and</strong>development with regard to initiating programmesaimed at improving <strong>and</strong> maintaining <strong>water</strong> <strong>quality</strong> <strong>and</strong>balance in the catchment basin. A GIS database Manualfor Water Pollution & Hydrological Analysis Modulesdeveloped recently by JICA, if properly used, will helpin the calculation <strong>of</strong> pollution load, <strong>water</strong> <strong>quality</strong>, riverdischarge <strong>and</strong> lake levels.3.5 References1) Beasley Val, Aiyasami S.S, Motelin G., Pesier A.P.,Codd, G.A., Nelson M,N., Maddox C.W.,Carmichael W.W., Anderson M.D., Sileo L., KockR.A., Cooper J.E., Franson, J.C., Cooper W.E.,Kilewo, M.K., Mlengeya, T.K., Manyibe, T., RuizM.O(2006). Mass Die-<strong>of</strong>fs <strong>of</strong> Lesser Flamingo(Phoeniconaias minor) in East <strong>and</strong> Southern Africa.Current Knowledge <strong>and</strong> Priorities for Research.Manuscript No. 7017 submitted to the Journal <strong>of</strong>Wildlife Diseases.2) Tuite, C.H. (1978). The lesser flamingo (P. minorGe<strong>of</strong>froy) Aspects <strong>of</strong> its ecology <strong>and</strong> Behaviour inthe Eastern Rift Valley <strong>Lake</strong> <strong>of</strong> <strong>Kenya</strong> <strong>and</strong> NorthernTanzania, a Ph.D. thesis submitted to the Univ.Bristol.3) Harper D.M, R. Brooks Childress, Mauren, M.Harper, Rosalind R. Boar, Phil Hickley, Susanne C.Mills, Nickson Otieno, Tony Drane, EkkehardVareschi, Oliver Nasirwa, Wanjiru E. Mwatha,Joanna P.E.C. Darlington & Xiavier Escute’-Gasulla ( 2003). Aquatic biodiversity <strong>and</strong> salinelakes: <strong>Lake</strong> Bogoria national Reserve, <strong>Kenya</strong>. K.Martens (ed.) Aquatic Biodiversity. KluwerAcademic Publishers, Netherl<strong>and</strong>s.4) Childress B., Harper D., Hughes B., Bossche W.,Berthold P., Querner U. (2004). Satellite trackingLesser Flamingo movements in the Rift Valley, EastAfrica: pilot study report. Ostrich, 2004, 75(1&2):57-65.5) Ballot A., Krienitz, L., Kotut, K., Wieg<strong>and</strong>, C.,Metcalf, S. J., Codd, G.A., Pflugmacher, S. (2004).Cyanobacteria <strong>and</strong> cyanobacterial toxins in threealkaline Rift Valley lakes <strong>of</strong> <strong>Kenya</strong>-<strong>Lake</strong>s Bogoria,<strong>Nakuru</strong> <strong>and</strong> Elementeita.6) Japan Bank for International Cooperation (JBIC)(2002b) Final report for special assistance forproject sustainability (SAPS II) for Greater <strong>Nakuru</strong><strong>water</strong> supply project in the republic <strong>of</strong> <strong>Kenya</strong>. JapanBank for International Cooperation, Tokyo, Japan.7) Ballot, A.,L., Krienitz, Kotut, C. Wieg<strong>and</strong>, J.S.Metcalf, G.A. Codd, <strong>and</strong> S. Pflugmacher,2004.Cyanobacteria <strong>and</strong> cyanobacterial toxins in threealkaline Rift Valley lakes <strong>of</strong> <strong>Kenya</strong>-<strong>Lake</strong>s Bogoria,<strong>Nakuru</strong> <strong>and</strong> Elmenteita. Journal <strong>of</strong> PlanktonResearch 26:925-935.8) ILEC (2005). Managing <strong>Lake</strong>s <strong>and</strong> their Basins forSustainable Use. A Report for <strong>Lake</strong> Basin Managers<strong>and</strong> Stakeholders. International <strong>Lake</strong> EnvironmentCommittee Foundation: Kusatsu, Japan.9) JICA (1994). <strong>Nakuru</strong> Sewage Works Rehabilitation<strong>and</strong> Expansion Project Feasibility Study FinalReport.10) JICA (2002). Final Report for Special Assistance forProject Sustainability II.11) <strong>Kenya</strong> Wildlife Service (2002). <strong>Lake</strong> <strong>Nakuru</strong>Integrated Ecosystem Management plan 2002- 2012.Plan developed in collaboration with Netherl<strong>and</strong>sGovernment, KWS, MCN, WWF, Moi University,<strong>and</strong> University <strong>of</strong> Nairobi.12) American Public Health Association, AmericanWater Works Association, <strong>and</strong> Water PollutionControl Federation.1995. St<strong>and</strong>ard Methods for theExamination <strong>of</strong> Water <strong>and</strong> Waste<strong>water</strong>, 19 th ed.American Public Health Association, Washington,DC.6


