Guruge, W.A.H.P, Amarasinghe N.J.De. S
Guruge, W.A.H.P, Amarasinghe N.J.De. S
Guruge, W.A.H.P, Amarasinghe N.J.De. S
You also want an ePaper? Increase the reach of your titles
YUMPU automatically turns print PDFs into web optimized ePapers that Google loves.
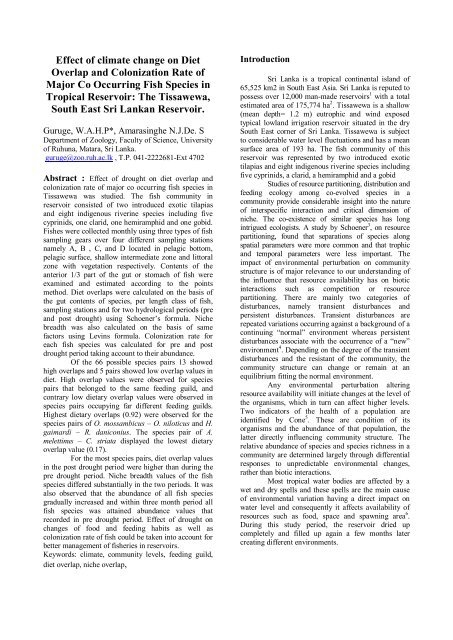
Effect of climate change on DietOverlap and Colonization Rate ofMajor Co Occurring Fish Species inTropical Reservoir: The Tissawewa,South East Sri Lankan Reservoir.<strong>Guruge</strong>, W.A.H.P*, <strong>Amarasinghe</strong> N.J.<strong>De</strong>. S<strong>De</strong>partment of Zoology, Faculty of Science, Universityof Ruhuna, Matara, Sri Lanka.guruge@zoo.ruh.ac.lk , T.P. 041-2222681-Ext 4702Abstract : Effect of drought on diet overlap andcolonization rate of major co occurring fish species inTissawewa was studied. The fish community inreservoir consisted of two introduced exotic tilapiasand eight indigenous riverine species including fivecyprinids, one clarid, one hemiramphid and one gobid.Fishes were collected monthly using three types of fishsampling gears over four different sampling stationsnamely A, B , C, and D located in pelagic bottom,pelagic surface, shallow intermediate zone and littoralzone with vegetation respectively. Contents of theanterior 1/3 part of the gut or stomach of fish wereexamined and estimated according to the pointsmethod. Diet overlaps were calculated on the basis ofthe gut contents of species, per length class of fish,sampling stations and for two hydrological periods (preand post drought) using Schoener’s formula. Nichebreadth was also calculated on the basis of samefactors using Levins formula. Colonization rate foreach fish species was calculated for pre and postdrought period taking account to their abundance.Of the 66 possible species pairs 13 showedhigh overlaps and 5 pairs showed low overlap values indiet. High overlap values were observed for speciespairs that belonged to the same feeding guild, andcontrary low dietary overlap values were observed inspecies pairs occupying far different feeding guilds.Highest dietary overlaps (0.92) were observed for thespecies pairs of O. mossambicus – O. niloticus and H.gaimardi – R. daniconius. The species pair of A.melettinus – C. striata displayed the lowest dietaryoverlap value (0.17).For the most species pairs, diet overlap valuesin the post drought period were higher than during thepre drought period. Niche breadth values of the fishspecies differed substantially in the two periods. It wasalso observed that the abundance of all fish speciesgradually increased and within three month period allfish species was attained abundance values thatrecorded in pre drought period. Effect of drought onchanges of food and feeding habits as well ascolonization rate of fish could be taken into account forbetter management of fisheries in reservoirs.Keywords: climate, community levels, feeding guild,diet overlap, niche overlap,IntroductionSri Lanka is a tropical continental island of65,525 km2 in South East Asia. Sri Lanka is reputed topossess over 12,000 man-made reservoirs 1 with a totalestimated area of 175,774 ha 2 . Tissawewa is a shallow(mean depth= 1.2 m) eutrophic and wind exposedtypical lowland irrigation reservoir situated in the drySouth East corner of Sri Lanka. Tissawewa is subjectto considerable water level fluctuations and has a meansurface area of 193 ha. The fish community of thisreservoir was represented by two introduced exotictilapias and eight indigenous riverine species includingfive cyprinids, a clarid, a hemiramphid and a gobidStudies of resource partitioning, distribution andfeeding ecology among co-evolved species in acommunity provide considerable insight into the natureof interspecific interaction and critical dimension ofniche. The co-existence of similar species has longintrigued ecologists. A study by Schoener 3 , on resourcepartitioning, found that separations of species alongspatial parameters were more common and that trophicand temporal parameters were less important. Theimpact of environmental perturbation on communitystructure is of major relevance to our understanding ofthe influence that resource availability has on bioticinteractions such as competition or resourcepartitioning. There are mainly two categories ofdisturbances, namely transient disturbances andpersistent disturbances. Transient disturbances arerepeated variations occurring against a background of acontinuing “normal” environment whereas persistentdisturbances associate with the occurrence of a “new”environment 4 . <strong>De</strong>pending on the degree of the transientdisturbances and the resistant of the community, thecommunity structure can change or remain at anequilibrium fitting the normal environment.Any environmental perturbation alteringresource availability will initiate changes at the level ofthe organisms, which in turn can affect higher levels.Two indicators of the health of a population areidentified by Cone 5 . These are condition of itsorganisms and the abundance of that population, thelatter directly influencing community structure. Therelative abundance of species and species richness in acommunity are determined largely through differentialresponses to unpredictable environmental changes,rather than biotic interactions.Most tropical water bodies are affected by awet and dry spells and these spells are the main causeof environmental variation having a direct impact onwater level and consequently it affects availability ofresources such as food, space and spawning area 6 .During this study period, the reservoir dried upcompletely and filled up again a few months latercreating different environments.
Materials and methodsTo study environmental stress caused bydrought and changing water level on the fishcommunities the fish community in the reservoir wassampled on a monthly basis. Four different types ofmacrohabitat were available within the reservoir. Thefour sampling stations, A, B, C, and D are eachrepresentative for one of these four macrohabitat typesA - bottom layer of open water zone; B - pelagic zone(surface layer of open water); C - shallow intermediatezone (without vegetation); and D - littoral zone withvegetation (figure 1).Fig 1:Morphometric map of Tissawewa, withwater depths measured at a water level of4.2 m and a maximum depth of 3.3 m.Position of the sampling station areindicated on a transect from west (left) toeast (right).Sampling was carried out with four types of gear. Thedistribution of the sampling gears over the stations isgiven in Table 1.Tab 1: Distribution of sampling gears over fourstationsGear typeGill netsBottom trawlLarvae netCast netSampling stationA,B,C and DA and CB and DA,C and DFish sampled from small mesh nets (meshsizes ranging from 12.5 to 37 mm stretched mesh) wereused for gut content analysis to determine feedingbehaviour of fish. Small mesh nets were set at 0600hours and lifted at 0800 hours for day-time samplingwhile for the night time sampling setting time was1800 and lifting time was 2000 hours. To preventdigestion of gut contents small mesh size nets werekept only 2 hrs in the water. Since the feeding habitsand behavior of the fish species depend on the size ofthe fish, each species was divided into six lengthclasses. The six length classes and their respectivelengths are given in Table 2.Fish were brought into the laboratory fordetailed analysis and in the laboratory emphasis was ongut content analysis, gut fullness. For gut contentanalysis the percentage of the biovolume per fooditems were used. This is the modified point method ofHynes 7 .Maximum of contents of ten stomachs or first1/3 of the alimentary track (for stomachless fish) persize group per species per station was pooled and thissample was subjected to gut content analysis.Following categories of food item was identified.Animal food organisms: fish, shrimp, adult insects(aquatic or terrestrial), insect larvae (mainlychironomids, chaoborus and others), mollusc(gastropods and bivalves), zooplankton (copepodscladocereans and rotifer), microbenthos (harpactocoids,cladocerens and ostracods), and poriferons spicules.Plant materials consisted of: macrophytes, filamentousalgae (benthic and planktonic), other phytoplanktonand pollen and seeds. Digested matter or/and detritusand an organic materials were also recorded.Tab 2: The six length classes and their respectivelengths.Length classesL1L2L3L4L5L6Total length (cm)3.0 - 4.44.5 - 6.97.0 - 9.910.0 - 13.914.0 - 18.9> 19.0Diet overlap (S) between each pair of speciesand any two size classes of particular fish species wasdetermined using Schoener’s 8 formula;S = 1- 0.5 (S ai=1 n ½P xi -P yi ½).Where S is the dietary overlap coefficient of fishspecies x and y, P xi is the proportion of food category“i” in the diet of species “x”, P yi is the proportion offood category “i” in the diet of species “y”, and n is thenumber of food categories.The values for this similarity index range from0.00 to 1.00, with 1.00 indicating complete overlap and0.00 indicating no overlap. The similarity indices having
values less than 0.33 were considered to indicate a lowoverlap while the values above 0.67 were considered toindicate high overlap 9 .The niche breadth was calculated for each fishspecies using the niche breadth coefficient, b i 10 .b i = -S n j=1p j * log pj.Where p j is the proportion of food category “j”consumed by species “i”, b i is the niche breadthcoefficient of a fish species “i”, and n is the number ofresource states available.Diet overlaps were calculated on basis of the gutcontents of species, length classes per species,sampling stations and for two hydrological periods i.e.pre drought period and post drought period. For thedata analysis SPSS (ver 10) statistical package wereused. Spatial, temporal and size related feedingbehaviour relate to gut contents was investigated usingANOVA.ResultGut/stomach contents of co-occurring fish speciesin Tissawewa irrespective to sampling station, fishingtime, fishing gear, and length class of the fish wereshown in Tab 3.Amblypharyngodon melattinus (AM) highlydepend on detritus matter and algae (seston), and assuch, can be classified as a member of thedetritivorous/herbivorous feeding guild. Oreochromis.mossambicus (OM) and Oreochromis. niloticus (ON)and Tilapia. rendalli (TR) mainly feed on macrophytes,algae and detritus, and therefore belong to the samefeeding guild. Barbus. chola (BC), Barbus. dorsalis(BD) and Barbus. sarana (BS) mainly feed on, benthicand insect matter and this three fishes represent thebenthivorous feeding guild. Gut contents of theGlossogobius. girius (GG), Channa. striata (CS) andMystus (MYS) species showed a high percentage of theprey fishes and therefore these fish species representthe piscivorous feeding guild. Hyporamphus. gaimardi(HG) and Rasbora. daniconius (RD) represented thezooplanktivorous feeding guilds.Dietary overlapThe similarity indices of the diets among thedifferent species studied are shown in Table 4. Of the66 possible species pairs 13 (» 20%) showed highoverlaps and 5 pairs (» 7.5%) showed low overlapvalues in diet. High overlap values were observed forspecies pairs belong to the same feeding guild, andcontrary low dietary overlap values were observed inspecies pairs of far different feeding guild i.e.detritivorous and piscivorous. Highest dietary overlaps(0.92) were observed for species pairs of OM-ON andHG-RD. pecies pairs belonging to the detritivorousfeeding guild and to the piscivorous feeding guild, withthe exception of the species pairs of MYS-CS and CS-GG, displayed high dietary overlap values (³ 0.80).Species pairs of AM- CS displayed lowest dietaryoverlap value (0.17).Tab 3: Gut/stomach contents of co-occurring fish species in Tissawewa irrespective to sampling station, fishing time,fishing gear, and length class of the fish. Letters on top of bars indicate significantly different groups recordedfrom student-newman-keuls test. Similar letters indicate non- significantly different groups. Abbreviations usedfor fish species are Amblypharyngodon melattinus (AM), Barbus. chola (BC), B. dorsalis (BD), B. sarana (BS),Channa. striata (CS), Glossogobius. girius (GG), Hyporamphus. gaimardi (HG), Mystus (MYS), Oreochromis.mossambicus (OM) O. niloticus (ON), Rasbora. daniconius (RD) , Tilapia. rendalli (TR). Abbreviations usedfor food category are Shri: Shrimp, Inse: Insect matter, Mollu: Mollusc, Zoop: Zooplankton, Micro:Microbenthos, Macr: Macrophytes, Pori: Poriferan spicules, P/S: Pollen and seeds, Di/<strong>De</strong>: Digested and detritusmattersfood itemsfish species fish shrimp insects mollu zoop micro macr algae pori p/s di/deAM a 0.00 0.00 0.71 0.00 3.28 0.09 0.38 18.95 0.04 0.07 76.49BC b 0.00 0.00 24.29 3.08 9.25 15.47 2.10 0.59 0.56 2.07 42.60BD b 0.00 0.00 36.06 12.13 6.55 12.87 1.03 0.62 0.14 2.06 28.53BS b 3.75 0.00 19.74 34.34 3.39 1.71 5.71 1.86 1.39 1.29 26.82CS c 53.40 0.00 30.50 0.00 0.10 0.00 0.60 0.50 0.00 0.00 14.90GG c 31.60 3.13 24.11 0.43 5.18 1.61 0.64 0.02 0.01 0.05 33.21HG d 0.00 0.00 16.20 0.00 38.74 0.17 10.78 1.14 0.08 0.00 32.89MYS c 16.88 0.30 25.24 0.17 18.95 1.32 0.85 0.81 0.08 0.17 35.23OM e 0.33 0.00 4.28 0.00 5.62 0.42 3.99 23.78 1.85 0.16 59.56ON e 1.19 0.00 1.23 0.00 3.58 0.02 11.99 18.86 2.61 0.00 60.52TR e 7.30 0.00 4.73 0.00 2.11 0.00 27.78 7.86 10.41 2.16 37.65RD d 0.00 0.00 22.40 0.11 37.85 0.44 2.56 1.75 0.04 0.08 34.77
Tab 4: Diet overlaps (s) among twelve co-occurring fish species in Tissawewa. n= number of fish species dissected forgut content analysis. For species abbreviation see table 4.4 in chapter 4. High overlap values (³ 0.67) are boldand underlined, and low overlap values (£0.33) are in italics and bold.N Fish species AM BC BD BS CS GG HG MYS OM ON RD TR2294 AM - 0.48 0.34 0.35 0.17 0.38 0.39 0.41 0.83 0.80 0.41 0.493005 BC - 0.79 0.61 0.40 0.65 0.61 0.72 0.57 0.57 0.70 0.502395 BD - 0.69 0.47 0.61 0.53 0.64 0.41 0.41 0.60 0.391251 BS - 0.40 0.57 0.54 0.57 0.45 0.48 0.56 0.4927 CS - 0.71 0.32 0.58 0.21 0.23 0.38 0.281120 GG - 0.55 0.82 0.44 0.45 0.62 0.521197 HG - 0.71 0.62 0.67 0.92 0.541712 MYS - 0.48 0.48 0.78 0.512557 OM - 0.92 0.50 0.58410 ON - 0.50 0.662531 RD - 0.4695 TR -Dietary overlaps in eleven co occurring fishspecies pairs during the pre drought period (= period 1)and the post drought period (= period 2) in theTissawewa are shown in Figure 3. For the most speciespairs dietary overlap values in the post drought periodwere higher than during the pre drought period. Of the10 possible species pairs in combination with AM inboth periods 1 and 2, two pairs recorded high overlaps,while in period 1, two pairs recorded low overlaps andin period 2, this dropped to one pair. In BC, out of 11possible species pairs, during period 1 one pair of eachshowedhigh and low overlaps, whereas in period 2, highoverlaps increased to 5 species pairs and no lowoverlaps were recorded (Figure 3). Of the 11 possiblespecies combination with BD, in period 1, one speciespair recorded high dietary overlap and in period 2, fourpairs recorded high overlaps and no species pairrecorded low overlaps. A similar trend was observedfor BS too. Of the 11 possible species pairs of BS, inperiod 1, none of species combination recorded highoverlaps, but in period 2, four pairs (57 %) indicatedhigh overlaps.Tab 5: Diet overlaps (s) among eleven co-occurring fish species in Tissawewa in two periods, the pre drought period(white dotted column) and the post drought period (dark column) species are compared pair wise, comparison iswith the species in the right hand corner of each figure with the species listed on the y-axis. Small overlaps are< 0.33, large overlaps are > 0.67. For number of observations per fish species see table 7.1. For speciesabbreviations see Figure 3.. Numbers next to the species legend indicates two periods, 1: pre-drought and 2:post-drought period.pre (1) and postfish species(2) drought period AM BC BD BS CS GG HG MYS OM ON RDAM1 0.51 0.31 0.31 0.01 0.37 0.42 0.38 0.85 0.84 0.39AM2 0.41 0.35 0.40 0.27 0.35 0.33 0.49 0.69 0.69 0.48BC1 0.75 0.50 0.19 0.59 0.58 0.62 0.59 0.55 0.64BC2 0.88 0.80 0.48 0.72 0.65 0.82 0.55 0.55 0.77BD1 0.63 0.30 0.52 0.45 0.53 0.38 0.33 0.54BD2 0.81 0.48 0.71 0.60 0.80 0.49 0.50 0.72BS1 0.16 0.47 0.39 0.47 0.41 0.41 0.43BS2 0.49 0.70 0.67 0.78 0.60 0.60 0.79CS1 0.55 0.08 0.41 0.03 0.03 0.17CS2 0.68 0.43 0.51 0.39 0.41 0.49GG1 0.51 0.85 0.44 0.41 0.59GG2 0.56 0.75 0.48 0.49 0.70HG1 0.66 0.49 0.45 0.91HG2 0.67 0.50 0.52 0.74MYS1 0.45 0.41 0.74MYS2 0.61 0.61 0.83OM1 0.91 0.45OM2 0.98 0.65ON1 0.41ON2 0.65
Eleven possible species pairs in combination with CS,8 species recorded low dietary overlaps in period 1 andin period 2, only 2 pairs recorded low overlap values.Of the 11 species pairs in combination with GG, inperiod 1 only one pair recorded high overlap and inperiod 2, the pairs of high overlaps increased to 6 pairs.Niche breadthNiche breadth values of twelve co-occurringfish species calculated for the whole research period,the pre drought period, and the post drought period arepresented in Table 4.Tab 6: Niche breadth values of twelve co-occurringfish species in Tissawewa over the wholeresearch period, the pre drought period and thepost drought period. For the speciesabbreviations refer Table 3.Fishspecies OverallPre droughtperiodPost droughtperiodAM 1.61 1.51 1.95BC 3.62 3.37 3.45BD 4.04 4.63 2.63BS 4.54 3.69 3.49CS 2.50 2.01 2.67GG 3.67 3.20 3.59HG 3.38 2.31 3.49MYS 3.96 3.84 2.96OM 2.39 2.13 3.64ON 2.64 2.25 3.65RD 3.17 2.69 3.58BC, BD, BS, GG, and MYS species showed arelatively large niche breadth (b i > 3.6) based on foodresources used and thus are more general feeders. Incontrast, AM recorded a narrow niche breadth value (b i< 2.00) indicating specialized feeders. CS and OMwere marginally specialized in food utilization and RDand HG are moderately specialized feeders. However,the niche breadth values of the respective speciesdiffered substantially in the two periods niche breadthvalues of AM, BC, CS, GG, HG, OM, ON, and RDrecorded in the post drought period was higher than inthe post drought period. However, increase of nichebreadth values of HG, OM, ON and RD from predrought period to post drought period was much higherthan for other species. It is also noticed that nichebreadth values of BD and MYS species observed in thepost drought period was much lower than in the predrought period.DiscussionThe measurement of resource overlap among fishspecies remains a problem. When resource availabilitydata are absent, the Schoener’s index is one of the leastobjectionable indexes available 11 . The mean of thevolume percentages appears to be the most appropriatediet measure.Niche overlap between two fish speciesquantifies the sharing of food and habitat resourcecategories between two species. Fish species belong tothe same feeding guild recorded high niche overlaps.For example species pairs of AM-OM, AM-ON,represent herbivore/detritivore feeding guild. Majorfood categories of their diet include detritus matter,algae and low proportions of zooplankton. Gut contentsof these three species indicate more or less the sameproportion of above major food categories. Of the 66possible species pairs, species pairs of OM-ON, andHG-RD recorded the highest niche overlaps. Formerspecies pair represents the detritivorous feeding guildand the latter represent the zooplanktivorous feedingguild. The highest niche overlap value of HG-RD pairattributed to the same proportion of insect matter andzooplankton in the guts of these two species. Speciepairs of AM-CS, CS-OM, CS-ON, CS-TR, and CS-HGdisplayed lower niche overlaps. These species pairsrepresent very distinct feeding guilds, i.e. detritivorouspiscivorousand piscivorous-zooplanktivorous. In AM-CS species combination, apart from low proportion ofdetritus matters, gut contents of these two species includecompletely different food categoriesIn the present study it was well documented thatniches overlaps for possible species pair of particular fishspecies was substantially different in the twohydrological periods, i.e. pre and post drought period.More species pairs exhibited high niche overlaps duringthe post drought period than during the pre droughtperiod. This can be explained by major environmentaland ecological changes that occurred in the post droughtperiod. The impact of environmental perturbations oncommunity structure is of major relevance to ourunderstanding of the influence that resource availabilityhas on biotic interactions such as competition. Duringthis sampling period different types of disturbances wereobserved. The major disturbance was caused by aprogressively decreasing water level, which lead tocomplete dryness of the reservoir. After the drought, adifferent ecosystem had evolved. Before the droughtTissawewa was dominated by detritus matter andphytoplankton, whereas following the refilling of thereservoir it was dominated by zooplankton. After thefilling of the reservoir, predation risk also increased dueto low water turbidity. Due to the above discussedecosystem changes, diet overlaps increased considerablyafter the drought period.Niche breadth quantifies the diversity or breadthof the food resources utilized by a given species. Nichebreadth and niche overlap within feeding guilds are ofteninversely related, the higher the niche breadth the lowersthe niche overlap. The fish species such as BD, BS, andMYS species utilize a vast variety of food categories andconsequently these species reveal high niche breadthvalues compared to other fish species. Niche breadth of
BS, BD, and MYS species get decreased in post droughtperiod. This can be attributed to the major foodcategories consumed by these species. Especially, BSmainly depends heavily on molluscs and insect mattersand due to the desiccation in the drought period themollusc populations declined. Consequently, thesesspecies switched to a larger spectrum of food resourcesthat were available in the environment at that time.The drought caused persistence disturbanceduring which, as long as it remains, the community canexperience other problems depending on the waterlevel. Effect of drought on changes of food and feedinghabits of fish could be taken into account for bettermanagement of fisheries in reservoirs.References1. Baldwin. M.F 1991. Natural resources of SriLanka: conditions and trends. Natural resources,energy and science authority of Sri Lanka,colombo.260 p2. <strong>De</strong> Silva, S.S. 1988. Reservoirs in Sri Lanka andtheir fisheries. FAO Fisheries technical paper No.298, 128 pp3. Schoener, T.W.1974 Resource partitioning inecological communities. Science 185: 27-394. Begon, M. Harper, J.L, Townsend, C.R. 1986.EcologyBlackwell Sceintific Publication, Oxford.876 p.5. Cone, R.S. 1989. The need to reconsider the use ofcondition indices in fishery science. Trans.Amer.Fish.Soc. 118: 510-514.6. Kalk, M., Mc Lachian, A.J, & Howard-Williams,C. 1979. Lake Chilawa. Studies of change intropical ecosystem. Monographiae BiologicaeVolume 35. Dr. W. Junk Publishers, The Hague.462 p.7. Hynes, H.B.N. 1950. The food of fresh-watersticklebacks (Gasterosteus aculeatus andpygosteus pungitius) with a review of methodsused in studies of the food of fishes. J. Anim. Ecol.19: 36-588. Schoener, T.W. 1970. Nonsynchronus spatialoverlap of lizards in patchy habitats. Ecology.51:408-418.9. Moyle, P.B. & Senanayake, F.R.1984. Resourcepartitioning among fishes of rainforest streams inSri Lanka. J. Zool. Lond. 202: 195-223.10. Levins, R. 1968. Evolution in changingenvironments:Some theoretical explorations.Princeton University press, Princeton.11. Wallace, R.K. 1981. An assessment of diet-overlapindexes. Trans. Am. Fish. Soc. 110:72-76AcknowledgementFinancial support from the Netherlands Foundation forthe advancement of Tropical Research (WOTRO), thecentre for Limnology of the Netherlands Institute ofEcology is highly acknowledged.


