The State of Water in Kosovo, 2010
The State of Water in Kosovo, 2010
The State of Water in Kosovo, 2010
- No tags were found...

You also want an ePaper? Increase the reach of your titles
YUMPU automatically turns print PDFs into web optimized ePapers that Google loves.
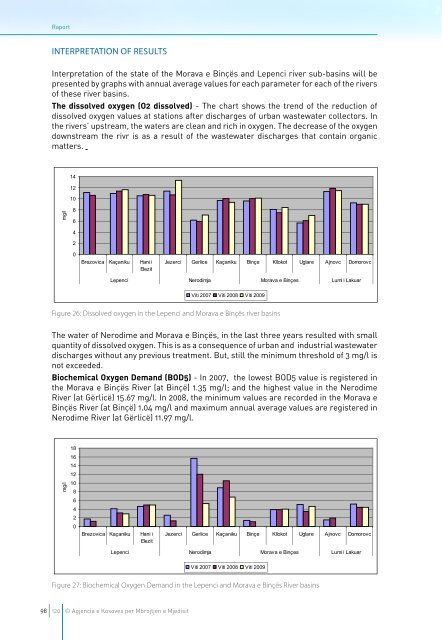
RaportInterpretation <strong>of</strong> resultsInterpretation <strong>of</strong> the state <strong>of</strong> the Morava e B<strong>in</strong>çës and Lepenci river sub-bas<strong>in</strong>s will bepresented by graphs with annual average values for each parameter for each <strong>of</strong> the rivers<strong>of</strong> these river bas<strong>in</strong>s.<strong>The</strong> dissolved oxygen (O2 dissolved) - <strong>The</strong> chart shows the trend <strong>of</strong> the reduction <strong>of</strong>dissolved oxygen values at stations after discharges <strong>of</strong> urban wastewater collectors. Inthe rivers’ upstream, the waters are clean and rich <strong>in</strong> oxygen. <strong>The</strong> decrease <strong>of</strong> the oxygendownstream the rivr is as a result <strong>of</strong> the wastewater discharges that conta<strong>in</strong> organicmatters.141210mg/l86420Brezovica Kaçaniku Hani iElezitJezerci Gerlice Kaçaniku B<strong>in</strong>çe Kllokot Uglare Ajnovc DomorovcLepenci Nerodimja Morava e B<strong>in</strong>çes Lumi i LakuarViti 2007 Viti 2008 Viti 2009Figure 26: Dissolved oxygen <strong>in</strong> the Lepenci and Morava e B<strong>in</strong>çës river bas<strong>in</strong>s<strong>The</strong> water <strong>of</strong> Nerodime and Morava e B<strong>in</strong>çës, <strong>in</strong> the last three years resulted with smallquantity <strong>of</strong> dissolved oxygen. This is as a consequence <strong>of</strong> urban and <strong>in</strong>dustrial wastewaterdischarges without any previous treatment. But, still the m<strong>in</strong>imum threshold <strong>of</strong> 3 mg/l isnot exceeded.Biochemical Oxygen Demand (BOD5) - In 2007, the lowest BOD5 value is registered <strong>in</strong>the Morava e B<strong>in</strong>çës River (at B<strong>in</strong>çë) 1.35 mg/l; and the highest value <strong>in</strong> the NerodimeRiver (at Gërlicë) 15.67 mg/l. In 2008, the m<strong>in</strong>imum values are recorded <strong>in</strong> the Morava eB<strong>in</strong>çës River (at B<strong>in</strong>çë) 1.04 mg/l and maximum annual average values are registered <strong>in</strong>Nerodime River (at Gërlicë) 11.97 mg/l.mg/l181614121086420Brezovica Kaçaniku Hani iElezitJezerci Gerlice Kaçaniku B<strong>in</strong>çe Kllokot Uglare Ajnovc DomorovcLepenci Nerodimja Morava e B<strong>in</strong>çes Lumi i LakuarViti 2007 Viti 2008 Viti 2009Figure 27: Biochemical Oxygen Demand <strong>in</strong> the Lepenci and Morava e B<strong>in</strong>çës River bas<strong>in</strong>s98120 © Agjencia e Kosoves per Mbrojtjen e Mjedisit