Separated by a Common Currency? Evidence from the Euro ... - IDEA
Separated by a Common Currency? Evidence from the Euro ... - IDEA
Separated by a Common Currency? Evidence from the Euro ... - IDEA
- No tags were found...

You also want an ePaper? Increase the reach of your titles
YUMPU automatically turns print PDFs into web optimized ePapers that Google loves.
<strong>Separated</strong> <strong>by</strong> a <strong>Common</strong> <strong>Currency</strong>?<strong>Evidence</strong> <strong>from</strong> <strong>the</strong> <strong>Euro</strong> Changeover Arturo BrisIMD<strong>Euro</strong>pean Corporate Governance InstituteYale International Center for FinanceAugusto Rupérez MicolaUniversitat Pompeu FabraIMDMarch 3, 2008 Bris is <strong>from</strong> IMD, Chemin de Bellerive 23, P.O. Box 915, CH-1001 Lausanne, Switzerland. Tel: +41 21 6180111;fax: +41 21 618 0707, email: arturo.bris@imd.ch. Rupérez Micola (corresponding author) is <strong>from</strong> IMD, Chemin deBellerive 23, P.O. Box 915, CH-1001 Lausanne, Switzerland. Tel: +41 21 6180111; fax: +41 21 618 0716, email:augusto.ruperezmicola@imd.ch.
AbstractWe study <strong>the</strong> price convergence of goods and services in <strong>the</strong> euro area in 2001-2002. To measure <strong>the</strong> degreeof convergence, we compare <strong>the</strong> prices of around 220 items in 32 <strong>Euro</strong>pean cities. The width of <strong>the</strong> borderis <strong>the</strong> price di¤erence attributed to <strong>the</strong> fact that <strong>the</strong> two cities are in di¤erent countries. We …nd that<strong>the</strong> 2001 <strong>Euro</strong>pean borders are negative, which suggests that <strong>the</strong> markets were very integrated before <strong>the</strong>euro changeover. Moreover, we do not identify an integration e¤ect attributable to <strong>the</strong> introduction of <strong>the</strong>euro. We <strong>the</strong>n explore <strong>the</strong> determinants of <strong>the</strong> <strong>Euro</strong>pean borders. We …nd that di¤erent languages, wealthand population di¤erences tend to split <strong>the</strong> markets. Historical in‡ation, though, tends to lead to priceconvergence.
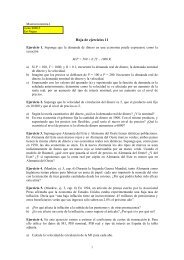
IIntroductionIn 1992, <strong>the</strong> E.U. “resolved to achieve <strong>the</strong> streng<strong>the</strong>ning and <strong>the</strong> convergence of <strong>the</strong>ir economies and toestablish an economic and monetary union including [...]a single and stable currency” as part of <strong>the</strong>Maastricht Treaty (E.U., 1992). Ten years later, in January 2002, twelve <strong>Euro</strong>pean countries began using<strong>the</strong> euro as <strong>the</strong>ir common currency. 1 The euro (e) was intended to increase international price transparency,as this would ideally foster competition, locational arbitrage and cross-border trade (Rose and Wincoop,2001; Frankel and Rose, 2002), which should result in price convergence.However, post-euro price disparities across — and within— countries were still prevalent in 2002. Figure1 summarizes <strong>the</strong> prices of toothpaste, fast-food, CDs, electricity, dentist visits and daily newspapers across<strong>Euro</strong>pean cities.It seems clear that <strong>the</strong> convergence was not perfect and that travellers in 2002 paiddi¤erent prices for identical items in di¤erent locations. For example, <strong>the</strong> price of toothpaste in Viennawas more than twice that of Munich (e3.42 against e1.42). In an expanded version of <strong>the</strong> classic Big Macexample, <strong>the</strong> price of a fast-food menu consisting of hamburger, fries and drink went for e3.75 in Lisbonbut e5 in Madrid. Figure 1 is only a small example based on our larger dataset, but similar disparitieswere found across <strong>the</strong> <strong>Euro</strong>pean continent for a wide range of products.In <strong>the</strong> present paper we study <strong>the</strong> magnitude of those disparities and some of <strong>the</strong>ir causes, as well as<strong>the</strong> magnitude of a possible convergence due to <strong>the</strong> euro changeover.We …rst characterize price di¤erences among <strong>Euro</strong>pean cities <strong>by</strong> computing <strong>the</strong> width of <strong>the</strong> borderbetween two countries in kilometers implied <strong>by</strong> price di¤erences, on a large sample of traded goods. Suchmethodology follows <strong>the</strong> pioneering study <strong>by</strong> Engel and Rogers (1996) 2 — E&R henceforth.1 On 1-January, 2002, <strong>the</strong> citizens in twelve <strong>Euro</strong>pean Union (EU) countries began to phase out <strong>the</strong>ir national currenciesand use <strong>the</strong> euro - e. The countries involved were Austria, Belgium, Finland, France, Germany, Greece, Ireland, Luxembourg,Ne<strong>the</strong>rlands, Portugal and Spain.Smaller non-EU countries such as <strong>the</strong> Co-Principality of Andorra, <strong>the</strong> Principalities ofLiechtenstein and Monaco, <strong>the</strong> Republic of San Marino and Vatican City were already using some of <strong>the</strong> EU currencies and,hence, were also included in <strong>the</strong> changeover. Denmark, Sweden and <strong>the</strong> United Kingdom decided not to join <strong>the</strong> single currencyat that time, in spite of being EU members. On 1-January, 2007, <strong>the</strong> original euro countries were joined <strong>by</strong> Slovenia.The irrevocably …xed changeover rates between each of <strong>the</strong> thirteen national currencies and <strong>the</strong> euro were determined <strong>by</strong>dividing <strong>the</strong> market value of <strong>the</strong> euro <strong>by</strong> that of each participating currency. The conversions occurred based on <strong>the</strong> exchangerate in December 1998 for 11 of <strong>the</strong> original currencies, in December 2000 for <strong>the</strong> Greek drachma and in June 2004 for <strong>the</strong>Slovenian Tolar.2 E&R (1996) use data for US and Canadian cities to show how <strong>the</strong> variation in <strong>the</strong> prices of similar goods is much higherfor two cities located in di¤erent countries than for two equidistant cities in <strong>the</strong> same country. They …nd that <strong>the</strong> existenceof a border corresponds approximately to 75,000 miles. Sticky nominal prices account for part of <strong>the</strong> border e¤ect but mostof it is left unexplained.1
Price Toothpaste with fluoride (120 g) (supermarket)Cornflakes (375 g) (supermarket)4332Price (EUR)2Price (EUR)110AMSTERDAMATHENSBARCELONABELGRADEBERLINBRATISLAVABRUSSELSBUCHARESTBUDAPESTCOPENHAGENDUBLINDUSSELDORFFRANKFURTGENEVAHAMBURGHELSINKIKIEVLISBONLONDONLUXEMBOURGLYONMADRIDMANCHESTERMILANMUNICHOSLOPARISPRAGUEREYKJAVIKROMESOFIASTOCKHOLMVIENNAWARSAWZURICH0AMSTERDAMATHENSBARCELONABELGRADEBERLINBRATISLAVABRUSSELSBUCHARESTBUDAPESTCOPENHAGENDUBLINDUSSELDORFFRANKFURTGENEVAHAMBURGHELSINKIKIEVLISBONLONDONLUXEMBOURGLYONMADRIDMANCHESTERMILANMUNICHOSLOPARISPRAGUEREYKJAVIKROMESOFIASTOCKHOLMVIENNAWARSAWZURICHCityCityElectricity, monthly bill (average)Compact disc album (average)2504020030Price (EUR)150100Price (EUR)2050100AMSTERDAMATHENSBARCELONABELGRADEBERLINBRATISLAVABRUSSELSBUCHARESTBUDAPESTCOPENHAGENDUBLINDUSSELDORFFRANKFURTGENEVAHAMBURGHELSINKIKIEVLISBONLONDONLUXEMBOURGLYONMADRIDMANCHESTERMILANMUNICHOSLOPARISPRAGUEREYKJAVIKROMESOFIASTOCKHOLMVIENNAWARSAWZURICH0AMSTERDAMATHENSBARCELONABELGRADEBERLINBRATISLAVABRUSSELSBUCHARESTBUDAPESTCOPENHAGENDUBLINDUSSELDORFFRANKFURTGENEVAHAMBURGHELSINKIKIEVLISBONLONDONLUXEMBOURGLYONMADRIDMANCHESTERMILANMUNICHOSLOPARISPRAGUEREYKJAVIKROMESOFIASTOCKHOLMVIENNAWARSAWZURICHCityCityPaperback novel (at bookstore) (average)Daily local newspaper (average)202.52151.5Price (EUR)10Price (EUR)150.50AMSTERDAMATHENSBARCELONABELGRADEBERLINBRATISLAVABRUSSELSBUCHARESTBUDAPESTCOPENHAGENDUBLINDUSSELDORFFRANKFURTGENEVAHAMBURGHELSINKIKIEVLISBONLONDONLUXEMBOURGCityLYONMADRIDMANCHESTERMILANMUNICHOSLOPARISPRAGUEREYKJAVIKROMESOFIASTOCKHOLMVIENNAWARSAWZURICH0AMSTERDAMATHENSBARCELONABELGRADEBERLINBRATISLAVABRUSSELSBUCHARESTBUDAPESTCOPENHAGENDUBLINDUSSELDORFFRANKFURTGENEVAHAMBURGHELSINKIKIEVLISBONLONDONLUXEMBOURGCityLYONMADRIDMANCHESTERMILANMUNICHOSLOPARISPRAGUEREYKJAVIKROMESOFIASTOCKHOLMVIENNAWARSAWZURICHFigure 1: Prices of Toothpaste, Fast-food, CDs, Electricity,Dentist visits and Daily newspapers across <strong>Euro</strong>pean citiesFor example, <strong>the</strong> physical distance Madrid-Barcelona is very similar to Madrid-Lisbon (501 kms. vs.502 kms.) but prices might be di¤erent. In 2002, …ve razor blades cost e2.70 in Madrid, e2.71 in2
Barcelona, and e2.74 in Lisbon. The 501 kms. which separate Madrid and Barcelona translate into aone-cent di¤erence in <strong>the</strong> price of razor blades. Therefore, <strong>the</strong> four-cent di¤erence between Madrid andLisbon implies a physical distance of 2,004 kms.. Given that <strong>the</strong> actual distance is 502 kms., we estimatean implicit width of <strong>the</strong> border between Spain and Portugal of 1,502 kms.. The advantages of <strong>the</strong> borderwidth, compared to simpler price di¤erences, are that: (i) It is easily interpretable; (ii) It is comparableacross di¤erent items; and (iii) It takes into account <strong>the</strong> physical distance between cities when assessingprice divergences.The positive border e¤ect is well-known in <strong>the</strong> literature.E&R identi…ed it between Canada and<strong>the</strong> United States. The same authors identi…ed it across <strong>Euro</strong>pean countries (Engel and Rogers, 2001),as did Parsley and Wei (2001) between Japan and <strong>the</strong> US. Supporting <strong>the</strong> importance of currency as amarket uni…cation factor, Hardouvelis et al. (2006) found that euro stock markets converged towards fullintegration amongst <strong>the</strong>mselves but not with <strong>the</strong> UK, who stayed out of <strong>the</strong> euro .Many cross-country studies of consumer prices (including Engel and Rogers, 2001) use price index data.However, indices are problematic to assess price level di¤erences because <strong>the</strong>y depend on di¤erent referencelevels, so that one can only test whe<strong>the</strong>r prices have converged proportionally, i.e. in reference to unknownbase values. We, on <strong>the</strong> contrary, follow Engel and Rogers (2004) 3 and use <strong>the</strong> speci…c items includedin <strong>the</strong> Economist Intelligence Unit (EIU) city data. We select tradable goods, 4 and apply <strong>the</strong> bordersmethodology to all possible pairs. We measure <strong>the</strong> widths of <strong>the</strong> borders between cities in 24 <strong>Euro</strong>peancountries and <strong>the</strong> six <strong>Euro</strong>pean nations with at least two cities in <strong>the</strong> dataset: France, Italy, Germany,Spain, Switzerland and <strong>the</strong> United Kingdom. By using non-euro and non-E.U. countries we control forprice convergence driven <strong>by</strong> factors o<strong>the</strong>r than <strong>the</strong> common currency.In direct contrast to previous …ndings, our borders are largely negative both before and after <strong>the</strong>changeover.We show that international traded prices are relatively more similar between <strong>the</strong>m thannational prices. This implies that prices are not proportional to geographical distances in <strong>Euro</strong>pe, whichsuggests that <strong>Euro</strong>pean cities are economically closer than what <strong>the</strong>ir distances seem to suggest.Secondly, we analyze some economic, social and cultural determinants of <strong>the</strong> 2001 <strong>Euro</strong>pean borders’widths. We conjecture that borders will be wider (less negative) when <strong>the</strong> two countries speak di¤erentlanguages, as language acts as a trade barrier. Moreover, price disparity could grow on <strong>the</strong> cities’wealth andsize disparity: prices could be more similar between cities with comparable GDP per capita and populations.3 However, Engel and Roberts (2004) take 1999 as <strong>the</strong>ir date for <strong>the</strong> introduction of <strong>the</strong> euro. That year corresponds to itsintroduction as a virtual currency for …nancial transactions. We study <strong>the</strong> introduction of actual euro bank notes and coins.4 EIU includes also non traded, such as "Haircut, without tip" and real estate.3
Fur<strong>the</strong>r, national capitals might have more similar prices between <strong>the</strong>mselves than with non-capitals. Inaddition, measures of cultural a¢ nity, trust and o<strong>the</strong>rs should lead to less price dispersion.We examine <strong>the</strong>se issues both through general regressions and speci…c cases. The <strong>Euro</strong>pean setting isamongst <strong>the</strong> richest in <strong>the</strong> world to study those issues and <strong>the</strong>ir e¤ects on price convergence. For example,while some countries are <strong>the</strong> only ones to speak a language, e.g. Italy, Spain or Finland, some o<strong>the</strong>rs shareit. The language in both Germany and Austria (both euro countries) is German. Belgium, Luxembourgand France are French speaking but Belgium also shares Dutch with The Ne<strong>the</strong>rlands. Fur<strong>the</strong>r, Irelandshares English with <strong>the</strong> UK, which stayed out of <strong>the</strong> euro in spite of being a E.U. member, and we have datafor Swiss cities in both French- (Geneva) and German-speaking (Zurich) cantons. In addition, we use <strong>the</strong>Duchy of Luxembourg and Belgium, two di¤erent countries with <strong>the</strong> same currency. We …rst hypo<strong>the</strong>sizethat, pre-euro , prices should be more similar between Luxembourg and Belgium than between ei<strong>the</strong>r oneand any o<strong>the</strong>r country. Fur<strong>the</strong>r, we hypo<strong>the</strong>size that <strong>the</strong> euro changeover should have had less in‡uence in<strong>the</strong>ir price disparity because <strong>the</strong> currency e¤ect should be alleviated. We consider o<strong>the</strong>r speci…c situationsto study <strong>the</strong> issues of language and capital status. Finally, we include o<strong>the</strong>r possibly important culturalfeatures.On <strong>the</strong> whole, our empirical results are widely supportive of <strong>the</strong> conjectures. We …nd that language,toge<strong>the</strong>r with di¤erences in country size and city wealth, increase price disparities. If one country is twiceas large as ano<strong>the</strong>r, price di¤erences between two cities <strong>from</strong> each country are 100 meter wider. A onepercent di¤erence in GDP per capita between two cities increases <strong>the</strong> width of <strong>the</strong> border <strong>by</strong> about 30meters. When two cities <strong>from</strong> di¤erent countries speak <strong>the</strong> same language, <strong>the</strong> width of <strong>the</strong> border is twokilometers narrower (although this result is only weakly signi…cant) than o<strong>the</strong>rwise. Our results are robustand appear consistently in several econometric speci…cations.With respect to macroeconomic …gures, we show that historical in‡ation naturally results in relativeprice changes. We compute <strong>the</strong> di¤erence in in‡ation between two cities in <strong>the</strong> period 1996-2001, and …ndthat it has a signi…cant e¤ect on price convergence in 2001, which is just an indication of <strong>the</strong> e¤ectivenessof <strong>the</strong> Maastricht convergence process. Indeed <strong>the</strong> previous results are stronger when <strong>the</strong> two countriesbelong to <strong>the</strong> <strong>Euro</strong>pean Union, and in particular to <strong>the</strong> euro area.Thirdly, we use <strong>the</strong> changeover as a natural experiment in which to study whe<strong>the</strong>r moving <strong>from</strong> manyto a single currency has any e¤ect on price convergence. Our idea is that so long as <strong>the</strong>re are manycurrencies in <strong>Euro</strong>pe, citizens are discouraged <strong>from</strong> engaging in international purchases because of <strong>the</strong>complexity of understanding prices expressed in di¤erent currencies, which will undermine <strong>the</strong>ir arbitrageopportunities. In an extreme example of this, Asplund and Friberg (2001) identify price di¤erences for <strong>the</strong>4
same goods in <strong>the</strong> same duty-free shops when expressed in Swedish kronor and Finnish markka. This barrierto international arbitrage should have been removed for <strong>the</strong> currencies participating in <strong>the</strong> changeover.In fact, we …nd that <strong>the</strong> changeover has had a negligible e¤ect on <strong>the</strong> integration of consumer goodmarkets. The only euro country whose border width with o<strong>the</strong>r euro countries signi…cantly changes upon<strong>the</strong> introduction of <strong>the</strong> common currency is Italy. However <strong>the</strong> Italian border becomes 3:9 kilometers wider,not narrower. Instead, <strong>the</strong> border between <strong>the</strong> U.K. and euro countries is 3:9 kilometers narrower in 2002than in 2001. In Germany <strong>the</strong> e¤ect of <strong>the</strong> euro changeover is not signi…cant, yet it signi…cantly reducesits borders with E.U., non-euro cities 6:2 kilometers. Our results are suggestive of progressive integrationstarting with <strong>the</strong> <strong>Euro</strong>pean single market in 1993, followed <strong>by</strong> changes in expectations as a result of <strong>the</strong>euro introduction. The integration seems to have been accomplished <strong>by</strong> <strong>the</strong> time national exchange rateswere irrevocably …xed against <strong>the</strong> euro in 1999. However <strong>the</strong> bene…ts of paying with <strong>the</strong> same currencyare economically meaningless. Overall, <strong>from</strong> 2001 to 2002, <strong>the</strong>re is more price convergence between citiesinside <strong>the</strong> <strong>Euro</strong>pean Union, than for cities inside <strong>the</strong> euro area. Fur<strong>the</strong>rmore, prices have converged <strong>the</strong>most between cities in <strong>Euro</strong>land, and cities in <strong>the</strong> EU but outside <strong>the</strong> euro (e.g. between London andDublin).Our analysis produces some o<strong>the</strong>r interesting …ndings. For instance, we …nd that in 2001 internationalprice convergence within <strong>Euro</strong>land was stronger for <strong>the</strong> following items: food (perishables andnon-perishables), alcohol, and recreation. In contrast, in 2001 price convergence was signi…cantly strongerin <strong>the</strong> <strong>Euro</strong>pean Union at large, relative to <strong>the</strong> euro area, for <strong>the</strong> following items: personal care, housesupplies, cars, and tobacco. On balance, <strong>the</strong> common currency itself does not induce any signi…cant priceconvergence. Interestingly, though, it does not lead to signi…cant price divergences ei<strong>the</strong>r— in contrast to acommon perception. We also provide results on price convergence depending on <strong>the</strong> magnitude of prices.We …nd that <strong>by</strong> 2001 <strong>the</strong> products whose prices had converged most in <strong>the</strong> euro area were those prices ofitems below 10euro (for <strong>the</strong>m, <strong>the</strong> border was 37 kilometers narrower between euro countries). However,<strong>the</strong> introduction of <strong>the</strong> euro in 2002 signi…cantly increased price divergence for items below 10e, and thoseabove 100e. These results are consistent with Dziuda and Mastrobuoni (2006), who show that consumersbase <strong>the</strong>ir perceptions of in‡ation on items that are cheaper. Indeed Dziuda and Mastrobuoni (2006) showthat cheaper products experience higher price increases after <strong>the</strong> introduction of <strong>the</strong> euro, yet <strong>the</strong> overallin‡ationary e¤ect of <strong>the</strong> common currency was negligible.The recent literature includes some papers studying <strong>the</strong> causes of in‡ation (or of its lack) upon <strong>the</strong>introduction of <strong>the</strong> <strong>Euro</strong>pean single currency, including price stickiness (Angeloni et al., 2006; Álvarez etal., 2006), menu costs (Hobijn et al. 2006) and cognitive rules of thumb (Bris et al., 2007b). Some o<strong>the</strong>r5
papers have analyzed international price convergence upon <strong>the</strong> 2002 euro changeover (Rogers, 2002; Lutz,2002; and Baye et al., 2002). We are <strong>the</strong> …rst to compare price convergence within <strong>the</strong> euro area, withprice convergence outside, and in that sense we can truly identify <strong>the</strong> e¤ect of <strong>the</strong> introduction of <strong>the</strong> euro.Finally, we analyze whe<strong>the</strong>r any of <strong>the</strong> elements integrating <strong>the</strong> border have colluded with <strong>the</strong>changeover and led to price convergence. We …nd that cultural a¢ nity is a pre-condition for a commoncurrency to work. More speci…cally, we …nd that bilateral trust (we use <strong>the</strong> measurement <strong>by</strong> Guisoet al., 2007) has a negative e¤ect on <strong>the</strong> border width change between 2001 and 2002. When we splitour sample depending on euro membership, we …nd that such negative impact is concentrated only amongeuro countries. A one-standard deviation increase in bilateral trust (standard deviation=0:17) betweentwo countries in <strong>Euro</strong>land reduces border width <strong>by</strong> about 250 meters. However, <strong>the</strong> same increase intrust between two countries in <strong>the</strong> <strong>Euro</strong>pean Union, but outside <strong>Euro</strong>land , does not have any signi…cante¤ect. We use o<strong>the</strong>r indices of cultural a¢ nity, like <strong>the</strong> index of Cultural Openness computed <strong>by</strong> <strong>the</strong>IMD World Competitiveness Center. The more culturally open two countries are, <strong>the</strong> narrower <strong>the</strong> priceborder becomes in 2002. Again, this result is signi…cant only for cities in euro countries. Finally, bilateraltrade (<strong>the</strong> sum of imports and exports between two countries), which we deem <strong>the</strong> result of economica¢ nity, leads to price convergence as well. A one-standard deviation increase in bilateral trade (standarddeviation=e29:6 billion) decreases <strong>the</strong> border width <strong>by</strong> about three kilometers <strong>from</strong> 2001 to 2002 in <strong>the</strong>euro area. Interestingly, <strong>the</strong> e¤ect is stronger for countries in <strong>the</strong> <strong>Euro</strong>pean Union, but outside <strong>the</strong> euro:for <strong>the</strong>se countries <strong>the</strong> border width reduces <strong>by</strong> about 8:6 kilometers. We conclude that for <strong>the</strong> euro to bea successful endeavour in terms of price convergence, <strong>the</strong> expansion of its borders will have to go naturallytowards countries that share similar cultural values and economic attitudes.We believe that our …ndings have profound implications. We provide speci…c patterns of price convergencein <strong>the</strong> <strong>Euro</strong>pean Union, and predict what might happen when o<strong>the</strong>r countries adopt <strong>the</strong> euro. Allcountries joining <strong>the</strong> E.U. after 2001 are expected to change over as soon as <strong>the</strong>y ful…l some macroeconomicconvergence criteria (a budget de…cit of less than 3 % of GDP, a debt ratio of less than 60 % of GDP, lowin‡ation and interest rates close to <strong>the</strong> E.U. average). Hence, <strong>the</strong> list of changeovers is likely to include in<strong>the</strong> medium term <strong>the</strong> ten Central and Eastern <strong>Euro</strong>pean currencies which joined on 1 May 2004, as wellas any o<strong>the</strong>r future members. 5The remaining of <strong>the</strong> paper is organized as follows: In section II we describe <strong>the</strong> dataset and method-5 A …rst case where our paper would have been useful was to forecast <strong>the</strong> outcomes of <strong>the</strong> Slovenian changeover in Jan-2007.Unfortunately, we lack price data about Ljubljana, <strong>the</strong> Slovenian capital, or any o<strong>the</strong>r city in <strong>the</strong> country. That informationwould have been useful to make an out-of-sample analysis of our results.6
ology, and in section III we focus on <strong>the</strong> calculation of border widths. Section IV reports <strong>the</strong> results ofour tests of <strong>the</strong> size of <strong>the</strong> <strong>Euro</strong>pean borders widths and of <strong>the</strong>ir possible reduction upon <strong>the</strong> changeover.Section V empirically addresses <strong>the</strong> issue of <strong>the</strong>ir linguistic and cultural determinants. Finally, we concludein Section V.IIAData and SourcesCity DataOur primary source is <strong>the</strong> "City Data" dataset released <strong>by</strong> The Economist Intelligence Unit –EIU–, whichdetails <strong>the</strong> price on individual, homogeneous retail items in similar outlets for a large number of citiesaround <strong>the</strong> world. EIU does not provide indices but individual, "scanner", prices.We obtain detailed price information for 299 goods and services in 33 cities <strong>from</strong> 24 <strong>Euro</strong>pean countries.Table 1 lists <strong>the</strong> cities in our dataset with language and currency information. The table also includes<strong>the</strong> number of items for which <strong>the</strong>re is price information. There is data for all E.U.-15 countries as wellas o<strong>the</strong>rs outside <strong>the</strong> E.U., or with accession after 2002. Our sample includes all capitals except Bernfor Switzerland. Out of <strong>the</strong> 33 cities, 19 cities participated in <strong>the</strong> 2002 euro changeover, eight Western<strong>Euro</strong>pean ones did not participate, ei<strong>the</strong>r because <strong>the</strong>ir countries were not members of <strong>the</strong> E.U. (Geneva,Oslo, Reykjavik and Zurich) or in spite of that (Copenhagen, London, Manchester and Stockholm). Inaddition, <strong>the</strong>re are six Eastern <strong>Euro</strong>pean cities.[Insert Table 1]In 19 cases, <strong>the</strong>re is only data for <strong>the</strong> country’s capital (i.e. Lisbon, Prague, Stockholm,...). However,for reasons we discuss fur<strong>the</strong>r below, countries with more than one city are critical to <strong>the</strong> calculationof <strong>the</strong> border widths. We have data for at least two locations in <strong>the</strong> following countries: Italy (Milanand Rome), France (Lyon and Paris), Germany (Berlin, Dusseldorf, Frankfurt, Hamburg and Munich)and Spain (Barcelona and Madrid) within <strong>Euro</strong>land; and Switzerland (Geneva and Zurich) and <strong>the</strong> UK(Manchester and London) outside of <strong>Euro</strong>land.There are at least 20 languages spoken across <strong>the</strong> dataset. Some of <strong>the</strong>m are spoken in only one city(e.g. Portuguese in Lisbon, Danish in Copenhagen), and in two cases <strong>the</strong> language is only spoken in twolocations of <strong>the</strong> same country (Italy and Spain). There are also four languages spoken in several countries:7
French is spoken in Brussels (Belgium), France, Luxembourg and <strong>the</strong> Swiss city of Geneva. Dutch is spokenin <strong>the</strong> Ne<strong>the</strong>rlands but also in bilingual Brussels. British and Irish (Dublin) cities use English. German isspoken in Vienna (Austria) and Zurich (Switzerland) plus in all …ve German sites.Previous to <strong>the</strong> changeover, each country had its own currency with only one exception: a …xedparity of 1:1 between <strong>the</strong> Belgian (BFF) and Luxembourg Franc meant that <strong>the</strong> two currencies were usedinterchangeably in practice. In 2002, 12 countries experienced <strong>the</strong> changeover ("euro countries") and <strong>the</strong>rest remained with <strong>the</strong> same currencies as in 2001.Despite its advantages and <strong>the</strong> di¢ culty in …nding o<strong>the</strong>r data, <strong>the</strong> EIU dataset has its own limitations(Engel and Rogers, 2004). The data are collected for a very limited number of outlets in each city comparedto national surveys. Typically, <strong>the</strong>re is only one observation for a discount outlet and premium supermarket.Second, packaging is not uniform across countries and EIU standardizes prices to account for that. Forexample, if <strong>the</strong> good is "Canned tomatoes, 500 grams" but that good is sold in 400 grams units only in asupermarket, <strong>the</strong>y provide us with <strong>the</strong>ir observed price plus 25% to correct for <strong>the</strong> packaging di¤erence.Thirdly, <strong>the</strong> EIU measures prices of comparable goods but does not distinguish product quality di¤erences,nor accounts for di¤erent perceptions of product quality across countries.In <strong>the</strong> Appendix Table I we report pairwise distances (in kilometers) between <strong>the</strong> cities in our dataset.Physical distance is essential when calculating price distance. Physical distances range <strong>from</strong> a minimum of113 kms. (Lyon-Geneva) to a maximum of 3,362 kms. (Lisbon-Kiev). Naturally, distances are on averagesmaller nationally than internationally but <strong>Euro</strong>pean cities are physically closer than what national borderswould suggest. In fact, <strong>the</strong>re are several cases in which one can identify similar equidistant national andinternational city pairs. For example, <strong>the</strong> distances Madrid- Barcelona and Madrid-Lisbon are very similar(501 kms. and 502 kms. respectively). Moreover, <strong>the</strong> distance Geneva-Zurich (223 kms.) is higherthan Geneva-Lyon (113 kms.), and approximately of <strong>the</strong> same magnitude as Geneva-Milan (255 kms.),and Zurich-Milan (216 kms.). In fact, 245 kms. Zurich-Munich across <strong>the</strong> Swiss-German border areconsiderably more than Munich-Hamburg (611 kms.) within Germany.The discussion above suggests that our city sample is rich in peculiarities. For example, Geneva andZurich share national border and currency, but not language. Luxembourg is an independent country butshares currency and language with o<strong>the</strong>rs. Brussels is bilingual in French and Dutch, but with its owncurrency. The dataset includes Western <strong>Euro</strong>pean countries which did not join <strong>the</strong> euro, ei<strong>the</strong>r because <strong>the</strong>ywere outside <strong>the</strong> E.U. (such as Iceland, Norway and Switzerland) or because <strong>the</strong>y opted out (Denmark,Sweden and UK), as well as Eastern <strong>Euro</strong>pean countries. In <strong>the</strong> empirical results part, we will drawselectively <strong>from</strong> <strong>the</strong>se special cases to illustrate <strong>the</strong> main e¤ects revealed <strong>by</strong> our regressions.8
One of our main claims is that <strong>the</strong> border might be disguising economic and social di¤erences betweencities, including wealth and population di¤erences or national capital e¤ects. Therefore, we include thosevariables in our dataset. The GDP per capita data is mainly based on Parkinson et al. (2004). Thepopulation data comes primarily <strong>from</strong> <strong>the</strong> "City Mayors" association website. Whenever city-speci…c GDPper capital was not available, we use <strong>the</strong> country’s GDP per capita <strong>from</strong> <strong>the</strong> World Bank DevelopmentIndicators database. 6 We also report price indices <strong>by</strong> city in 2001 and 2002 as reported <strong>by</strong> EIU. Thesevariables are in Table 2.[Insert Table 2]BProduct DataThe list of items for which we have price information is detailed in Table 3. Obviously <strong>the</strong>re are goodsand services for which price convergence is di¢ cult if not impossible, even in <strong>the</strong> presence of a commoncurrency. This is <strong>the</strong> case for non-tradable goods, like haircuts or restaurant meals. Consequently <strong>the</strong> focusof our paper is on tradable goods. Out of <strong>the</strong> 299 items in our dataset, we classify 217 of <strong>the</strong>m as tradableand 82 as non-tradable. We follow <strong>the</strong> classi…cation <strong>by</strong> Engel and Roberts (2004) and our own criteria.With respect to <strong>the</strong> Engel and Roberts (2004) classi…cation, our grouping di¤ers in two aspects. First,we classify tobacco products as tradable even though Engel and Roberts (2004) classify <strong>the</strong>m as "o<strong>the</strong>r"because of <strong>the</strong>ir speci…c tax treatment. However, within tradable items we consider tobacco products as aspecial subcategory. Second, <strong>the</strong>re are 32 items that <strong>the</strong>y do not classify in ei<strong>the</strong>r group because of <strong>the</strong>irparticular characteristics (example: o¢ ce space rentals), but we include <strong>the</strong>m in <strong>the</strong> "non-tradable" group.[Insert Table 3]In Table 3 we also show <strong>the</strong> classi…cation of items into subgroups. The EIU classi…es its data intothirteen categories: food; alcohol; household supplies; personal care; tobacco; utilities; clothing; domestichelp; recreation; transport; o¢ ce and residential rents; international schools, health and sports and businesstrip costs. As some of <strong>the</strong>se sub-categories only include non-tradable products (transport), we end up withnine categories of tradable items for which we provide separate results in <strong>the</strong> next sections. The largestcategory in our sample corresponds to perishable food items (example: 1 kilo of bananas). Table 3 alsoprovides one example for each of <strong>the</strong> product categories.6 For an overview of complementary data sources, please see <strong>the</strong> appendix.9
In what follows, we focus on tradable goods. We have performed similar tests to <strong>the</strong> ones provided herefor <strong>the</strong> subsample of non-tradable goods, and in most cases <strong>the</strong> convergence e¤ects are meaningless.IIIThe Width of BordersOur main measure of price divergence is <strong>the</strong> economic width of <strong>the</strong> borders. To obtain a measure of <strong>the</strong>borders width, we …rst need a measurement of price disparity between any given cities i (e.g. London)and j (e.g. Paris) for item k (Tomatoes, canned, 500 grams, supermarket) at time t (2001 or 2002) in ourdataset. Alternatively we could have computed price disparity in two longer subperiods around 2002, but<strong>the</strong> objective of our study is to analyze <strong>the</strong> immediate e¤ects of <strong>the</strong> common currency.We …rst reduce our data set to consist of unique city pairs, e.g.Paris-London, but not both. Second, we de…ne a measurement of price disparity 7 as(P k;twhere prices p i and p j are computed in euros. 8It would be tempting to use a simple price ratio, i.e.we keep ei<strong>the</strong>r London-Paris ori;j ) = 1 + abs(pk;t ip k;tj)min(p k;ti; p k;tj) : (1)p k;tip k;tj. However, price ratios are not insensitive to<strong>the</strong> ordering of <strong>the</strong> cities (that, is, whe<strong>the</strong>r London is city i or j). This explains <strong>the</strong> second part of (1).Besides, because we use in <strong>the</strong> denominator of our distance measure, we need to avoid zero values, thuswe add one to <strong>the</strong> pure price disparity ratio.Price ratios are expressed in excess of one unit, (P k;ti;j) 2]1; 1[, and do not depend of whe<strong>the</strong>r a givencity is in <strong>the</strong> numerator or denominator, (P k;ti;j<strong>the</strong>n (P k;ti;j ) = 1 + 0:221:23k;t) = (P ). For example, if pk;tj;ii= 1:23 and p k;tj= 1:45k;t= 1:1788 = (Pj;i ), which intuitively means that price of item k is 17:9% higherin one of <strong>the</strong> cities. Once <strong>the</strong> price disparity metric is computed, we use it to obtain <strong>the</strong> borders’width.To see how, imagine <strong>the</strong> simplest situation in which we calculate <strong>the</strong> "border width" between a countryin which we have data for two cities, a 1 and a 2 and ano<strong>the</strong>r with data about one city, b 1 . We …rst obtaina distance-normalized measurement of price disparity for any good k = 1:::K between national cities,(P k;ta 1 ;a 2 )D a1 ;a 2, where D a1 ;a 2is <strong>the</strong> physical distance in kilometers between a 1 and a 2 .Then, we use a simple rule of three to determine a hypo<strong>the</strong>tical distance H k;ta 1 ;b 1between a 1 and b 1 :7 We use <strong>the</strong> term "disparity" to re‡ect price di¤erences in <strong>the</strong> cross-section of cities and reserve <strong>the</strong> terms "convergence"and "divergence" to describe what occurs dynamically <strong>from</strong> to 2001 to 2002.8 The conversion between local currencies and euros before 2002, and for countries outside <strong>the</strong> euro area is done through ahybrid local currency/euro exchange rate that takes into account <strong>the</strong> weights of each legacy currency in <strong>the</strong> euro after 2002.EIU <strong>the</strong>n computes hybrid exchange rates between each local currency and <strong>the</strong> resulting currency basket.10
which implies, solving for H k;ta 1 ;b 1,(P k;ta 1 ;a2 ) k;t(Pa = 1 ;b 1)D a1 ;a 2 H k;t : (2)a 1 ;b 1k;tH k;t (Pa a 1 ;b 1= 1 ;b 1) D a1 ;a 2(Pa k;t1 ;a 2): (3)H k;ta 1 ;b 1is a measurement of how far apart a 3 should be located (in kms.) <strong>from</strong> a 1 if <strong>the</strong> proportionalityratio were constant between national and international distances. The width of <strong>the</strong> border between citiesa 1 and b 1 , a 1 ;b 1, is thus calculated as <strong>the</strong> di¤erence between <strong>the</strong> hypo<strong>the</strong>tical and actual distances,k;ta 1 ;b 1= H k;ta 1 ;b 1D a1 ;b 1; (4)which is our dependent variable. We similarly compute <strong>the</strong> width of <strong>the</strong> border between cities a 2 and b 1 ,k;ta 2 ;b 1. Note that since we need two cities <strong>from</strong> a country in order to compute hypo<strong>the</strong>tical distances, wecan only compute border widths between cities in Germany, Spain, France, Italy, Switzerland, and <strong>the</strong>U.K., and any o<strong>the</strong>r city in our dataset.k;ta 1 ;b 1can be analyzed <strong>from</strong> a variety of points of view. For instance, we can averageacross products to obtain <strong>the</strong> average border width between <strong>the</strong> two countries,k;ta 1 ;b 1andk;ta 2 ;b 1tA;B =KP2P(H k;tk=1 i=1a i ;b 1D ai ;b 1): (5)2 KOne …nal complication arises because in <strong>the</strong> case where we have more than one city with data availablefor countries A and B, we <strong>the</strong>n have two di¤erent ways to compute <strong>the</strong> border width between a city <strong>from</strong>country A and a city <strong>from</strong> country B (for instance, <strong>the</strong> border width between Madrid and Paris). In <strong>the</strong>secases , we average <strong>the</strong> two numbers measures <strong>by</strong> city, product, and year.The previous discussion shows that we can compute both city-speci…c and country-speci…c borderwidths. Although in our cross-sectional regressions our left-hand side variable is <strong>the</strong> city-speci…c width,in <strong>the</strong> next tables we report values oftA;Bas well. Table 4 summarizes <strong>the</strong> average width between twocountries, classi…ed <strong>by</strong> euro and E.U. membership.[Insert Table 4]11
Our …rst result is that border widths between <strong>Euro</strong>pean countries are consistently negative. This impliesthat, as a function of geographical distance, international price di¤erences are small relative to nationaldi¤erences. This …nding is irrespective of whe<strong>the</strong>r items are tradable or not. When both countries are in<strong>Euro</strong>land , <strong>the</strong> 2001 border is 1; 110 kilometers wide, and it becomes 400 meters narrower in 2002 for allgoods, and 500 meters wider for tradable goods. Border widths are wider between euro countries and E.U.,non-euro countries ( 990 kilometers for all items, and 985 kilometers for tradable goods only). Thenarrowest border (<strong>the</strong> longest distance as well) is between euro countries and non-E.U. countries. Overall,border changes between 2001 and 2002 are of a meaningless economic magnitude.In Table 5 we report border widths <strong>by</strong> pairs of countries. All 2001 borders are negative, which consistentlysuggests price integration across <strong>Euro</strong>pe irrespective of E.U. membership. Border width is negativelyrelated to <strong>the</strong> distance between two cities, implying again that price divergence is not proportional to geographicaldistance. The e¤ect of <strong>the</strong> euro is reported in <strong>the</strong> second column for each country. Between 2001and 2002 <strong>the</strong> border between German cities and o<strong>the</strong>r cities in <strong>Euro</strong>land decreases 600 meters on average,although this result is not statistically signi…cant. However, <strong>the</strong> border between German cities and <strong>the</strong>average cities in <strong>the</strong> E.U., but not in <strong>the</strong> euro area, shrinks <strong>by</strong> 6:2 kilometers (signi…cant at <strong>the</strong> one percentlevel). We …nd <strong>the</strong> same e¤ect for o<strong>the</strong>r euro countries like Spain and France. In Italy, <strong>the</strong> border with <strong>the</strong>average euro country widens <strong>by</strong> 3:9 kilometers in 2002, and it increases slightly less (2:3 kilometers) withrespect to non-euro, E.U. cities (both estimates are signi…cant at <strong>the</strong> one percent level). In Switzerlandprice disparity decreases with France, Germany, Spain, and <strong>the</strong> Czech Republic, and increases with allo<strong>the</strong>r countries. In <strong>the</strong> U.K. <strong>the</strong>re has been strong convergence with respect to all euro countries (exceptfor Belgium and Portugal) and on average <strong>the</strong> border width between <strong>the</strong> U.K. and <strong>Euro</strong>land reduced <strong>by</strong> 3:9kilometers in 2002. It also reduced (1:8 kilometers on average) with non-E.U. countries (both signi…cantat <strong>the</strong> one percent level).[Insert Table 5]Of course such results do not take into account product di¤erences across cities, country characteristicsand geographical factors. Product features are important. Local daily newspapers are not easily tradablebecause local news are often of little interest to those living in o<strong>the</strong>r cities. Moreover, whe<strong>the</strong>r peoplehave <strong>the</strong> habit of purchasing newspapers through subscription (e.g. Stockholm) or at <strong>the</strong> newsstand (e.g.Madrid) is likely to in‡uence prices. Fur<strong>the</strong>r, some products are inherently city-speci…c: for instance,item #250, "Taxi: airport to city centre (average)". Ano<strong>the</strong>r example is that of electricity: transmission12
constrains prevent it <strong>from</strong> ‡owing freely across <strong>Euro</strong>pe, which results in electricity "islands" with <strong>the</strong>irown price dynamics in places such as Scandinavia, <strong>the</strong> Iberian peninsula or Italy.City and country characteristics are important as well. The existence of a physical border betweentwo countries facilitates price arbitrage. Fur<strong>the</strong>r, novels published in Finnish are not easily sold in Dublindue to language barriers. Even, <strong>the</strong> instructions in toothpaste or corn‡akes packages are translated into<strong>the</strong> local languages. It could even be possible that, because of historical and cultural reasons, people arereluctant to buy certain items in certain countries even if <strong>the</strong>y are much cheaper than in <strong>the</strong>ir own. Macroconditions are important determinants of price levels. In general, prices tend to be higher in wealthiercountries and also in those with stronger currencies. Moreover, due to standard gravity model reasons,cities which are fur<strong>the</strong>r apart will trade less with each o<strong>the</strong>r and might have more di¤erent prices.In <strong>the</strong> next sections we analyze all <strong>the</strong>se determinants of <strong>the</strong> border widths. Ultimately, we are tryingto isolate <strong>the</strong> pure e¤ect of <strong>the</strong> introduction of <strong>the</strong> euro on price convergence.IV The Nature of <strong>the</strong> Pre-<strong>Euro</strong> Borders, 2001AThe width of <strong>the</strong> <strong>Euro</strong>pean bordersWe start <strong>by</strong> estimating a simple multivariate regression of product-speci…c border widths on indicators ofE.U. and euro membership. Our left-hand side variable is time, product, and city-pair speci…c, and wehave more than 250; 000 observations. We <strong>the</strong>refore estimate our model with product-…xed, as well as city-…xed e¤ects. Product-…xed e¤ects take into account <strong>the</strong> di¤erences in magnitude of <strong>the</strong> prices of di¤erentitems. City-…xed e¤ects are two-dimensional, meaning that we have two …xed e¤ects per observation,corresponding to each of <strong>the</strong> two cities in <strong>the</strong> pair. The results are reported in Table 6. The …rst andsecond columns present <strong>the</strong> estimation results for <strong>the</strong> border widths in 2001 and 2002, and <strong>the</strong> third columnuses <strong>the</strong> change in border width <strong>from</strong> 2001 to 2002 as endogenous variable.[Insert Table 6]Controlling for geographical distance, border widths are positive for countries in <strong>the</strong> <strong>Euro</strong>pean Unionwhich are not euro members. For <strong>the</strong>se countries, price discrepancy is 24:4 kilometers (= 12:76 + 8:64) in2001, and 12:82 kilometers in 2002 (<strong>the</strong> intercept in <strong>the</strong> regression is not signi…cant). In contrast, in eurocountries border widths are negative. In <strong>Euro</strong>land , border width is 25:71 kilometers (= 12:76 38:47)in 2001, and31:81 in 2002. In 2001, Price divergence is also positive between cities in <strong>Euro</strong>land those13
outside <strong>the</strong> euro , but in <strong>the</strong> E.U. (e.g. Copenhagen and Paris). Between 2001 and 2002 <strong>the</strong>re is asigni…cant reduction of borders for all countries, and especially between euro , and E.U., non-euro countries,where border width reduces 10 kilometers (signi…cant at <strong>the</strong> one percent level) between 2001 and 2002.Additionally price convergence after <strong>the</strong> introduction of <strong>the</strong> euro is stronger outside <strong>the</strong> area than inside.Taking Table 6’s results toge<strong>the</strong>r, <strong>the</strong> euro’s product market integration e¤ects seem to be weak. Thetable presents evidence of strong international product market integration in <strong>Euro</strong>pe but also indicatesthat euro cities had achieved a high degree of international price homogeneity before 2002. Fur<strong>the</strong>r, <strong>the</strong>results suggest that, upon <strong>the</strong> introduction of <strong>the</strong> single currency, prices in euro cities converged between<strong>the</strong>mselves <strong>by</strong> about <strong>the</strong> same amount as for those not joining. The cities experiencing highest convergencewith <strong>the</strong> euro region are those in <strong>the</strong> E.U. but who kept <strong>the</strong>ir own currency. In <strong>the</strong> following section weaddress some o<strong>the</strong>r potentially important factors in‡uencing price convergence in <strong>Euro</strong>pe.BResults <strong>by</strong> Product CategoriesTable 7 summarizes <strong>the</strong> cross-sectional and di¤erence regressions obtained <strong>by</strong> splitting <strong>the</strong> sample in nineproduct categories. The Table illustrates how <strong>the</strong> main general principles introduced in Table 6 are generalacross product classes, leading to negative border widths in <strong>Euro</strong>land .[Insert Table 7]Perishable and non-perishable food prices are less integrated between <strong>Euro</strong>pean Union, non-euro cities(positive coe¢ cients of 75 and 9 respectively 9 , both signi…cant at <strong>the</strong> one percent level) compared to citiesin <strong>the</strong> <strong>Euro</strong>zone (coe¢ cients of +1 and 35 respectively, both signi…cant at <strong>the</strong> one percent level). Priceconvergence is also stronger within <strong>the</strong> euro area for clothing, alcohol, and recreation. Personal care,house supplies and car prices diverge more in <strong>the</strong> euro area in 2001, and tobacco prices have convergedsigni…cantly in <strong>the</strong> <strong>Euro</strong>pean Union.The cross-sectional regression of alcohol prices shows that disparities are smallest for euro cities between<strong>the</strong>mselves. The E.U., non-euro cities have somewhat di¤erent alcohol prices. Taxation is <strong>the</strong> maincomponent of <strong>Euro</strong>pean alcohol prices and <strong>the</strong> results are likely to re‡ect <strong>the</strong> historical …scal independencein Denmark, <strong>the</strong> UK and Sweden, combined with a continuous taxation convergence process between euro,non-euro countries and those joining <strong>the</strong> E.U. in 2006.Overall, <strong>the</strong> product category regressions reinforce <strong>the</strong> view of <strong>Euro</strong>pean markets being integratedbefore <strong>the</strong> introduction of <strong>the</strong> euro. Moreover, we …nd that pre-euro markets are more integrated amongst9 For each variable, we report here <strong>the</strong> sum of <strong>the</strong> intercept and <strong>the</strong> corresponding coe¢ cient.14
<strong>the</strong>mselves than with those of <strong>the</strong> countries which did not join <strong>the</strong> single currency. This evidence mightbe suggestive of a certain price anticipation previous to <strong>the</strong> economic integration which occurred upon <strong>the</strong>euro introduction. For example, economic policy and taxation had become integrated in <strong>the</strong> euro areabefore 2001, but <strong>the</strong> non-euro cities remained to some extent outside of <strong>the</strong> economic convergence process.As a result, <strong>the</strong>re was less scope for fur<strong>the</strong>r integration in <strong>the</strong> euro zone upon <strong>the</strong> changeover.CWhat factors determine <strong>the</strong> width of <strong>the</strong> borders?E.U. and euro membership are not <strong>the</strong> only determinants of price borders. Consumer prices are a¤ected<strong>by</strong> taxes, in particular in items like cars and tobacco. The size of a population and its citizens purchasingpower, i.e. GDP per capita, a¤ects demand and hence prices. Price arbitrage is intuitively easier whentwo countries have a common border, and also when consumers in both sides speak <strong>the</strong> same language.We use this variables toge<strong>the</strong>r to disentangle some of <strong>the</strong> determinants of <strong>the</strong> <strong>Euro</strong>pean borders’widths.We measure 10 di¤erences in taxation with <strong>the</strong> absolute value of 2001 VAT di¤erence between <strong>the</strong>two cities, and historical in‡ation as <strong>the</strong> absolute value of <strong>the</strong> di¤erence in city price indices (average)between 1996 and 2001 (1996 = 100). Additionally, we use city- and country-speci…c GDP per capita,and population size, as control variables. We compute <strong>the</strong> absolute value of <strong>the</strong> di¤erence in GDP percapita between two cities, and divide it <strong>by</strong> <strong>the</strong> GDP per capita of <strong>the</strong> poorest one in <strong>the</strong> pair. We computea similar indicator for population size. Fur<strong>the</strong>r, we construct a dummy with value equals to one when<strong>the</strong> two countries have a common physical border. We compute <strong>the</strong> absolute value of <strong>the</strong> di¤erence incountry sizes in square kilometers, since we hypo<strong>the</strong>size that arbitrage will be more likely among countriesof similar sizes. We standardize country size <strong>by</strong> <strong>the</strong> size of <strong>the</strong> smallest country in <strong>the</strong> pair. Finally, wecontrol for <strong>the</strong> distance between cities as a primer determinant of <strong>the</strong> border width.Once we have studied <strong>the</strong> variables that intuitively determine cross-sectional price divergences, weconsider o<strong>the</strong>r institutional and cultural characteristics. Speci…cally we test for <strong>the</strong> e¤ect of a common languageand <strong>the</strong> legal origin as social di¤erences. In a later part of <strong>the</strong> paper, we construct more sophisticatedmeasures of cultural heterogeneity, and test <strong>the</strong>ir e¤ect of border widths.In this section, we proceed sequentially, …rst discussing product-speci…c factors and <strong>the</strong>n moving onto city-, country-, currency- and cultural issues which could potentially in‡uence <strong>the</strong> degree to productmarket integration in <strong>Euro</strong>pe. We round up <strong>the</strong> section with a short general discussion.10 See Appendix Table III for a de…nition of <strong>the</strong> variables in our study.15
C.1 City CharacteristicsTable 8 summarizes <strong>the</strong> in‡uence of city characteristics on cross-sectional price disparities in 2001. Thecity variables considered are a language dummy (taking <strong>the</strong> value of 1 if <strong>the</strong> same language is spokenin <strong>the</strong> two cities and zero o<strong>the</strong>rwise), plus wealth, population and in‡ation di¤erences (absolute valuesof GDP / capita, total city population and in‡ation in <strong>the</strong> 1996-2001 period). We include results bothwith and without interaction terms between <strong>the</strong> covariates and <strong>the</strong> regional types, which are also used ascontrol variables. The …rst column reports regression coe¢ cients without interaction terms and columnsII-V provide several interaction term combinations.Cities sharing <strong>the</strong> same language have less price disparities than those with di¤erent languages. In model(I), <strong>the</strong> common-language dummy has an insigni…cant negative coe¢ cient. However, when interacted withE.U. and euro membership dummies (model II), we …nd di¤erences across countries. <strong>Common</strong> languagehas a negative e¤ect on disparities for E.U. countries ( 17:2 kilometers, signi…cant at <strong>the</strong> one percentlevel), and especially in euro countries ( 17:2 1:9 = 19:1 kilometers, signi…cant at <strong>the</strong> 10 percent level).The e¤ect of language is also very strong between E.U., non-euro and euro countries ( 19:4 kilometers).In general, <strong>the</strong> di¤erence in GDP/capita leads to more di¤erent prices (positive and signi…cant coe¢cient). A one-standard deviation increase in GDP per capita di¤erence (=182 percent) between twocountries in <strong>the</strong> euro area results in a border which is 3:6 kilometers wider. However, it leads to a borderwhich is 13:83 kilometers wider for two countries in <strong>the</strong> E.U., but outside <strong>the</strong> euro. For non-E.U. countries,<strong>the</strong> combined coe¢ cient represents an economic e¤ect of 5:3 kilometers (signi…cant at <strong>the</strong> one percentlevel).Di¤erences in population lead to more price convergence in E.U., non-euro cities, and to price divergencein euro cities, as well as in cities outside <strong>the</strong> <strong>Euro</strong>pean Union. All <strong>the</strong>se coe¢ cients are signi…cant at <strong>the</strong>one percent level. Intuitively, larger cities should have higher prices due to higher costs for inputs suchas real estate and sta¤, as well as more potential demand. Also, capitals tend to be more expensive (seeTable 18 below) and also more populated.[Insert Table 8]We …nd that historical in‡ation has a signi…cantly positive e¤ect on price convergence (model I)—when historical in‡ation di¤erentials widen, price convergence is stronger. However, this result disguisesa di¤erent pattern across countries. For cities in <strong>Euro</strong>land , a one-standard deviation increase in in‡ationdi¤erence (= 17 percent per year) results in borders which are 197 kilometers wider. On <strong>the</strong> contrary,16
<strong>the</strong> same increase in in‡ation di¤erence results in an increase of <strong>the</strong> border of 547 kilometers for E.U.countries outside <strong>the</strong> euro. Such positive non-euro E.U. coe¢ cient indicates that some cities in <strong>the</strong> group(Copenhagen, London, Manchester and Stockholm) have increased prices above <strong>the</strong> rest, and <strong>the</strong> mainculprit would seem to be <strong>the</strong> large prices increases in London.Overall, <strong>the</strong> regressions on city characteristics provide a consistent picture. While cities sharing <strong>the</strong>same language show more similar prices, those with more di¤erent populations and average wealth tend tohave more di¤erent prices. Historical in‡ation tends to equalize prices, cheaper cities have higher in‡ationthan more expensive ones. The exception to that is <strong>the</strong> E.U., non-euro region, possibly due to priceincreases in London which, being already one of <strong>the</strong> most expensive in <strong>the</strong> World, has separated <strong>from</strong> <strong>the</strong>o<strong>the</strong>rs.Finally note that, after controlling for city characteristics, <strong>the</strong>re is a very strong e¤ect of euro membershipon price convergence. Overall, 2001 euro borders are about 40 kilometers narrower than elsewhere.This is a strong indication of <strong>the</strong> economic impact of <strong>the</strong> Maastricht Treaty on price harmonization in<strong>Euro</strong>land . This is particularly interesting given Table 8: <strong>the</strong> 2001 price borders between E.U. membersthat stayed outside <strong>the</strong> euro had become signi…cantly wider (about 8 kilometers on average), while bordersbetween countries outside <strong>the</strong> E.U. had converged (average coe¢ cient of about 4 kilometers).C.2 Country CharacteristicsTables 9 summarize <strong>the</strong> regressions for country characteristics. The …rst column in Table 9 provides<strong>the</strong> coe¢ cients of a model without interaction terms. Although <strong>the</strong> intercepts are large enough so thatprice di¤erences are generally signi…cant, some of <strong>the</strong> country characteristics have di¤erent e¤ect on citiesdepending on <strong>the</strong>ir E.U. and euro membership.[Insert Table 9]We …rst control for <strong>the</strong> legal origin of <strong>the</strong> two countries in each pair. We argue that a similar originreduces uncertainties and facilitates economic exchange, as it re‡ects institutional a¢ nity between twocountries. However we estimate a positive coe¢ cient in model (I), signi…cant at <strong>the</strong> 10 percent level.When we interact <strong>the</strong> legal origin dummy in model (II), we …nd that <strong>the</strong> positive coe¢ cient is driven <strong>by</strong>price di¤erences between Sweden and Denmark, both E.U., non-euro countries. For euro countries <strong>the</strong>combined e¤ect of legal origin is not signi…cantly di¤erent <strong>from</strong> zero ( +15:69 15:00, p-value of <strong>the</strong> sumis 0:992), and <strong>the</strong> coe¢ cient is negative for countries outside <strong>the</strong> E.U. (most of <strong>the</strong>m share a socialist legal17
origin, with <strong>the</strong> exception of Iceland, Switzerland and Norway). The strongest e¤ect of legal origin onconvergence is for pairs of E.U., non-euro, and euro cities (London and Dublin, or Stockholm and Helsinki,for instance) with a combined coe¢ cient of about 23 kilometers (signi…cant at <strong>the</strong> one percent level).We also analyze <strong>the</strong> e¤ect of country size di¤erences. In <strong>the</strong> extreme, if <strong>the</strong> country is very large,consumers will not need, or will not …nd it convenient, to travel to ano<strong>the</strong>r country to arbitrage pricedi¤erences away. On <strong>the</strong> contrary, in very small countries (e.g. Switzerland) it is customary to go shoppingto neighboring countries (e.g. France) when it is cheaper <strong>the</strong>re. We …nd in fact that <strong>the</strong> …rst e¤ectdominates, as <strong>the</strong> coe¢ cient of <strong>the</strong> di¤erence in country size is positive and signi…cant (at <strong>the</strong> one percentlevel). In <strong>the</strong> interactions, we do not …nd any strong signi…cant di¤erence across countries.VAT di¤erences are associated with lower cross-sectional disparities in <strong>the</strong> euro and non-E.U. groups.Especially strong is <strong>the</strong> e¤ect of VAT di¤erences on price convergence between euro cities and E.U., noneurocities.We …nally consider <strong>the</strong> e¤ect of a common border. A common border facilitates price arbitrage, andwe …nd a negative and signi…cant coe¢ cient equivalent to 6:6 kilometers. This e¤ect is particularly strongin E.U., non-euro cities (i.e. Stockholm and Copenhagen). In euro cities, a common border results a 3:8kilometers narrower price border.C.3 Low- vs. High-Price ItemsDziuda and Mastrobuoni (2006) show that citizens of <strong>Euro</strong>land have miss-perceived <strong>the</strong> in‡ationary e¤ectof <strong>the</strong> euro <strong>by</strong> comparing actual and perceived in‡ation. They …nd that, while in euro countries perceivedin‡ation is higher than actual in‡ation, in E.U., non-euro countries <strong>the</strong> relationship is <strong>the</strong> opposite. Theyargue that is due to people’s inability to deal with changeover rates, which results in retailers charginghigher prices for smaller, low-priced, frequently purchased, items, relative to larger, high-priced, seldompurchased, items. Dziuda and Mastrobuoni (2006) study in‡ation rates but not price convergence, so wecan complement <strong>the</strong>ir results <strong>by</strong> analyzing price convergence in <strong>Euro</strong>pe depending on <strong>the</strong> magnitude ofprice levels.[Insert Table 10]In Table 10, we report cross-sectional regressions of price borders on city- and country-speci…c controls,classi…ed <strong>by</strong> three product price categories: prices below e10; between e10 and e100;and above e100. 1111 This classi…cation is arbitrary, so as to have a meaningful number of items in each category. Most of <strong>the</strong> items in <strong>the</strong>dataset correspond to "low-price" items (i.e., below e10)18
In <strong>the</strong> …rst three columns we present results without E.U. and euro membership dummies. Languagereduces disparities for prices above 100 euros (coe¤. 2:365, signi…cant at <strong>the</strong> 10 percent level), but <strong>the</strong>opposite e¤ect for low-price items (coe¤. 0:738, insigni…cant). Interestingly, we …nd that a common borderreduces <strong>the</strong> disparities more clearly for lower-price items (coe¤. 6:48;signi…cant at <strong>the</strong> one percent level)than for high-price items (coe¤. 3:25, signi…cant at <strong>the</strong> one percent level). Country size and legal originhave <strong>the</strong> expected signs, but only for low-price items. Finally in‡ation rates in <strong>the</strong> period 1996-2001 resultin less disparities for high-priced items (coe¤. 1:0, signi…cant at <strong>the</strong> one percent level), and in moredisparities for low-priced items (coe¤. 0:48;signi…cant at <strong>the</strong> one percent level).In <strong>the</strong> last three columns we report results <strong>by</strong> euro membership. When <strong>the</strong> two cities are in <strong>Euro</strong>land, 2001 prices are relatively more similar for low-priced items (coe¤. 37:7, signi…cant at <strong>the</strong> one percentlevel). Prices of low-priced items in euro cities (e.g. toothpaste) tend to be more similar with those of citiesoutside <strong>the</strong> euro (coe¤. 6:36), and <strong>the</strong> E.U. (coe¤. 12:89). Conversely, prices of high-priced items ineuro cities (e.g. cars) are signi…cantly more di¤erent <strong>from</strong> those in non-euro cities (coe¤. 11:76), and <strong>from</strong>non-E.U. cities (coe¤. 13:61). These four coe¢ cients are signi…cant at <strong>the</strong> …ve percent level, or better.C.4 The E¤ect of Cultural A¢ nityWe have so far identi…ed economic and geopolitical factors that determine price di¤erences between <strong>Euro</strong>peancities. Still, having controlled for those variables, <strong>the</strong>re are severe price di¤erences that remainunexplained. Therefore an remaining open question concerns <strong>the</strong> elements conforming a barriers to tradein a continent which is perfectly integrated geographically and economically, with countries that sometimesshare cultural features like language and legal origin:In this section we analyze <strong>the</strong> e¤ect of cultural a¢ nity variables in <strong>the</strong> propensity of people to arbitrageaway price di¤erences between countries. Guiso et al. (2007) [GSZ] have shown that <strong>the</strong> relative trustthat <strong>Euro</strong>pean citizens have for each o<strong>the</strong>r determines <strong>the</strong> bilateral trade, investment, and …nancial ‡owsbetween countries.language and religion.They also show that <strong>the</strong> trust level is determined <strong>by</strong> history, but also <strong>by</strong> commonWe use <strong>the</strong> adjusted trust index 12 <strong>from</strong> GSZ and modify it in <strong>the</strong> following way. Because our endogenousvariable is <strong>the</strong> price di¤erence between city pairs, and because <strong>the</strong> trust variable is unidirectional, 13 we usea symmetric matrix computed as <strong>the</strong> average for each pair of countries in <strong>the</strong> GSZ dataset. 1412 We have also replicated our regressions using <strong>the</strong> unadjusted trust index <strong>from</strong> Table 2.A in GSZ, without any qualitativechange in our results.13 That is, how much <strong>the</strong> Italians trust <strong>the</strong> Dutch is not <strong>the</strong> same as how much <strong>the</strong> Dutch trust <strong>the</strong> Italians.14 The weakness of this approach is that <strong>the</strong> bidirectional trust between two countries can become meaningless if <strong>the</strong> two19
In addition, we create ano<strong>the</strong>r variable with data on Cultural Openness <strong>from</strong> <strong>the</strong> IMD World Competitivenessreport. The Cultural Openness index ranges <strong>from</strong> 0 to 10 and measures whe<strong>the</strong>r <strong>the</strong> nationalculture is open to foreign ideas, based on a survey conducted among business managers across <strong>the</strong> world. 15For each pair of cities, we <strong>the</strong>n assign to <strong>the</strong> pair <strong>the</strong> minimum of <strong>the</strong> two indices in 2001 as a measureof <strong>the</strong> bilateral cultural openness of <strong>the</strong> two countries. Finally, we control for trade ‡ows between twocountries measured as <strong>the</strong> sum of imports and exports (in euro billion) between <strong>the</strong> countries in 2001.Table 11 introduces <strong>the</strong> regressions for <strong>the</strong> in‡uence of <strong>the</strong>se social and cultural factors on <strong>the</strong> borderwidth. The proxies for cultural a¢ nity are reciprocal trust, cultural openness, bilateral trade, and we alsoestimate coe¢ cients for dummies which indicate whe<strong>the</strong>r <strong>the</strong> two cities share language, legal origin andwhe<strong>the</strong>r <strong>the</strong>ir countries have a common border. The regressions control for city features and country size.Our results can be summarized as follows:1. Once we control for cultural a¢ nity variables, <strong>the</strong> coe¢ cient of <strong>the</strong> euro-membership dummy turnspositive. This result is in contrast with model (I) in Tables 8 and 9, where <strong>the</strong> euro-dummy coe¢ cientis signi…cantly negative. Conversely, <strong>the</strong> coe¢ cient of <strong>the</strong> E.U.-membership dummy turns negativeand signi…cant, while it is signi…cantly positive in Tables 8 and 9. The intuition of this result is thatprice divergences do not seem to depend on euro membership but on cultural a¢ nity. <strong>Euro</strong> membersare in general quite similar and this tends to equalize <strong>the</strong>ir prices.2. Price disparities are positively related to bilateral trust. A one-standard deviation increase in bilateraltrust between two countries (standard deviation=0:17) reduces <strong>the</strong> border width <strong>by</strong> 85 meters for <strong>the</strong>overall sample. Within <strong>the</strong> <strong>Euro</strong>pean Union, a one-standard deviation increase in bilateral trust ledin 2001 to a border width reduction of 1:4 kilometers. However, for members of <strong>Euro</strong>land <strong>the</strong> e¤ectis negligible. And <strong>the</strong> e¤ect of trust for non-E.U. countries is <strong>the</strong> opposite: a one-standard deviationincrease in trust, increases <strong>the</strong> border width <strong>by</strong> one kilometer. 16 Results are qualitatively similar inmodel (III).3. The e¤ect of price di¤erences on bilateral trade is consistently negative . A one-standard deviationincrease in bilateral trade (standard deviation=e29:6 billion) reduces price di¤erences <strong>by</strong> 2:4original indices are very di¤erent: <strong>the</strong> Greeks trust <strong>the</strong> French considerably (an unadjusted index of 26), but <strong>the</strong> French donot trust <strong>the</strong> Greeks at all (an unadjusted index of 9).15 These surveys are sent to senior business leaders who represent a cross-section of <strong>the</strong> business community in each country.The data are converted <strong>from</strong> a 1 - 6 scale (<strong>from</strong> which <strong>the</strong> survey respondents choose <strong>the</strong> most appropriate answer) to a 0 -10 scale.16 All <strong>the</strong>se results are signi…cantly di¤erent <strong>from</strong> zero at <strong>the</strong> one percent level.20
kilometers (signi…cant at <strong>the</strong> one percent level) <strong>from</strong> model (I). By areas, <strong>the</strong> e¤ect is very strongin <strong>Euro</strong>land (a reduction of 175 kilometers, statistically signi…cant), <strong>the</strong> E.U., non-euro area ( 130kilometers, statistically signi…cant), but it is insigni…cant for countries outside <strong>the</strong> <strong>Euro</strong>pean Union.Results are qualitatively similar in model (IV).4. Price di¤erences are smaller in more culturally open city pairs. A one-standard deviation increasein <strong>the</strong> cultural openness index (standard deviation= 0:39) reduces price di¤erences 16 kilometers in<strong>the</strong> euro area. However, <strong>the</strong> e¤ect is stronger for E.U., non-euro countries ( 5 kilometers reduction), and for non-E.U. countries (3:24 kilometers reduction). All results are statistically signi…cant at<strong>the</strong> standard levels. The …ndings are qualitatively similar in model (V).5. Controlling for cultural a¢ nity, 2001 prices di¤erences in were smaller when: (1) The two cities donot speak <strong>the</strong> same language; (2) The two countries have <strong>the</strong> same legal origin; (3) The two countrieshave a common border; (4) The more similar <strong>the</strong> two cities are in terms of GDP per capita and <strong>the</strong>more di¤erent <strong>the</strong>y are in terms of population. These results are all statistically signi…cant.[Insert Table 11]To summarize— variables that measure cultural a¢ nity between two countries explain price di¤erencesin 2001, and this result is weaker when both cities are in <strong>the</strong> euro. In <strong>the</strong> next section, we take <strong>the</strong>2001 results as given and analyze <strong>the</strong> e¤ect of <strong>the</strong> introduction of <strong>the</strong> common currency in 2002 on pricedi¤erences.V The change in <strong>the</strong> borders’widths, 2001-2002Brussels and Paris are 261 kilometers apart. The same language is spoken in both cities (French), and<strong>the</strong>ir countries share legal origin, monetary policy, and a long common border. In January 2002, consumerscould also use <strong>the</strong> same currency in <strong>the</strong> two cities. Moreover, <strong>the</strong> Schengen agreement allowed any customerto travel between both cities without any custom clearance and police control. Therefore, a customer <strong>from</strong>Paris could drive his car to Brussels in a little more than two hours and spend around e35 in <strong>the</strong> journey(back and forth) 17 to buy a two-piece business suit for e570. The same item would have cost e880 in17 The petrol price in Paris was e1.1 in 2002, and we assume that a mid-size car, driving at an average speed of 120 kmsper hour would consume about 6 liters of petrol per 100 kms. We exclude tolls <strong>from</strong> this calculation.21
Paris. That is, a Parisian was paying e290 euros (or one third of its full price) for <strong>the</strong> convenience ofbuying <strong>the</strong> suit at home, ra<strong>the</strong>r than in <strong>the</strong> much cheaper Brussels.If <strong>the</strong> convenience of using <strong>the</strong> same currency was priced <strong>by</strong> consumers, <strong>the</strong>n we should observe that <strong>the</strong>price di¤erence of a business suit between Brussels and Paris had become lower in 2002 than in 2001: Yet,<strong>the</strong> price di¤erence grew <strong>from</strong> e130 to e290 (Paris more expensive) 18 in 2002. Thus <strong>the</strong> price divergencefor this particular item has more than doubled upon <strong>the</strong> introduction of <strong>the</strong> common currency.The objective of this section is to analyze <strong>the</strong> determinants of price convergence/divergence upon <strong>the</strong>introduction of <strong>the</strong> euro . We use our control sample of non-euro and non-E.U. countries to isolate <strong>the</strong>e¤ect of <strong>the</strong> common currency. The endogenous variable in this section is <strong>the</strong> change in border width <strong>from</strong>2001 and 2002. We take a conservative approach <strong>by</strong> focusing on <strong>the</strong> one-year change in prices around <strong>the</strong>introduction of <strong>the</strong> euro as prices in a longer period would be subject to ‡uctuations induced <strong>by</strong> factorsdi¤erent <strong>from</strong> <strong>the</strong> common currency.Table 6 above shows that between 2001 and 2002, <strong>Euro</strong>pean borders reduced signi…cantly, but also that<strong>the</strong> reduction was smallest for <strong>Euro</strong>land . It is a …rst indication that <strong>the</strong> euro has not worked as a devicefor price convergence. In what follows we provide more detailed evidence.Table 12 shows <strong>the</strong> results of cross-sectional regressions of <strong>the</strong> change in border 2001/2002, <strong>by</strong> productcategory. Prices of food perishables and house supplies are more similar across countries in 2002 for <strong>the</strong>entire sample (negative intercepts of 23:2 and 25:4 kilometers respectively, both signi…cant at <strong>the</strong> onepercent level). Alcohol prices diverge more though (intercept 17:3 kilometers). E.U. membership hassigni…cant e¤ect on convergence for food perishables ( ), clothing ( ), alcohol (+), house supplies ( ),and cars (+). However, <strong>the</strong> e¤ect of <strong>the</strong> euro is not signi…cant. Outside <strong>the</strong> E.U., price convergence with<strong>the</strong> euro area increased in alcohol, but decreased in food perishables, cars, and tobacco products.[Insert Table 12]AThe E¤ect of City and Country CharacteristicsIn Table 13, we …nd that <strong>the</strong> introduction of <strong>the</strong> euro results in <strong>Euro</strong>land borders which are about 10kilometers wider, in contrast to o<strong>the</strong>r E.U. countries, where borders have increased <strong>by</strong> about 4 kilometerson average, after controlling for city characteristics.We …nd a positive e¤ect of common language on convergence (<strong>the</strong> coe¢ cient of <strong>the</strong> common languagedummy is2:9 kilometers in model II, signi…cant at <strong>the</strong> one percent level). However <strong>the</strong> language e¤ect18 The price of a two-piece business suit in a mid-priced store was e564.14 in Brussels, and e694 in Paris, in 2001.22
is lower for euro countries ( 1:0 kilometers only, signi…cant at <strong>the</strong> one percent level). O<strong>the</strong>r city characteristicsdisplay <strong>the</strong> expected e¤ect: larger di¤erences in GDP per capita translate into more di¤erentprices (coe¤. 0:388 in model I, and 0:878 in model III, both signi…cant). Such e¤ect is stronger in <strong>the</strong> E.U.area (combined e¤ect of 0:878 4:666 kilometers in model III, signi…cant at <strong>the</strong> …ve-percent level), andinsigni…cant in <strong>the</strong> euro area (combined e¤ect of 0:878 4:666 + 4:552), possibly because <strong>the</strong> convergenceprocess had resulted in small di¤erences in GDP per capita.[Insert Table 13]In <strong>the</strong> euro area, di¤erences in population have resulted in more price convergence, and di¤erences in1996-2001 in‡ation have resulted in less convergence (see models IV and V). This result is opposite tothose in Table 8, suggesting that <strong>the</strong> euro o¤set part of <strong>the</strong> convergence e¤ects of <strong>the</strong> Maastricht Treaty.Table 14 reports <strong>the</strong> e¤ect of country characteristics— di¤erences in VAT and country size, commonborder and legal origin. The e¤ect of VAT di¤erences on convergence in <strong>the</strong> euro area is insigni…cant(combined e¤ect 1:092 0:900 kilometers). The common border dummy displays a negative and signi…cantcoe¢ cient (coe¤. 4:292), and this e¤ect is stronger for euro countries (combined e¤ect of 4:3 4:5kilometers). This is natural as borders have become irrelevant for <strong>the</strong> purpose of trading goods and servicesonce legacy currencies have disappeared. Country size is positively related to border width increases, andeven more so within <strong>the</strong> euro area.[Insert Table 14]Overall, <strong>the</strong> euro dummy remains positive and signi…cant. In terms of economic signi…cance, bordershave enlarged <strong>by</strong> about 6 kilometers on average after controlling for macro variables. This is again evidenceof a price separation e¤ect occurring at <strong>the</strong> time of <strong>the</strong> introduction of <strong>the</strong> single currency.BE¤ects of <strong>the</strong> euro on Low- and High-priced ItemsIn Section IV.C.3 we show that <strong>by</strong> 2001, prices had converged relatively more in <strong>Euro</strong>land for low-priceditems (below e100). In contrast, prices of high-priced items in euro cities were signi…cantly di¤erent <strong>from</strong>prices in E.U., non-euro cities and in non-E.U. cities. In this section we analyze <strong>the</strong> incremental e¤ectinduced <strong>by</strong> <strong>the</strong> introduction of <strong>the</strong> common currency.Table 15 shows that in 2002, <strong>the</strong>re has been convergence in <strong>the</strong> prices of high-priced items (above e100)in all countries in <strong>Euro</strong>pe: <strong>the</strong> intercept in <strong>the</strong> third column implies that in economic terms, borders have23
educed <strong>by</strong> 192:5 kilometers for those items. In <strong>the</strong> sixth column of <strong>the</strong> Table we …nd that such e¤ect isespecially large in <strong>the</strong> <strong>Euro</strong>pean Union in general, and less so in <strong>the</strong> euro area and outside <strong>the</strong> E.U..[Insert Table 15]Focusing on <strong>the</strong> euro countries, price divergence for low-priced items has signi…cantly increased in 2002(coe¤. 7:2 kilometers, signi…cant at <strong>the</strong> one percent level). This is in contrast with <strong>the</strong> result for highpriceditems, whose prices have converged <strong>by</strong> 193:6 kilometers (= 205:9 + 12:2). Therefore we …nd resultsconsistent with Dziuda and Mastrobuoni (2006): for <strong>the</strong> items in our dataset, <strong>the</strong> average in‡ation in 2002has been negative in <strong>the</strong> euro area (see Table 2), despite consumers’perception that <strong>the</strong> euro has lead tosigni…cant price increases. Our …ndings suggest that this is due to <strong>the</strong> pricing of low-priced items: <strong>the</strong>sehave become truly more expensive (Dziuda and Mastrobuoni (2006), with an increasing price divergenceacross countries.With respect to <strong>the</strong> control variables, common language and border do not have a signi…cant e¤ect onconvergence. Fur<strong>the</strong>r, wealth di¤erences tend to reduce disparities in expensive items but not cheap ones,suggesting a product segmentation in terms of basic and luxury goods. Finally, common legal systemslead to less disparities for low-priced items, and country size has a positive e¤ect on convergence, whichis larger for high-priced items. As expected, di¤erences in VAT lead to price di¤erences across all regionsand price categories.CCultural A¢ nity and <strong>the</strong> e¤ect of <strong>the</strong> euro on Price ConvergenceIn Table 16 we control for <strong>the</strong> three indices of cultural a¢ nity described in Section IV.C.4. We reportmultiple regression results in model (I), as well as interactions among variables in models (II)-(V).Controlling for cultural variables, <strong>the</strong> euro dummy displays a negative coe¢ cient. The combined e¤ectbetween E.U. dummy and euro dummy implies a price divergence e¤ect of <strong>the</strong> introduction of <strong>the</strong> euro(combined e¤ect is 126:8 24:2, signi…cantly di¤erent <strong>from</strong> zero at <strong>the</strong> one percent level in model I).Similarly, <strong>the</strong> E.U. dummy shows a positive and signi…cant coe¢ cient. The trust index is not signi…cantin model (I), and bilateral trade and cultural openness display negative coe¢ cients ( 0:043 and 8:809respectively, signi…cant at <strong>the</strong> one percent level).The join e¤ect of trust and euro membership is noteworthy. A one-standard deviation increase in <strong>the</strong>trust index (standard deviation=0:17) reduces border width between euro countries 250 meters in modelII and 155 meters in model III. After controlling for trust in model III, <strong>the</strong> e¤ect of <strong>the</strong> euro dummy ispositive in model III (combined e¤ect 26:1 16:1, signi…cantly di¤erent <strong>from</strong> zero).24
Our study predicts that <strong>the</strong> euro has led to less price convergence between Paris and Brussels (whichshare language, border, and are 261 kilometers apart), than between Vienna and Berlin (which sharelanguage, border, and are 519 kilometers apart). Similarly, we predict that, because culturally, Germanyand Austria are more open than France and Belgium (see below), price convergence between Berlin andVienna should also be stronger.Cultural Openness IndexFrance Belgium 5.74Germany Austria 6.62Spain Greece 6.96Italy Ne<strong>the</strong>rlands 6.98Source: IMD World Competitiveness ReportCultural a¢ nity thus partially explains <strong>the</strong> striking example at <strong>the</strong> beginning of this section.D<strong>Currency</strong> CharacteristicsBris et al. (2007a) …nd that <strong>the</strong> euro was most bene…cial for those countries that had weak currencies. 19If <strong>the</strong> legacy currency was weaker, <strong>the</strong>n <strong>the</strong> exchange rate pre-euro was more volatile and in‡ation wasprobably higher. In such a case, one would expect price convergence to happen more often for countrypairs with weak pre-euro currencies. 20 [Insert Table 17]Table 17 introduces <strong>the</strong> results separating <strong>the</strong> strong and weak pre-changeover currencies. We control for<strong>the</strong> geographical distance between cities because countries with weak currencies are also in <strong>the</strong> periphery. 21After controlling for distance, we …nd that in 2001 economic borders were wider when both countries hadweak currencies, although a common border has an o¤setting e¤ect (Spain and Portugal only). When onecountry had a weak currency, borders were also signi…cantly wider than elsewhere.Upon <strong>the</strong> introduction of <strong>the</strong> euro, we consistently …nd that <strong>the</strong> common currency bene…ts price convergence<strong>the</strong> most for countries that had <strong>the</strong> weakest currencies. When two countries had weak currencies,19 Their de…nition of weak vs. strong refers to <strong>the</strong> vulnerability of <strong>the</strong> currency to devaluations during <strong>the</strong> nineties, not to<strong>the</strong> weakness of <strong>the</strong> national economy.20 The weak-currency countries in Bris et al. (2007) are <strong>the</strong> euro countries with a history of currency crises— Finland, Italy,Ireland, Portugal and Spain.21 And <strong>the</strong>refore <strong>the</strong>ir physical distance is longer, thus resulting automatically in lower border widths26
<strong>the</strong> euro has resulted in an overall price convergence of 8:9 kilometers (combined e¤ect 4:0 + 6:3 19:2).The combined e¤ect when only one currency is weak is insigni…cant. Summarizing, <strong>the</strong> introduction of <strong>the</strong>euro led to convergence when both legacy currencies were weak pre-euro.VIDiscussion and ConclusionsIn this paper we evaluate <strong>the</strong> E&R (1996) border e¤ect in <strong>Euro</strong>pe, disentangle some of its components(including product-, city-, country-, and currency-speci…c elements, and cultural factors), and analyze <strong>the</strong>e¤ect of <strong>the</strong> euro changeover in January, 2002.Firstly, we study <strong>the</strong> width of <strong>the</strong> <strong>Euro</strong>pean borders. In our case, international price disparities are smallcompared to national disparities, which results in negative border widths. We are not able to reproducea border e¤ect like <strong>the</strong> one identi…ed for Canada and <strong>the</strong> United States and within <strong>Euro</strong>pe (Engel andRogers, 1996 and 2001), and also between <strong>the</strong> US and Japan (Parsley and Wei, 2001). Our results suggestthat international consumer markets are more integrated in <strong>the</strong> E.U. than in North America and, moregenerally, that <strong>the</strong> border e¤ect might not be as universal as one would have learned to expect.The E.U. economic integration has been a long process. In particular, both political statements (e.g.Duisemberg, 2002) and academic research (e.g. Engel and Rogers, 2004) credit <strong>the</strong> Maastricht Treaty withbringing about <strong>the</strong> single E.U. market. The Treaty led to <strong>the</strong> removal of obstacles to <strong>the</strong> free movement ofgoods, services, people and capital between member states. It covered, among o<strong>the</strong>rs, <strong>the</strong> elimination ofcustom barriers, <strong>the</strong> liberalization of capital movements, <strong>the</strong> opening of public procurement markets and<strong>the</strong> mutual recognition of professional quali…cations. It also created <strong>the</strong> …rst vision of a common currencywhich would eventually lead to <strong>the</strong> creation of <strong>the</strong> euro. In view of our historical in‡ation trends results,it served well its purpose. We found that during <strong>the</strong> 90s, in‡ation was generally higher in cheaper than inexpensive cities, resulting in overall convergence.Moreover, we show that <strong>the</strong> economic in‡uence of <strong>the</strong> E.U. has extended itself well beyond its borders.In fact, we …nd that <strong>the</strong> smallest price disparities occur between euro cities and those located outside of<strong>the</strong> E.U.. There are at least two formal ways in which <strong>the</strong> E.U. might have in‡uenced prices in adjacentterritories:1. The terms of international agreements between <strong>the</strong> E.U. and neighboring countries extend <strong>the</strong> singlemarket. In particular, <strong>the</strong> <strong>Euro</strong>pean Economic Area (EEA) agreement –including <strong>the</strong> E.U., Iceland,Liechtenstein and Norway –applies <strong>the</strong> exact terms of <strong>the</strong> single market to those countries, including27
<strong>the</strong> implementation of E.U. directives. In practice, this means that non-E.U. EEA countries arebound <strong>by</strong> <strong>the</strong> E.U. without being able to in‡uence <strong>the</strong>m, in what <strong>the</strong> Norwegian Prime Minister JensStoletenberg reportedly described as "fax democracy", with Norway waiting for "its" new legislationto be faxed <strong>from</strong> Brussels (International Herald Tribune, 2005). Without those restrictions onnational sovereignty, <strong>the</strong> Convention of <strong>the</strong> <strong>Euro</strong>pean Free Trade Association (EFTA) – EEA andSwitzerland –also establishes free trade.2. Between <strong>the</strong> introduction of <strong>the</strong> euro and 2007, twelve additional countries (mainly <strong>from</strong> Central andEastern <strong>Euro</strong>pe) have become members of <strong>the</strong> E.U.. 22 As part of <strong>the</strong> pre-requisites for admission,those countries were asked to adapt many parts of <strong>the</strong>ir economic system (e.g. legislation, monetarypolicy) and open <strong>the</strong>ir borders to E.U. trade. As a result, it is very likely that <strong>the</strong>ir consumer pricesstarted to converge with <strong>the</strong> E.U. well before accession.O<strong>the</strong>r economic motives for <strong>the</strong> E.U. in‡uence on <strong>the</strong> surrounding economies include <strong>the</strong> stable exchangerate between <strong>the</strong> euro and <strong>the</strong>ir currencies, both in <strong>the</strong> cases of new accession and EFTA members, <strong>the</strong>convergence in monetary policy and <strong>the</strong> more widespread movement of citizens across <strong>Euro</strong>pe.Secondly, we study <strong>the</strong> determinants of <strong>the</strong> borders’ width. The …t of <strong>the</strong> cross-sections presentedin Table 6 are good (R 2 = 0:98) but <strong>the</strong> unexplained variance points toward <strong>the</strong> existence of o<strong>the</strong>r determinantsof <strong>the</strong> degree of price disparities in <strong>Euro</strong>pe. We focus on product, city, country and currencycharacteristics, as well as cultural elements linking (or separating) <strong>Euro</strong>pean prices. The disaggregation<strong>by</strong> products reinforces <strong>the</strong> view of <strong>Euro</strong>pean markets being integrated before <strong>the</strong> introduction of <strong>the</strong> euro.Fur<strong>the</strong>r, pre-euro markets are shown to be more integrated amongst <strong>the</strong>mselves than with those of <strong>the</strong>countries which did not join <strong>the</strong> single currency.City characteristics are a strong reason for prices to be di¤erent between locations. For example, weshow that cities located in di¤erent countries but where <strong>the</strong> same language is spoken (e.g. French is spokenboth in Brussels and Geneva) tend to have more similar prices than those where <strong>the</strong>y speak di¤erentlanguages (e.g. Brussels and Frankfurt). Thus, language di¤erences emerge as a barrier to internationalmarket integration in <strong>Euro</strong>pe.We can think of at least two ways in which language reduces market integration. From <strong>the</strong> supplyside, written instructions are an important element in <strong>the</strong> speci…cation of many products, including <strong>the</strong>irpackaging, instruction brochures, etc. Items intended for markets where <strong>the</strong> same language is spoken can22 Cyprus, Czech Republic Estonia, Hungary, Latvia, Lithuania, Malta, Poland, Slovakia and Slovenia entered in 2004.Bulgaria and Romania entered in 2007.28
e produced toge<strong>the</strong>r and might have more common costs. In contrast, items produced for countries withdi¤erent languages might be produced separately, which would make <strong>the</strong>ir production costs di¤erent. From<strong>the</strong> demand side, it is easier for citizens to engage in cross-border arbitrage if <strong>the</strong>y can speak <strong>the</strong> locallanguage, and that is specially likely if it is <strong>the</strong>ir own. For example, many residents in Geneva cross <strong>the</strong>border to do <strong>the</strong>ir purchases in Lyon, but to a lesser extend in Milan, although <strong>the</strong> distance is approximately<strong>the</strong> same. Similarly, residents in Zurich often drive to Austria and Germany and not to Italy. Thus, webelieve that <strong>the</strong> introduction of a common <strong>Euro</strong>pean lingua franca is likely to reduce price disparities evenfur<strong>the</strong>r in <strong>the</strong> long run. In <strong>Euro</strong>pe, as in <strong>the</strong> rest of <strong>the</strong> world, English is becoming <strong>the</strong> dominant language.Therefore, our research suggests that policies promoting <strong>the</strong> quality of <strong>the</strong> English spoken in <strong>Euro</strong>pe wouldalso tend to integrate its markets.Toge<strong>the</strong>r with <strong>the</strong> languages spoken, di¤erences in city size and wealth also contribute to separate pricesacross <strong>Euro</strong>pe. A number of factors might be contributing to this. First, <strong>the</strong> …rm might incur in highercosts for several non-traded inputs, including personnel, real estate and o<strong>the</strong>rs. Those costs are part of<strong>the</strong> …nal good prices, even under perfect competition. Second, it is well-known that salaries are generallyhigher in larger cities (e.g. Glaeser, 1998), average wealth will also be higher, and <strong>the</strong>ir citizens are likelyto have a higher willingness to pay for <strong>the</strong> convenience of purchasing <strong>the</strong>ir goods in a city shop.Ano<strong>the</strong>r interesting insight concerns <strong>the</strong> historical in‡ation trends. If historical in‡ation di¤erences ledto more cross-sectional disparities, that would be evidence of a process of divergence across <strong>Euro</strong>pean cities.From a similar base, prices in some locations would have increased more than in o<strong>the</strong>rs and this would haveresulted in cross-sectional disparities. However, we found that in‡ationary trends tend to equalize prices.During <strong>the</strong> 90s, in‡ation was higher in <strong>the</strong> cheaper cities, resulting in convergence. The 2001 snapshot isof a strongly integrated market. The exception to that story was <strong>the</strong> E.U., non-euro region. We speculatethat this result might be due to <strong>the</strong> dominant e¤ect of <strong>the</strong> price increases in London during <strong>the</strong> late-1990s.Given that was already one of <strong>the</strong> most expensive in <strong>the</strong> World, <strong>the</strong> increases resulted in fur<strong>the</strong>r separation<strong>from</strong> its peers in <strong>the</strong> E.U. non-euro group, Copenhagen, Manchester and Stockholm.Thirdly we study <strong>the</strong> factors leading to market integration upon <strong>the</strong> changeover. Since in 2001 europrices were more integrated amongst <strong>the</strong>mselves. Thus, it is not surprising that price convergence within<strong>the</strong> euro zone is slower than in <strong>the</strong> reference groups. It is ironic that Denmark, Sweden and <strong>the</strong> UKconverge more with <strong>the</strong> euro area upon <strong>the</strong> changeover, in spite of not adopting <strong>the</strong> currency.Wim Duisemberg, President of <strong>the</strong> <strong>Euro</strong>pean Central Bank, anticipated that "<strong>the</strong> introduction of <strong>the</strong>euro might act as a catalyst for fur<strong>the</strong>r <strong>Euro</strong>pean integration in o<strong>the</strong>r policy areas" (E.U., 2002). We showthat, in 2002, legal systems do not lead to less disparities, except when <strong>the</strong>y appear in conjunction with29
<strong>the</strong> euro. The changeover might have a positive externality in enhancing <strong>the</strong> legal systems’ integratione¤ect. Duisemberg also suggested that"The introduction of <strong>the</strong> euro will probably give new impetus to <strong>the</strong> initiatives taken in <strong>the</strong>1980s to establish a single market. This means <strong>the</strong> elimination of more obstacles to cross-borderactivities, and –at <strong>the</strong> same time –ei<strong>the</strong>r harmonization or mutual recognition of standards,in order to avoid undesirable competition between regions and countries. The well-knowntextbook example is undesirable tax competition, <strong>the</strong> so-called race to <strong>the</strong> bottom" (E.U., 2002,<strong>the</strong> emphasis is ours).Our research supports this view <strong>by</strong> showing that di¤erences in VAT lead to price divergence across allregions and price categories. The lack of VAT harmonization is a large regulatory obstacle to <strong>the</strong> uni…edeuro market.The creation of <strong>the</strong> <strong>Euro</strong>pean Central Bank (ECB) should have introduced a discontinuity in monetarypolicy, changing expectations and, thus, <strong>the</strong> mechanics of price determination in <strong>the</strong> <strong>Euro</strong>zone (Angeloniet al., 2006). However, most integration was achieved right after <strong>the</strong> Maastricht Treaty in <strong>the</strong> early 90s,and before exchange rates were …xed in 1999 (Engel and Rogers, 2004). In our research, we study not<strong>the</strong> …xed exchange rates but <strong>the</strong> 2002 changeover and …nd integration for those cities using weak legacycurrencies.Economic integration also relies on a reciprocal trust e¤ect. Our results indicate that <strong>the</strong> euro increasedtrust among <strong>the</strong> participating countries and this led to integration. Fur<strong>the</strong>r, as international trust isreplaced <strong>by</strong> <strong>the</strong> common currency, cultural a¢ nities yield economic convergence. In this view, <strong>the</strong> existenceof di¤erent currencies was an obstacle for cultural a¢ nities to yield price convergence, which was removedwith <strong>the</strong> changeover.In this paper we have focused on <strong>the</strong> immediate e¤ects arising upon <strong>the</strong> introduction of <strong>the</strong> euro, i.e.2001-2002. Previous literature suggests that it takes about 4-5 years for prices to converge. It would<strong>the</strong>refore be useful to run a similar study in a longer time perspective, for example between <strong>the</strong> eurointroduction and 2007. In addition, <strong>the</strong>re are a number of factors still separating <strong>Euro</strong>pean prices. Theanalysis of historical in‡ation di¤erences suggests <strong>the</strong> existence of three types of <strong>Euro</strong>pean cities: (a)Strong currency and expensive cities, whose prices grow continuously (e.g. London); (b) Strong currencyand inexpensive cities, whose prices grow less (e.g. Lyon); and (c) Cheap cities with a weak currency, whoseprices grow fast (e.g. Madrid). This categorization has brought about a common E.U. price level, with acities deviating <strong>from</strong> <strong>the</strong> norm. The prototypical outlier is London whose prices, due to its international30
standing as one of <strong>the</strong> World’s capitals, might be more similar to those in New York or Tokyo than tothose of Lyon or Amsterdam, regardless of physical distance or economic treaties. We leave <strong>the</strong>se issues asinteresting topics for fur<strong>the</strong>r research.The above results provide new insights on <strong>the</strong> euro changeover, which are pertinent to understand <strong>the</strong>dynamics of <strong>the</strong> <strong>Euro</strong>pean economic integration and, in general, of international single currency areas. Inthis context, we believe that <strong>the</strong> policy implications of our research are profound. For example, manyCentral and Eastern <strong>Euro</strong>pean countries are expected to join <strong>the</strong> euro in <strong>the</strong> coming years. It is notimpossible that in <strong>the</strong> medium term similar situations will be found in <strong>the</strong> Americas (Mercosur, 23 <strong>the</strong>"dollar block" 24 ) and Asia (Asean 25 ). The euro experience would serve those countries well in <strong>the</strong> event.References[1] Álvarez,L.J., Emmanuel Dhyne, Marco Hoeberichts, Claudia Kwapil, Hervé Le Bihan, Patrick Lünnemann,Fernando Martins, Roberto Sabbatini, Harald Stahl, Philip Vermeulen, Jouko Vilmunen(2006): "Sticky Prices in <strong>the</strong> <strong>Euro</strong> Area: A Summary of New Micro-<strong>Evidence</strong>". Journal of <strong>the</strong><strong>Euro</strong>pean Economic Association, April-May, Vol. 4, No. 2-3, Pages 575-584.[2] Angeloni, I., Luc Aucremanne, Michael Ehrmann, Jordi Galí, Andrew Levin, Frank Smets (2006):"New <strong>Evidence</strong> on In‡ation Persistence and Price Stickiness in <strong>the</strong> <strong>Euro</strong> Area: Implications forMacro Modeling". Journal of <strong>the</strong> <strong>Euro</strong>pean Economic Association, April-May 2006, Vol. 4, No.2-3, Pages 562-574[3] Asplund, M. and Richard Friberg, 2001, Deviations <strong>from</strong> <strong>the</strong> Law of One Price in Scandinavian Duty-Free Stores, American Economic Review, 91, pp. 1072-1083.[4] Baye, M.R., Rupert J. Gatti & Paul Kattuman & John Morgan. (2006) "Did <strong>the</strong> <strong>Euro</strong> foster onlineprice competition? <strong>Evidence</strong> <strong>from</strong> an international price comparison site." Economic Inquiry, 44(2):265-279.23 Formed <strong>by</strong> Argentina, Brazil, Paraguay, Uruguay and Venezuela.24 The dollar block would involve Argentina, Canada, Ecuador and Mexico relinquishing <strong>the</strong>ir national currencies to adopt<strong>the</strong> US dollar.25 ASEAN countries are Brunei, Cambodia, Indonesia, Laos, Malaysia, Myanmar, <strong>the</strong> Philippines, Singapore, Thailand andVietnam.31
[5] Bris, Arturo, Yrjö Koskinen and Mattias Nilsson, 2007a, "The euro and Corporate Valuations", workingpaper.[6] Bris, Arturo, Augusto Rupérez-Micola, and Ivo Welch (2007b), "Rules of Thumb, Di¢ culty of Conversionand <strong>the</strong> In‡ationary E¤ects of <strong>the</strong> <strong>Euro</strong>," working paper.[7] Duisenberg, W. F. (2002): Speech <strong>by</strong> Dr. Willem F. Duisenberg, President of <strong>the</strong> <strong>Euro</strong>pean CentralBank, on <strong>the</strong> occasion of <strong>the</strong> conference "One money, one Euregional market", Maastricht, 6February. Downloaded <strong>from</strong> http://www.ecb.int/press/key/date/2002/html/sp020206.en.html[8] Dziuda, Wioletta, and Giovanni Mastrobuoni, 2006, "The euro Changeover and its E¤ects on PriceTransparency and In‡ation", working paper.[9] Engel, C. and John H. Rogers (1996): "How Wide is <strong>the</strong> Border?", The American Economic Review,vol. 86, no. 5, pp. 1112-1125.[10] Charles, C. and John Rogers. (2001). "Deviations <strong>from</strong> Purchasing Power Parity: Causes and WelfareCosts." Journal of International Economics 55 (October), pp. 29-57.[11] Engel, C and John H. Rogers (2004): "<strong>Euro</strong>pean Product Market Integration after <strong>the</strong> <strong>Euro</strong>". EconomicPolicy, vol. 19, pp. 347–384.[12] EU (1992): The Maastricht Treaty: Treaty on <strong>Euro</strong>pean Union, 7 February. Downloaded <strong>from</strong>http://www.eurotreaties.com/maastrichteu.pdf[13] EU (2002): "The euro as a catalyst for <strong>Euro</strong>pean integration". Speech <strong>by</strong> Dr. Willem F.Duisenberg, President of <strong>the</strong> <strong>Euro</strong>pean Central Bank, on <strong>the</strong> occasion of <strong>the</strong> conference"One money, one Euregional market", Maastricht, 6 February. Downloaded <strong>from</strong>http://www.ecb.int/press/key/date/2002/html/sp020206.en.html[14] Frankel, J. and Andrew Rose (2002): "An Estimate of <strong>the</strong> E¤ect of <strong>Common</strong> Currencies on Trade andIncome". Quarterly Journal of Economics. May 2002.[15] Glaeser, E.L. (1998): "Are Cities Dying? ". The Journal of Economic Perspectives, Vol. 12, No. 2(Spring), pp. 139-160[16] Guiso, Luigi, Paola Sapienza, and Luigi Zingales (2007), "Cultural Biases in Economic Exchange?",working paper[17] Hardouvelis, G. A., Dimitrios Malliaropulos and Richard Priestley (2006): "EMU and <strong>Euro</strong>pean StockMarket Integration". Journal of Business, vol. 79, no. 1.32
[18] Hobijn, B., Federico Ravenna, Andrea Tambalotti (2006): "Menu Costs at Work: Restaurant Pricesand <strong>the</strong> Introduction of <strong>the</strong> <strong>Euro</strong>". Quarterly Journal of Economics, Vol. 121, No. 3, Pages 1103-1131.[19] International Herald Tribune (2005): "In Norway, EU pros and cons (<strong>the</strong> cons still win)", <strong>by</strong> IvarEkman. Downloaded <strong>from</strong> http://www.iht.com/articles/2005/10/26/news/norway.php[20] Matthias Lutz, M. (2003): "Price Convergence under EMU? First Estimates". Discussion Paper no.2003-08, Universität St. Gallen.[21] Parkinson, Michael, Mary Hutchins, James Simmie, Greg Clark and Hans Verdonk (2004): Competitive<strong>Euro</strong>pean Cities: Where do <strong>the</strong> Core Cities Stand? (Full Report). O¢ ce of <strong>the</strong> Deputy PrimeMinister: London.[22] Parsley, D. C. and Shang-Jin Wei (2001): "Explaining The Border E¤ect: The Role of Exchange RateVariability, Shipping Costs, And Geography," Journal of International Economics, vol. 55, pp.87-105.[23] Rose, A. K. and Eric van Wincoop (2001): "National Money as a Barrier to International Trade: TheReal Case for <strong>Currency</strong> Union". The American Economic Review, vol. 91, no. 2, proceedings of<strong>the</strong> Annual Meeting of <strong>the</strong> American Economic Association, pp. 386-390.33
CountryCityNumber ofItemsLanguage<strong>Currency</strong>(Pre-<strong>Euro</strong>)<strong>Euro</strong> CountriesAustria Vienna 294 German ATSBelgium Brussels 298 French BEFFinland Helsinki 291 Finnish FIMFrance Lyon 288 French FFParis 294 French FFGermany Berlin 288 German DMDüsseldorf 292 German DMFrankfurt 299 German DMHamburg 297 German DMMunich 286 German DMGreece A<strong>the</strong>ns 288 Greek GRDIreland Dublin 290 English IEPItaly Milan 294 Italian ITLRome 297 Italian ITLLuxembourg Luxembourg 299 French BEFNe<strong>the</strong>rlands Amsterdam 300 Dutch NLGPortugal Lisbon 300 Portuguese PTESpain Barcelona 300 Spanish ESPMadrid 300 Spanish ESPE.U., non-<strong>Euro</strong> CountriesUnited Kingdom London 295 English GBPManchester 284 English GBPDenmark Copenhagen 296 Dannish DKKSweden Stockholm 292 Swedish SEKNon-E.U. Countries Western <strong>Euro</strong>peIceland Reykjavik 260 Icelandic ISKNorway Oslo 286 Norwegian NOKSwitzerland Geneva 300 French CHFZurich 300 German CHFNon-E.U. Countries Eastern <strong>Euro</strong>peCzech Republic Prague 300 Czech CZKHungary Budapest 292 Hungarian HUFPoland Warsaw 299 Polish PLNRomania Bucarest 266 Romanian RONSerbia & Montenegro Belgrade 222 Serbo-Croatian CSDUkraine Kiev 268 Ukranian UAHTable 1. Countries, Cities, and ItemsThis Table describes <strong>the</strong> countries in our sample and <strong>the</strong> cities for whichwe have price data, as well as <strong>the</strong> number of price items per city. Ourprimary source is <strong>the</strong> "City Data" dataset released <strong>by</strong> The EconomistIntelligence Unit.
City's (Country's)GDP per Capita Population 2001 Price index (1996 = 100)InflationCity 2001 (millions) 2001 2002 2001-2002AMSTERDAM € 38,203 0.73 157.10 149.01 -5.15%ATHENS* € 20,424 0.77 167.15 159.05 -4.85%BARCELONA € 18,449 1.46 157.31 149.55 -4.93%BELGRADE 1.59 981.68 1094.27 11.47%BERLIN € 23,428 3.39 147.88 137.60 -6.95%BRUSSELS € 51,106 0.14 150.61 140.56 -6.67%BUCHAREST* € 7,142 2.02 1599.20 1799.32 12.51%BUDAPEST* € 15,298 1.83 246.89 238.98 -3.20%COPENHAGEN € 50,775 0.50 154.45 145.26 -5.95%DUBLIN € 36,591 0.48 161.49 155.16 -3.92%DUSSELDORF € 54,053 0.57 147.88 137.60 -6.95%FRANKFURT € 74,465 0.64 147.88 137.60 -6.95%GENEVA* € 35,010 0.38 143.61 132.71 -7.59%HAMBURG € 43,098 1.71 147.88 137.60 -6.95%HELSINKI € 35,322 0.55 152.09 141.83 -6.75%KIEV* € 5,011 2.59 311.76 288.38 -7.50%LISBON* € 20,768 0.56 159.67 151.87 -4.88%LONDON € 35,072 7.07 147.69 137.31 -7.03%LUXEMBOURG € 57,400 0.32 151.27 141.77 -6.28%LYON € 28,960 0.42 146.19 136.80 -6.42%MADRID € 22,573 2.82 157.31 149.55 -4.93%MANCHESTER € 22,099 0.43 147.69 137.31 -7.03%MILAN € 32,122 1.31 154.00 144.88 -5.92%MUNICH € 61,360 1.20 147.88 137.60 -6.95%OSLO € 44,160 0.51 157.58 146.55 -7.00%PARIS € 67,200 2.15 146.19 136.80 -6.42%PRAGUE* € 18,024 1.19 184.18 172.15 -6.53%REYKJAVIK* € 32,516 0.11 165.15 159.52 -3.41%ROME € 24,766 2.65 154.00 144.88 -5.92%SOFIA* € 7,105 1.14 2307.21 2241.52 -2.85%STOCKHOLM € 35,733 0.74 143.97 135.04 -6.20%VIENNA € 36,572 1.54 149.21 139.50 -6.51%WARSAW* € 11,905 1.62 221.19 206.95 -6.44%ZURICH* € 35,010 1.18 143.61 132.71 -7.59%Table 2. Macro VariablesThis Table report <strong>the</strong> GDP per capita, population and inflation rates for <strong>the</strong> cities inour sample. City GDP is available <strong>from</strong> XXX, except for countries with (*), forwhich we report country GDP <strong>from</strong> <strong>the</strong> World Bank Development Indicators. ForOslo, <strong>the</strong> GDP per capita corresponds to year 2000. Inflation rates and Populationare <strong>from</strong> XXX.
Product CategoryNumber ofProductsExampleTradable Items 217…of which:Food, Perishables 78 Bananas (1 kg) (supermarket)Food, Non Perishables 34 Coca-Cola (1 l) (supermarket)Clothing 32 Child's jeans (chain store)Alcohol 20 Beer, local brand (1 l) (supermarket)House Supplies 18 Light bulbs (two, 60 watts) (supermarket)Personal Care 14 Toothpaste with fluoride (120 g) (supermarket)Cars 8 Compact car (1300-1799 cc) (low)Recreation 8 Kodak colour film (36 exposures) (average)Tobacco 5 Cigarettes, Marlboro (pack of 20) (mid-priced store)Non-Tradable Items 82 Man's haircut (tips included) (average)Total 299Table 3. Items and Item CategoriesClassification of Tradable Items into categories, and number of products percategory. Our primary source is <strong>the</strong> "City Data" dataset released <strong>by</strong> TheEconomist Intelligence Unit.
Panel A: All Goods<strong>Euro</strong> Countries E.U. Countries Non E.U. CountriesBoder Widthin 2001Change 2001-2002Boder Widthin 2001Change 2001-2002Boder Widthin 2001Change 2001-2002<strong>Euro</strong> Countries -1,110 -0.4 -990 -3.9 -1,373 -1.6E.U. Countries -942 0.2 -1,071 0.1Non-E.U. Countries -1,143 3.7Panel B: Tradable Goods only<strong>Euro</strong> Countries E.U. Countries Non E.U. CountriesBoder Widthin 2001Change 2001-2002Boder Widthin 2001Change 2001-2002Boder Widthin 2001Change 2001-2002<strong>Euro</strong> Countries -1,111 0.5 -985 -3.8 -1,380 -0.7E.U. Countries -937 0.0 -1,080 1.8Non-E.U. Countries -1,158 6.3Table 4. The Width of <strong>the</strong> BorderThis table reports <strong>the</strong> width of <strong>the</strong> border between two <strong>Euro</strong>pean countries in 2001, and <strong>the</strong> change inborder width <strong>from</strong> 2001 to 2002. To obtain a measure of <strong>the</strong> borders width, we first need ameasurement of price disparity between any given cities i and j for item k at time t (2001 or 2002) inour dataset, as:P k,t i,j 1 absp i k,t k,t−p j k,t k,t.minp i ,p j where prices p i and p j are computed in euros. We calculate <strong>the</strong> "border width" between a country inwhich we have data for two cities, a 1 and a 2 and ano<strong>the</strong>r with data about one city, b 1 . We first obtain adistance-normalized measurement of price disparity for any good k=1...K between national cities:k,tP a 1 ,a 2D a1 ,a 2where D a1,a2 is <strong>the</strong> physical distance (in kilometers) between cities a 1 and a 2 . Then, we use a simple ruleof three to determine a hypo<strong>the</strong>tical distance H a1,b1 between a 1 and b 1 .Which implies:k,tP a1 ,a2 P a 1 ,b 1D a1 ,a 2k,tH a 1 ,b 1k,tk,t.H a1 ,b 1 P k,ta 1 ,b 1D a1 ,a 2k,tP a 1 ,a 2 The table reports <strong>the</strong> estimates of H <strong>by</strong> pairs of countries classified <strong>by</strong> regional groups.
GermanySpainFranceItalySwitzerlandUnited KingdomBorder Widthin 2001Border Widthin 2001Border Widthin 2001Border Widthin 2001Border Widthin 2001Border Widthin 2001<strong>Euro</strong> CountriesAustria -399.5 -0.1 -1372.9 -3.7 *** -845.4 1.3 *** -520.3 5.1 *** -622.8 2.3 *** -1240.6 -0.1Belgium -277.9 -2.1 *** -1017.0 1.2 * -295.9 0.7 -783.0 1.2 -435.8 1.0 ** -344.5 0.0Finland -1184.7 0.6 -2580.5 -5.4 *** -1858.8 -0.9 -1894.0 2.8 *** -1802.7 1.2 *** -1724.6 -0.4France -1067.9 -4.0 *** -523.0 -4.3 *** -433.9 6.1 *** -216.3 -0.7 -449.6 -4.7 ***Germany -1067.9 -4.0 *** -1067.9 -4.0 *** -519.3 1.0 -281.8 -12.3 *** -522.1 -21.1 ***Greece -1620.4 -4.0 *** -1933.4 3.0 *** -1794.6 0.6 -1075.1 1.0 * -1567.7 2.1 *** -2410.3 -3.7 ***Ireland -971.8 -1.3 ** -1270.0 1.2 -840.7 -0.5 -1484.3 1.0 -1135.8 1.3 *** -285.2 -1.0 ***Italy -519.3 1.0 -703.1 5.9 *** -433.9 6.1 *** -208.5 6.1 *** -1044.4 -4.5 ***Luxembourg -214.8 -0.5 -954.2 -1.3 -244.7 1.0 ** -604.7 5.3 *** -263.1 3.0 *** -515.2 -0.6Ne<strong>the</strong>rlands -254.1 -2.1 *** -1178.1 -5.0 *** -455.6 -4.7 *** -900.2 -0.2 -576.4 0.4 -338.0 -4.1 ***Portugal -1858.4 9.4 *** -577.5 4.1 *** -1285.9 10.1 *** -1615.4 13.0 *** -1521.2 8.3 *** -1552.0 4.9 **Spain -1067.9 -4.0 *** -523.0 -4.3 *** -703.1 5.9 *** -639.9 -2.4 * -1002.6 -11.1 ***Average -857.9 -0.6 -1198.0 -0.8 -876.9 0.5 -957.6 3.9 *** -772.7 0.9 -952.4 -3.9 ***E.U., non-<strong>Euro</strong>Denmark -367.8 3.6 *** -1713.2 3.3 *** -1000.6 0.6 -1171.3 9.3 *** -982.7 1.2 ** -886.5 1.4 ***Sweden -862.8 -1.1 ** -2243.6 -1.0 -1512.6 -3.6 *** -1639.0 2.0 *** -1489.0 0.5 -1334.4 -0.3United Kingdom -522.1 -21.1 *** -1002.6 -11.1 *** -449.6 -4.7 *** -1044.4 -4.5 *** -719.7 2.6 ***Average -584.2 -6.2 *** -1653.2 -2.9 *** -987.6 -2.6 *** -1284.9 2.3 *** -1063.8 1.4 *** -1110.5 0.5Non E.U.Change 2001-2002Change 2001-2002Change 2001-2002Change 2001-2002Change 2001-2002Change 2001-2002Czech Republic -188.4 -6.5 *** -1363.4 0.7 -703.2 -5.7 *** -588.1 -3.1 *** -528.7 -1.5 ** -1008.2 -9.7 ***Hungary -517.0 -11.2 *** -1485.7 1.8 -961.4 -3.9 *** -566.0 -7.8 *** -743.5 2.1 *** -1397.6 -10.5 ***Iceland -2150.2 2.8 *** -2706.8 0.3 -2284.2 -1.0 -2867.3 7.3 *** -1948.7 1.7 *** -1670.5 2.8 ***Norway -772.2 7.4 *** -2022.3 3.6 *** -1335.6 2.7 *** -1600.1 10.8 *** -1402.3 3.3 *** -1022.4 5.3 ***Poland -571.1 12.1 *** -1871.5 12.1 *** -1211.2 15.7 *** -1035.2 8.2 *** -1048.3 14.1 *** -1396.4 6.0 ***Romania -1151.8 4.1 ** -1981.7 16.9 *** -1568.2 8.2 *** -992.1 7.7 *** -1346.2 10.9 *** -2047.8 -2.3 *Serbia -766.1 -8.0 *** -1533.5 10.0 *** -1123.5 -4.5 *** -375.8 -8.2 *** -899.6 5.1 *** -1618.9 -12.6 ***Switzerland -281.8 -12.3 *** -639.9 -2.4 * -216.3 -0.7 -208.5 6.1 *** -719.7 2.6 ***Ukraine -1216.2 10.0 *** -2408.9 9.7 *** -1822.1 13.6 *** -1457.9 8.1 *** -1634.1 16.8 *** -2076.7 5.7 ***Average -846.1 -0.2 -1779.3 5.9 *** -1247.3 2.7 ** -1076.8 3.2 ** -1193.9 6.6 *** -1439.8 -1.4 *All -739.2 -2.7 *** -1607.4 2.3 *** -1164.1 1.7 *** -1118.0 3.9 *** -979.5 3.5 *** -1192.8 -1.8 **** significant at 10%; ** significant at 5%; *** significant at 1%Table 5. The Width of <strong>the</strong> BorderThis table reports <strong>the</strong> width of <strong>the</strong> border between two <strong>Euro</strong>pean countries in 2001, and <strong>the</strong> change in border width <strong>from</strong> 2001 to 2002. To obtain a measure of <strong>the</strong>borders width, we first need a measurement of price disparity between any given cities i and j for item k at time t (2001 or 2002) in our dataset, as:P k,t i,j 1 absp i k,t k,t−p j k,t k,t.minp i ,p j where prices p i and p j are computed in euros. We calculate <strong>the</strong> "border width" between a country in which we have data for two cities, a 1 and a 2 and ano<strong>the</strong>r withdata about one city, b 1. We first obtain a distance-normalized measurement of price disparity for any good k=1...K between national cities:k,tP a 1 ,a 2 D a1 ,a 2where D a1,a2 is <strong>the</strong> physical distance (in kilometers) between cities a 1 and a 2. Then, we use a simple rule of three to determine a hypo<strong>the</strong>tical distance H a1,b1 betweena 1 and b 1.k,tP a1 ,a2 P k,ta 1 ,b 1.D k,t a1 ,a 2Which implies:k,tH a 1,b 1H a1 ,b 1 P k,ta 1 ,b 1Da 1 ,a 2k,tP a 1 ,a 2 The table reports <strong>the</strong> estimates of H <strong>by</strong> pairs of countries classified <strong>by</strong> pairs of countries. Tests of significance are based on a two-tailed t-statistic.
Border Width Border Widthin 2001 in 2002Difference inBorder 2002-2001Constant 12.755*** 2.742 -10.013***[3.826] [3.992] [1.678]Distance Between Cities -0.994*** -0.995*** -0.001[0.001] [0.001] [0.000]Both Countries in <strong>Euro</strong>pean Union 8.644*** 12.820*** 4.177***[1.326] [1.422] [0.721]Both Countries in <strong>Euro</strong> Area -38.466*** -31.814*** 6.652***[3.787] [3.983] [1.681]<strong>Euro</strong> Country vs EU-non <strong>Euro</strong> Country -6.138*** -5.479*** 0.659[1.986] [2.100] [0.906]<strong>Euro</strong> Country vs non-EU -1.515 2.445 3.961***[1.889] [1.991] [0.821]Observations 252,537 252,537 252,537Number of Items 217 217 217R-squared 0.98 0.98 0.06Robust standard errors in brackets* significant at 10%; ** significant at 5%; *** significant at 1%Table 6. Regression ResultsWe estimate cross-sectional regressions where <strong>the</strong>endogenous variable is <strong>the</strong> width of <strong>the</strong> border between citiesi and j in 2001 and 2002 (first two columns), and <strong>the</strong> changein border width <strong>from</strong> 2001 to 2002 (third column). We useproduct-fixed effects, city-i fixed effects, and city-j fixedeffects, in all three regressions. The sample includes pairwiseprice differences between cities in <strong>Euro</strong>pe, only for <strong>the</strong>tradable items in our dataset. Distance between cities, andborder width, is in kilometers. Robust standard errors are inparen<strong>the</strong>ses.
FoodPerishablesDependent Variable: Border Width in 2001Food Non-Perishables Clothing Alcohol RecreationPersonalCareHouseSupplies Cars TobaccoDistance Between Cities -0.999*** -0.991*** -1.004*** -0.975*** -0.995*** -1.001*** -0.991*** -0.999*** -0.943***[0.001] [0.001] [0.001] [0.002] [0.002] [0.002] [0.002] [0.001] [0.006]Both Countries in <strong>Euro</strong>pean Union 22.771*** 15.951*** 10.382*** 10.277** 13.696** -8.427** -11.557*** -8.673* -153.434***[1.914] [2.628] [2.070] [4.699] [5.462] [3.695] [3.721] [4.705] [20.275]Both Countries in <strong>Euro</strong> Area -74.265*** -43.251*** -2.437 -59.301*** -35.814*** 11.511 -1.065 9.348 42.857[7.322] [8.052] [6.364] [9.160] [13.664] [12.865] [16.026] [8.417] [33.045]<strong>Euro</strong> Country vs EU-non <strong>Euro</strong> Country -36.542*** -11.357*** 1.45 28.686*** -12.808* 36.058*** 7.442 26.938*** 91.767***[3.759] [4.349] [3.331] [5.063] [7.241] [6.715] [8.315] [5.594] [17.136]<strong>Euro</strong> Country vs non-EU -13.558*** -10.071** 18.424*** 23.293*** -0.315 7.394 -0.613 3.727 -37.605**[3.654] [3.950] [3.161] [4.561] [6.860] [6.256] [7.917] [3.613] [17.209]Constant 52.256*** -7.373 -22.552*** -8.707 -2 -33.312*** 20.852 13.106* 1.623[7.430] [8.266] [6.386] [8.957] [13.286] [12.736] [16.146] [7.579] [33.439]Observations 88,466 39,426 37,720 23,850 9,650 16,695 21,527 9,158 6,045Number of Items 78 34 32 20 8 14 18 8 5R-squared 0.99 0.99 0.99 0.98 0.99 0.99 0.99 0.98 0.96Robust standard errors in brackets* significant at 10%; ** significant at 5%; *** significant at 1%Table 7. Product Categories and Borders in 2001We estimate cross-sectional regressions where <strong>the</strong> endogenous variable is <strong>the</strong> width of <strong>the</strong> border between cities i and jin 2001. We use product-fixed effects in all three regressions. Distance between cities, and border width, is inkilometers. We use product-fixed effects, city-i fixed effects, and city-j fixed effects, in all <strong>the</strong> regressions. The sampleincludes pairwise price differences between cities in <strong>Euro</strong>pe, only for <strong>the</strong> tradable items in our dataset. Robuststandard errors are in paren<strong>the</strong>ses. The classification into product categories follows Engel and Rogers (2004), EIU,and our own classification.
Dependent Variable: Border Width in 2001(I) (II) (III) (IV) (V)Constant 382.224** 75.564*** 3.75 56.611*** -1,099.148***[152.191] [2.753] [2.717] [2.985] [180.581]Distance Between Cities -0.996*** -0.995*** -0.996*** -0.995*** -0.994***[0.001] [0.001] [0.001] [0.001] [0.001]Both Countries in <strong>Euro</strong>pean Union 8.117*** 8.702*** 5.161*** 10.427*** 0.804[1.214] [1.329] [1.483] [1.552] [2.754]Both Countries in <strong>Euro</strong> Area -36.521*** -42.470*** -32.444*** -41.959*** -28.197***[3.758] [3.834] [3.826] [3.894] [4.545]<strong>Euro</strong> Country vs EU-non <strong>Euro</strong> Country -4.771** -7.006*** -3.836* -8.357*** 10.098***[1.971] [2.005] [2.184] [2.112] [3.202]<strong>Euro</strong> Country vs non-EU -1.038 -3.311* -0.219 -3.741* 1.167[1.871] [1.910] [1.888] [1.912] [1.897]Cities Speak Same Language (Y/N) -0.548 -3.076[0.610] [2.169]Difference in City GDP per capita (Abs. Value) 2.747*** 2.934***[0.237] [0.430]Difference in City Population (Abs. Value) -0.042 -0.096***[0.030] [0.031]Difference in City Inflation 1996-2001 (Abs. Value) -0.103* 0.413***[0.053] [0.062]Both Countries in <strong>Euro</strong>pean Union x Cities Speak Same Language (Y/N) -17.23***[1.442]Both Countries in <strong>Euro</strong> Area x Cities Speak Same Language (Y/N) -1.932*[1.155]<strong>Euro</strong> Country vs EU-non <strong>Euro</strong> Country x Cities Speak Same Language (Y/N) -19.438***[2.426]<strong>Euro</strong> Country vs non-EU x Cities Speak Same Language (Y/N) 3.387[2.273]Both Countries in <strong>Euro</strong>pean Union x Difference in City GDP per capita (Abs. Value) 4.669***[1.550]Both Countries in <strong>Euro</strong> Area x Difference in City GDP per capita (Abs. Value) -5.614***[1.555]<strong>Euro</strong> Country vs EU-non <strong>Euro</strong> Country x Difference in City GDP per capita (Abs. Value) -1.497[1.584]<strong>Euro</strong> Country vs non-EU x Difference in City GDP per capita (Abs. Value) -0.334[0.347]Both Countries in <strong>Euro</strong>pean Union x Difference in City Population (Abs. Value) -0.402***[0.132]Both Countries in <strong>Euro</strong> Area x Difference in City Population (Abs. Value) 0.602***[0.151]<strong>Euro</strong> Country vs EU-non <strong>Euro</strong> Country x Difference in City Population (Abs. Value) 0.335***[0.127]<strong>Euro</strong> Country vs non-EU x Difference in City Population (Abs. Value) 0.716***[0.077]Both Countries in <strong>Euro</strong>pean Union x Difference in City Inflation 1996-2001 (Abs. Value) 1.298***[0.468]Both Countries in <strong>Euro</strong> Area x Difference in City Inflation 1996-2001 (Abs. Value) -1.095**[0.474]<strong>Euro</strong> Country vs EU-non <strong>Euro</strong> Country x Difference in City Inflation 1996-2001 (Abs. Value) -2.437***[0.475]<strong>Euro</strong> Country vs non-EU x Difference in City Inflation 1996-2001 (Abs. Value) 0.002[0.001]Observations 244,392 252,537 244,392 252,537 252,537Number of Items 217 217 217 217 217R-squared 0.99 0.98 0.99 0.98 0.98Robust standard errors in brackets* significant at 10%; ** significant at 5%; *** significant at 1%Table 8. The Effect of City Characteristics on <strong>the</strong> 2001 BordersWe estimate cross-sectional regressions where <strong>the</strong> endogenous variable is <strong>the</strong> width of <strong>the</strong> border between cities iand j in 2001. We use product-fixed effects, city-i fixed effects, and city-j fixed effects, in all <strong>the</strong> regressions. Thesample includes pairwise price differences between cities in <strong>Euro</strong>pe, only for <strong>the</strong> tradable items in our dataset.Distance between cities, and border width, is in kilometers. Robust standard errors are in paren<strong>the</strong>ses.
Dependent Variable: Border Width in 2001(I) (II) (III) (IV) (V)Constant 62.733*** 75.532*** 47.772*** 44.537*** 78.478***[2.656] [2.742] [3.149] [2.798] [2.780]Distance Between Cities -1.000*** -0.995*** -0.994*** -0.997*** -0.996***[0.001] [0.001] [0.001] [0.001] [0.001]Both Countries in <strong>Euro</strong>pean Union 9.078*** 7.286*** 7.465*** 0.689 6.961***[1.354] [1.340] [1.667] [2.568] [1.321]Both Countries in <strong>Euro</strong> Area -35.135*** -36.108*** -38.148*** -39.192*** -34.400***[3.780] [3.836] [3.911] [2.310] [3.819]<strong>Euro</strong> Country vs EU-non <strong>Euro</strong> Country -4.176** -3.777* -3.807* 0 -2.582[1.972] [1.999] [2.205] [0.000] [2.004]<strong>Euro</strong> Country vs non-EU -3.353* -0.394 -0.323 -1.052 -0.563[1.889] [1.892] [1.976] [2.434] [1.907]Countries Share Legal Origin (Y/N) 0.925* 15.696***[0.492] [1.889]Difference in Country Size (Sq. Kms., Abs. Value) 0.102*** 0.244**[0.006] [0.123]Difference in VAT (Absolute Value) -1.122*** -0.961***[0.112] [0.154]<strong>Common</strong> Border (Y/N) -6.646*** -0.104[0.597] [1.797]Both Countries in <strong>Euro</strong>pean Union x Countries Share Legal Origin (Y/N) -7.324[6.422]Both Countries in <strong>Euro</strong> Area x Countries Share Legal Origin (Y/N) -15.000***[2.019]<strong>Euro</strong> Country vs EU-non <strong>Euro</strong> Country x Countries Share Legal Origin (Y/N) -38.385***[2.197]<strong>Euro</strong> Country vs non-EU x Countries Share Legal Origin (Y/N) -12.470***[2.044]Both Countries in <strong>Euro</strong>pean Union x Difference in Country Size (Sq. Kms., Abs. Value) 0.337[0.412]Both Countries in <strong>Euro</strong> Area x Difference in Country Size (Sq. Kms., Abs. Value) -0.508[0.366]<strong>Euro</strong> Country vs EU-non <strong>Euro</strong> Country x Difference in Country Size (Sq. Kms., Abs. Value) -0.616*[0.365]<strong>Euro</strong> Country vs non-EU x Difference in Country Size (Sq. Kms., Abs. Value) -0.258[0.164]Both Countries in <strong>Euro</strong>pean Union x Difference in VAT (Absolute Value) 0.935***[0.327]Both Countries in <strong>Euro</strong> Area x Difference in VAT (Absolute Value) -0.447[0.299]<strong>Euro</strong> Country vs EU-non <strong>Euro</strong> Country x Difference in VAT (Absolute Value) -1.566***[0.286]<strong>Euro</strong> Country vs non-EU x Difference in VAT (Absolute Value) -1.265***[0.145]Both Countries in <strong>Euro</strong>pean Union x <strong>Common</strong> Border (Y/N) -16.156***[2.041]Both Countries in <strong>Euro</strong> Area x <strong>Common</strong> Border (Y/N) 12.370***[1.195]<strong>Euro</strong> Country vs EU-non <strong>Euro</strong> Country x <strong>Common</strong> Border (Y/N) 0[0.000]<strong>Euro</strong> Country vs non-EU x <strong>Common</strong> Border (Y/N) -1.21[1.815]Observations 210,887 252,537 252,537 210,887 252,537Number of Items 217 217 217 217 217R-squared 0.98 0.98 0.98 0.98 0.98Robust standard errors in brackets* significant at 10%; ** significant at 5%; *** significant at 1%Table 9. The Effect of Country Characteristics on <strong>the</strong> 2001 BordersWe estimate cross-sectional regressions where <strong>the</strong> endogenous variable is <strong>the</strong> width of <strong>the</strong> border between cities i and j in 2001.We use product-fixed effects, city-i fixed effects, and city-j fixed effects, in all <strong>the</strong> regressions. The sample includes pairwiseprice differences between cities in <strong>Euro</strong>pe, only for <strong>the</strong> tradable items in our dataset. Distance between cities, and border width, isin kilometers. Robust standard errors are in paren<strong>the</strong>ses.
Item is lessthan 10 eurosItem is lessthan 100eurosDependent Variable: Border Width in 2001Item is morethan 100eurosItem is lessthan 10 eurosItem is lessthan 100eurosItem is morethan 100eurosConstant -654.065*** -26.072*** 1,629.157*** 7.424** 1,603.247*** 1,384.229***[98.456] [2.775] [153.689] [3.730] [309.800] [154.177]Both Countries in <strong>Euro</strong>pean Union -3.056* 20.471*** -2.528[1.723] [2.852] [2.861]Both Countries in <strong>Euro</strong> Area -37.571*** -24.692*** 6.893[5.230] [6.167] [6.561]<strong>Euro</strong> Country vs EU-non <strong>Euro</strong> Country -6.361** 5.325 11.759***[2.695] [3.323] [3.577]<strong>Euro</strong> Country vs non-EU -12.888*** 15.548*** 13.616***[2.600] [3.065] [3.264]Cities Speak Same Language (Y/N) 0.738 8.348*** -2.365* -1.765** 2.032 -5.515***[0.806] [1.222] [1.227] [0.831] [1.247] [1.258]Difference in City GDP per capita (Abs. Value) 3.172*** 6.761*** 1.584* 2.680*** 5.237*** 0.986[0.344] [0.616] [0.821] [0.346] [0.620] [0.827]Difference in City Population (Abs. Value) -0.278*** 0.166** -0.092 -0.326*** 0.053 -0.1[0.054] [0.082] [0.085] [0.055] [0.082] [0.085]Difference in City Inflation 1996-2001 (Abs. Value) 0.480*** -0.598*** -1.001*** 0.531*** -0.503*** -0.887***[0.068] [0.109] [0.106] [0.069] [0.107] [0.107]Countries Share Legal Origin (Y/N) -2.415*** -7.761*** 1.145 -0.051 -1.971* 3.742***[0.610] [1.013] [0.902] [0.634] [1.049] [0.950]Difference in Country Size (Sq. Kms., Abs. Value) 0.040*** 0.075*** 0.011 0.079*** 0.163*** 0.056***[0.007] [0.012] [0.012] [0.008] [0.012] [0.012]Difference in VAT (Absolute Value) -1.240*** -3.041*** -1.087*** -0.679*** -1.800*** -0.477**[0.135] [0.217] [0.205] [0.139] [0.223] [0.208]<strong>Common</strong> Border (Y/N) -6.487*** 3.395*** -3.247*** -7.703*** -0.324 -5.277***[0.769] [1.207] [1.225] [0.776] [1.200] [1.257]Distance Between Cities -1.003*** -1.007*** -1.006*** -1.002*** -1.001*** -1.004***[0.001] [0.001] [0.001] [0.001] [0.001] [0.001]Observations 123,942 62,028 24,917 123,942 62,028 24,917Number of Items 159 92 28 159 92 28R-squared 0.99 0.98 0.99 0.99 0.98 0.99Robust standard errors in brackets* significant at 10%; ** significant at 5%; *** significant at 1%Table 10. The Magnitude of Prices and Border Width in 2001We estimate cross-sectional regressions where <strong>the</strong> endogenous variable is <strong>the</strong> width of <strong>the</strong> border between cities iand j in 2001. We use product-fixed effects, city-i fixed effects, and city-j fixed effects, in all <strong>the</strong> regressions. Thesample includes pairwise price differences between cities in <strong>Euro</strong>pe, only for <strong>the</strong> tradable items in our dataset.Distance between cities, and border width, is in kilometers. Robust standard errors are in paren<strong>the</strong>ses.
Dependent Variable: Border Width in 2001(I) (II) (III) (IV) (V)Constant 268.336*** 369.486*** 47.835*** 28.205*** 588.568***[82.895] [24.270] [4.617] [5.138] [159.553]Distance Between Cities -1.000*** -1.002*** -1.002*** -0.999*** -0.998***[0.001] [0.001] [0.001] [0.001] [0.001]Both Countries in <strong>Euro</strong>pean Union -315.505*** 0 -9.844 -0.079 126.246**[79.499] [0.000] [9.395] [1.509] [57.139]Both Countries in <strong>Euro</strong> Area 230.287*** -576.220*** 139.569*** -22.237*** -61.051[5.339] [37.643] [7.798] [3.876] [55.570]<strong>Euro</strong> Country vs non-EU 130.915*** -99.780*** 42.308*** -0.466 48.484***[2.683] [21.871] [4.534] [1.879] [14.798]<strong>Euro</strong> Country vs EU-non <strong>Euro</strong> Country 127.589*** -214.974*** 1.897 -1.219 -80.115[2.783] [21.044] [4.425] [2.133] [55.485]Trust -0.498*** -0.931*** -0.432***[0.052] [0.072] [0.058]Bilateral Trade (Imports+Exports), <strong>Euro</strong> bn -0.082*** -10.189*** -0.548***[0.013] [1.024] [0.056]Cultural Openness, Min of 2 Countries (0-10) -8.727*** -41.146*** -10.047***[1.862] [6.313] [2.625]Countries Share Legal Origin (Y/N) 0.772 -2.142*** -0.948* -2.641*** 0.3[0.565] [0.690] [0.559] [0.588] [0.518]Cities Speak Same Language (Y/N) 5.401*** 2.964*** 0.256 3.533*** -0.782[0.798] [0.865] [0.745] [0.699] [0.668]<strong>Common</strong> Border (Y/N) -2.434*** -1.266* -4.598*** -1.999*** -5.985***[0.685] [0.732] [0.646] [0.660] [0.612]Difference in City GDP per capita (Abs. Value) 3.810*** 3.701*** 3.936*** 2.406*** 2.880***[0.310] [0.330] [0.314] [0.249] [0.246]Difference in City Population (Abs. Value) -0.111** -0.095** -0.106** 0.015 -0.04[0.046] [0.046] [0.045] [0.032] [0.030]Difference in City Inflation 1996-2001 (Abs. Value) -0.196*** -0.057 -0.162*** 0.240*** -0.196***[0.055] [0.071] [0.059] [0.059] [0.055]Difference in Country Size (Sq. Kms., Abs. Value) 0.059*** 0.029*** 0.090*** 0.057*** 0.101***[0.007] [0.008] [0.007] [0.007] [0.006]Both Countries in <strong>Euro</strong>pean Union x Trust -7.219*** -1.887***[1.073] [0.262]Both Countries in <strong>Euro</strong> Area x Trust 7.921*** 2.130***[1.123] [0.276]<strong>Euro</strong> Country vs non-EU x Trust 6.755*** 0.845***[1.114] [0.256]<strong>Euro</strong> Country vs EU-non <strong>Euro</strong> Country x Trust 0.750*** 0.326***[0.067] [0.048]Both Countries in <strong>Euro</strong>pean Union x Bilateral Trade (Imports+Exports), <strong>Euro</strong> bn 5.793*** 0.703***[0.545] [0.182]Both Countries in <strong>Euro</strong> Area x Bilateral Trade (Imports+Exports), <strong>Euro</strong> bn 4.270*** -0.198[0.800] [0.176]<strong>Euro</strong> Country vs non-EU x Bilateral Trade (Imports+Exports), <strong>Euro</strong> bn 4.517*** 0.029[0.803] [0.177]<strong>Euro</strong> Country vs EU-non <strong>Euro</strong> Country x Bilateral Trade (Imports+Exports), <strong>Euro</strong> bn 10.289*** 0.771***[1.036] [0.075]Both Countries in <strong>Euro</strong>pean Union x Cultural Openness, Min of 2 Countries (0-10) -41.146 27.478*** -17.552**32.819 [5.899] [8.373]Both Countries in <strong>Euro</strong> Area x Cultural Openness, Min of 2 Countries (0-10) -8.327 2.123 3.737-3.24753 [5.304] [8.110]<strong>Euro</strong> Country vs non-EU x Cultural Openness, Min of 2 Countries (0-10) 15.329*** 11.394[1.164] [8.119]<strong>Euro</strong> Country vs EU-non <strong>Euro</strong> Country x Cultural Openness, Min of 2 Countries (0-10) 32.819*** -7.099***[5.897] [2.272]Observations 198,777 198,777 201,969 239,612 244,392Number of Items 217 217 217 217 217R-squared 0.98 0.98 0.98 0.99 0.99Robust standard errors in brackets* significant at 10%; ** significant at 5%; *** significant at 1%Table 11. Cultural Variables and Border Width in 2001We estimate cross-sectional regressions where <strong>the</strong> endogenous variable is <strong>the</strong> width of <strong>the</strong> border between cities iand j in 2001. We use product-fixed effects, city-i fixed effects, and city-j fixed effects, in all <strong>the</strong> regressions. Thesample includes pairwise price differences between cities in <strong>Euro</strong>pe, only for <strong>the</strong> tradable items in our dataset.Distance between cities, and border width, is in kilometers. Robust standard errors are in paren<strong>the</strong>ses.
FoodPerishablesDependent Variable: Change in Border Width <strong>from</strong> 2001 to 2002Food Non-Perishables Clothing Alcohol RecreationPersonalCareHouseSupplies Cars Tobaccodwidth dwidth dwidth dwidth dwidth dwidth dwidth dwidth dwidthDistance Between Cities 0 -0.003*** -0.002*** -0.001 -0.003*** 0.001 0.001 -0.002** 0.017**[0.001] [0.001] [0.001] [0.001] [0.001] [0.001] [0.001] [0.001] [0.009]Both Countries in <strong>Euro</strong>pean Union 11.156*** -1.707 3.117** -6.126*** 1.395 -2.6 6.689*** -5.619*** 13.099[1.303] [1.536] [1.506] [2.268] [2.594] [2.237] [2.240] [1.867] [10.262]Both Countries in <strong>Euro</strong> Area 4.695 4.423 5.871 8.091* 4.229 8.154* 7.95 19.599*** 19.294[3.074] [4.256] [4.017] [4.401] [4.425] [4.643] [5.969] [4.619] [17.204]<strong>Euro</strong> Country vs EU-non <strong>Euro</strong> Country -0.821 0.657 4.150* -1.857 -1.562 -0.912 1.467 7.750*** 3.097[1.644] [2.276] [2.184] [2.392] [2.353] [2.555] [3.264] [2.636] [9.133]<strong>Euro</strong> Country vs non-EU 7.506*** 1.568 1.021 -4.620** 2.18 2.622 4.289 8.661*** 13.735*[1.528] [2.069] [1.966] [2.108] [2.204] [2.119] [2.920] [2.116] [7.735]Constant -23.247*** 2.258 -6.254 17.311*** -0.735 6.125 -25.436*** -7.088 -24.698[3.093] [4.331] [4.068] [4.322] [3.909] [4.432] [6.113] [4.365] [15.042]Observations 88,466 39,426 37,720 23,850 9,650 16,695 21,527 9,158 6,045Number of Items 78 34 32 20 8 14 18 8 5R-squared 0.08 0.08 0.07 0.11 0.09 0.1 0.11 0.14 0.23Robust standard errors in brackets* significant at 10%; ** significant at 5%; *** significant at 1%Table 12. Product Categories and <strong>the</strong> Introduction of <strong>the</strong> <strong>Euro</strong>We estimate cross-sectional regressions where <strong>the</strong> endogenous variable is <strong>the</strong> change in border width between cities iand j <strong>from</strong> 2001 to 2002. We use product-fixed effects, city-i fixed effects, and city-j fixed effects, in all <strong>the</strong>regressions. Distance between cities, and border width, is in kilometers. The sample includes pairwise price differencesbetween cities in <strong>Euro</strong>pe, only for <strong>the</strong> tradable items in our dataset. Robust standard errors are in paren<strong>the</strong>ses. Theclassification into product categories follows Engel and Rogers (2004), EIU, and our own classification.
Dependent Variable: Change in Border Width <strong>from</strong> 2001 to 2002(I) (II) (III) (IV) (V)Constant -348.871*** 7.236*** 18.614*** 8.547*** -68.23[92.205] [1.457] [1.826] [1.594] [106.524]Distance Between Cities -0.001** 0.000 -0.001** 0.000 0.000[0.000] [0.000] [0.000] [0.000] [0.000]Both Countries in <strong>Euro</strong>pean Union 2.457*** 4.084*** 5.098*** 3.700*** 8.848***[0.737] [0.725] [0.906] [0.857] [1.569]Both Countries in <strong>Euro</strong> Area 9.096*** 6.892*** 5.651*** 8.935*** 0.903[1.731] [1.727] [1.776] [1.776] [2.224]<strong>Euro</strong> Country vs EU-non <strong>Euro</strong> Country 1.907** 0.541 0.651 1.505 -6.117***[0.932] [0.924] [1.086] [1.007] [1.723]<strong>Euro</strong> Country vs non-EU 4.855*** 4.241*** 4.411*** 4.881*** 3.528***[0.850] [0.838] [0.851] [0.839] [0.841]Cities Speak Same Language (Y/N) -0.416 -2.867***[0.384] [0.988]Difference in City GDP per capita (Abs. Value) 0.388** 0.878***[0.160] [0.286]Difference in City Population (Abs. Value) 0.126*** 0.168***[0.019] [0.020]Difference in City Inflation 1996-2001 (Abs. Value) 0.128*** 0.03[0.032] [0.037]Both Countries in <strong>Euro</strong>pean Union x Cities Speak Same Language (Y/N) 0[0.000]Both Countries in <strong>Euro</strong> Area x Cities Speak Same Language (Y/N) 1.858*[1.105]<strong>Euro</strong> Country vs EU-non <strong>Euro</strong> Country x Cities Speak Same Language (Y/N) 7.467***[1.244]<strong>Euro</strong> Country vs non-EU x Cities Speak Same Language (Y/N) 0.583[1.064]Both Countries in <strong>Euro</strong>pean Union x Difference in City GDP per capita (Abs. Value) -4.666***[0.998]Both Countries in <strong>Euro</strong> Area x Difference in City GDP per capita (Abs. Value) 4.552***[1.003]<strong>Euro</strong> Country vs EU-non <strong>Euro</strong> Country x Difference in City GDP per capita (Abs. Value) 1.874*[0.997]<strong>Euro</strong> Country vs non-EU x Difference in City GDP per capita (Abs. Value) -0.252[0.222]Both Countries in <strong>Euro</strong>pean Union x Difference in City Population (Abs. Value) 0.11[0.079]Both Countries in <strong>Euro</strong> Area x Difference in City Population (Abs. Value) -0.402***[0.093]<strong>Euro</strong> Country vs EU-non <strong>Euro</strong> Country x Difference in City Population (Abs. Value) -0.08[0.079]<strong>Euro</strong> Country vs non-EU x Difference in City Population (Abs. Value) -0.162***[0.044]Both Countries in <strong>Euro</strong>pean Union x Difference in City Inflation 1996-2001 (Abs. Value) -0.936***[0.276]Both Countries in <strong>Euro</strong> Area x Difference in City Inflation 1996-2001 (Abs. Value) 1.081***[0.281]<strong>Euro</strong> Country vs EU-non <strong>Euro</strong> Country x Difference in City Inflation 1996-2001 (Abs. Value) 1.254***[0.284]<strong>Euro</strong> Country vs non-EU x Difference in City Inflation 1996-2001 (Abs. Value) 0.003***[0.001]Observations 244,392 252,537 244,392 252,537 252,537Number of Items 217 217 217 217 217R-squared 0.02 0.02 0.02 0.02 0.02Robust standard errors in brackets* significant at 10%; ** significant at 5%; *** significant at 1%Table 13. The Effect of City Characteristics on <strong>the</strong> 2001 BordersWe estimate cross-sectional regressions where <strong>the</strong> endogenous variable is <strong>the</strong> width of <strong>the</strong> border between cities iand j in 2001. We use product-fixed effects, city-i fixed effects, and city-j fixed effects, in all <strong>the</strong> regressions.Distance between cities, and border width, is in kilometers. The sample includes pairwise price differencesbetween cities in <strong>Euro</strong>pe, only for <strong>the</strong> tradable items in our dataset. Robust standard errors are in paren<strong>the</strong>ses.
Dependent Variable: Change in Border Width <strong>from</strong> 2001 to 2002(I) (II) (III) (IV) (V)Constant -1.633 6.442*** 10.858*** 2.452 7.228***[1.335] [1.461] [1.742] [1.945] [1.447]Distance Between Cities 0 0 -0.001 0 0[0.000] [0.000] [0.000] [0.000] [0.000]Both Countries in <strong>Euro</strong>pean Union 4.934*** 3.960*** 5.626*** 5.952*** 4.747***[0.826] [0.728] [0.933] [1.384] [0.724]Both Countries in <strong>Euro</strong> Area 4.201** 5.533*** 6.103*** 11.579*** 6.168***[1.757] [1.717] [1.764] [1.230] [1.705]<strong>Euro</strong> Country vs EU-non <strong>Euro</strong> Country -0.549 -0.121 -1.144 0 -0.133[0.943] [0.916] [1.041] [0.000] [0.920]<strong>Euro</strong> Country vs non-EU 3.145*** 3.764*** 5.562*** 10.158*** 3.935***[0.872] [0.824] [0.893] [1.325] [0.833]Countries Share Legal Origin (Y/N) -0.656* -0.999[0.368] [1.231]Difference in Country Size (Sq. Kms., Abs. Value) -0.033*** 0.293***[0.004] [0.079]Difference in VAT (Absolute Value) 0.598*** 1.092***[0.076] [0.099]<strong>Common</strong> Border (Y/N) 0.792** -4.292***[0.398] [0.833]Both Countries in <strong>Euro</strong>pean Union x Countries Share Legal Origin (Y/N) 0[0.000]Both Countries in <strong>Euro</strong> Area x Countries Share Legal Origin (Y/N) 1.243[1.334]<strong>Euro</strong> Country vs EU-non <strong>Euro</strong> Country x Countries Share Legal Origin (Y/N) 5.679***[1.466]<strong>Euro</strong> Country vs non-EU x Countries Share Legal Origin (Y/N) -2.036[1.320]Both Countries in <strong>Euro</strong>pean Union x Difference in Country Size (Sq. Kms., Abs. Value) -0.938***[0.244]Both Countries in <strong>Euro</strong> Area x Difference in Country Size (Sq. Kms., Abs. Value) 0.609***[0.214]<strong>Euro</strong> Country vs EU-non <strong>Euro</strong> Country x Difference in Country Size (Sq. Kms., Abs. Value) 0.654***[0.214]<strong>Euro</strong> Country vs non-EU x Difference in Country Size (Sq. Kms., Abs. Value) -0.537***[0.106]Both Countries in <strong>Euro</strong>pean Union x Difference in VAT (Absolute Value) 0.06[0.177]Both Countries in <strong>Euro</strong> Area x Difference in VAT (Absolute Value) -0.900***[0.161]<strong>Euro</strong> Country vs EU-non <strong>Euro</strong> Country x Difference in VAT (Absolute Value) 0.555***[0.140]<strong>Euro</strong> Country vs non-EU x Difference in VAT (Absolute Value) -0.428***[0.090]Both Countries in <strong>Euro</strong>pean Union x <strong>Common</strong> Border (Y/N) 8.476***[1.039]Both Countries in <strong>Euro</strong> Area x <strong>Common</strong> Border (Y/N) -4.500***[0.802]<strong>Euro</strong> Country vs EU-non <strong>Euro</strong> Country x <strong>Common</strong> Border (Y/N) 0[0.000]<strong>Euro</strong> Country vs non-EU x <strong>Common</strong> Border (Y/N) 3.827***[0.841]Observations 210,887 252,537 252,537 210,887 252,537Number of Items 217 217 217 217 217R-squared 0.02 0.02 0.02 0.02 0.02Robust standard errors in brackets* significant at 10%; ** significant at 5%; *** significant at 1%Table 14. The Effect of Country Characteristics on <strong>the</strong> 2001 BordersWe estimate cross-sectional regressions where <strong>the</strong> endogenous variable is <strong>the</strong> width of <strong>the</strong> border between cities i and j in2001. We use product-fixed effects, city-i fixed effects, and city-j fixed effects, in all <strong>the</strong> regressions. Distance between citiesand border width, is in kilometers. The sample includes pairwise price differences between cities in <strong>Euro</strong>pe, only for <strong>the</strong>tradable items in our dataset. Robust standard errors are in paren<strong>the</strong>ses.
Dependent Variable: Change in Border Width <strong>from</strong> 2001 to 2002Item is lessthan 10 eurosItem is lessthan 100eurosItem is morethan 100eurosItem is lessthan 10 eurosItem is lessthan 100eurosItem is morethan 100eurosConstant -61.179 2.696 -192.461* -3.198 -983.180*** -205.852**[68.448] [1.670] [102.934] [2.557] [168.250] [103.520]Distance Between Cities 0 0.001** -0.002** 0 0.001* -0.002***[0.001] [0.001] [0.001] [0.001] [0.001] [0.001]Both Countries in <strong>Euro</strong>pean Union 3.142*** 6.792*** -4.496***[1.177] [1.564] [1.745]Both Countries in <strong>Euro</strong> Area 7.212*** 2.639 12.228***[2.647] [2.950] [3.743]<strong>Euro</strong> Country vs EU-non <strong>Euro</strong> Country 0.603 -1.306 5.432***[1.407] [1.583] [2.085]<strong>Euro</strong> Country vs non-EU 5.740*** -0.321 4.390**[1.297] [1.485] [1.775]Cities Speak Same Language (Y/N) 0.683 -0.643 -0.786 0.682 0.146 -0.644[0.575] [0.737] [0.907] [0.587] [0.753] [0.924]Difference in City GDP per capita (Abs. Value) 0.217 1.115** -1.503*** 0.186 1.268*** -1.445***[0.266] [0.438] [0.467] [0.269] [0.442] [0.471]Difference in City Population (Abs. Value) 0.171*** 0.257*** 0.062 0.183*** 0.229*** 0.082[0.038] [0.048] [0.058] [0.039] [0.048] [0.059]Difference in City Inflation 1996-2001 (Abs. Value) 0.052 0.395*** 0.139* 0.069 0.338*** 0.156**[0.047] [0.058] [0.071] [0.048] [0.058] [0.072]Countries Share Legal Origin (Y/N) -1.015* -0.714 0.246 -1.117** -1.439** 0.074[0.537] [0.602] [0.651] [0.548] [0.623] [0.689]Difference in Country Size (Sq. Kms., Abs. Value) -0.019*** -0.040*** -0.026*** -0.020*** -0.057*** -0.028***[0.005] [0.006] [0.008] [0.005] [0.007] [0.008]Difference in VAT (Absolute Value) 0.724*** 0.959*** 0.147 0.703*** 0.684*** 0.121[0.104] [0.126] [0.142] [0.107] [0.126] [0.145]<strong>Common</strong> Border (Y/N) 0.899 0.476 0.898 0.831 1.316* 0.823[0.568] [0.700] [0.793] [0.576] [0.699] [0.804]Observations 123,942 62,028 24,917 123,942 62,028 24,917Number of Items 159 92 28 159 92 28R-squared 0.02 0.03 0.03 0.02 0.03 0.03Robust standard errors in brackets* significant at 10%; ** significant at 5%; *** significant at 1%Table 15. The Magnitude of Prices and <strong>the</strong> effect of <strong>the</strong> Introduction of <strong>the</strong> <strong>Euro</strong>We estimate cross-sectional regressions where <strong>the</strong> endogenous variable is <strong>the</strong> width of <strong>the</strong> border between cities iand j in 2001. We use product-fixed effects, city-i fixed effects, and city-j fixed effects, in all <strong>the</strong> regressions.Distance between cities, and border width, is in kilometers. The sample includes pairwise price differencesbetween cities in <strong>Euro</strong>pe, only for <strong>the</strong> tradable items in our dataset. Robust standard errors are in paren<strong>the</strong>ses.
Dependent Variable: Change in Border Width <strong>from</strong> 2001 to 2002(I) (II) (III) (IV) (V)Constant -46.451 55.110*** -11.502*** -0.161 -158.880*[50.761] [12.860] [0.642] [2.316] [95.860]Distance Between Cities 0.000 0.000 0.004*** 0.000 0.000[0.000] [0.000] [0.000] [0.000] [0.000]Both Countries in <strong>Euro</strong>pean Union 126.838** 67.073*** 26.099*** 5.327*** -132.184***[49.454] [17.111] [3.660] [0.873] [34.311]Both Countries in <strong>Euro</strong> Area -24.178*** 58.379*** -16.138*** -1.179 140.892***[3.270] [17.289] [3.688] [1.796] [33.665]<strong>Euro</strong> Country vs non-EU -12.223*** 21.462* 8.410*** 2.310*** 10.682[1.654] [11.376] [0.646] [0.856] [7.999]<strong>Euro</strong> Country vs EU-non <strong>Euro</strong> Country -15.299*** 4.774 -29.444*** -0.136 121.353***[1.728] [11.330] [3.668] [1.036] [33.484]Trust 0.014 0.009 -0.189***[0.035] [0.043] [0.015]Bilateral Trade (Imports+Exports), <strong>Euro</strong> bn -0.043*** -0.204 0.058[0.009] [0.538] [0.036]Cultural Openness, Min of 2 Countries (0-10) -8.809*** -10.240*** -10.007***[1.110] [3.317] [1.511]Countries Share Legal Origin (Y/N) -0.472 2.513*** 0.148 2.105*** -0.408[0.426] [0.480] [0.416] [0.408] [0.383]Cities Speak Same Language (Y/N) -1.534*** -0.516 -0.198 -1.241*** -0.443[0.559] [0.648] [0.551] [0.441] [0.431]<strong>Common</strong> Border (Y/N) 1.985*** 0.457 1.139*** 0.514 1.314***[0.457] [0.494] [0.442] [0.416] [0.400]Difference in City GDP per capita (Abs. Value) -0.124 -0.042 0.126 0.423** 0.363**[0.216] [0.232] [0.220] [0.169] [0.165]Difference in City Population (Abs. Value) 0.171*** 0.161*** 0.163*** 0.129*** 0.139***[0.029] [0.030] [0.029] [0.020] [0.019]Difference in City Inflation 1996-2001 (Abs. Value) 0.093*** -0.107** 0.193*** -0.133*** 0.085**[0.034] [0.045] [0.037] [0.034] [0.033]Difference in Country Size (Sq. Kms., Abs. Value) -0.039*** -0.024*** -0.045*** -0.015*** -0.030***[0.004] [0.005] [0.004] [0.004] [0.004]Both Countries in <strong>Euro</strong>pean Union x Trust 0.022 0.899***[0.564] [0.162]Both Countries in <strong>Euro</strong> Area x Trust -1.551*** -0.724***[0.464] [0.175]<strong>Euro</strong> Country vs non-EU x Trust -0.355*** -0.666***[0.028] [0.158]<strong>Euro</strong> Country vs EU-non <strong>Euro</strong> Country x Trust -52.688*** -0.302***[16.800] [0.030]Both Countries in <strong>Euro</strong>pean Union x Bilateral Trade (Imports+Exports), <strong>Euro</strong> bn -1.301*** -0.293***[0.327] [0.111]Both Countries in <strong>Euro</strong> Area x Bilateral Trade (Imports+Exports), <strong>Euro</strong> bn -1.495*** 0.194*[0.326] [0.106]<strong>Euro</strong> Country vs non-EU x Bilateral Trade (Imports+Exports), <strong>Euro</strong> bn -1.654*** 0.027[0.407] [0.107]<strong>Euro</strong> Country vs EU-non <strong>Euro</strong> Country x Bilateral Trade (Imports+Exports), <strong>Euro</strong> bn -2.057*** -0.339***[0.469] [0.046]Both Countries in <strong>Euro</strong>pean Union x Cultural Openness, Min of 2 Countries (0-10) 0.926 19.799***[3.096] [5.021]Both Countries in <strong>Euro</strong> Area x Cultural Openness, Min of 2 Countries (0-10) -1.270* -19.543***[0.657] [4.911]<strong>Euro</strong> Country vs non-EU x Cultural Openness, Min of 2 Countries (0-10) -0.962 -17.586***[0.789] [4.893]<strong>Euro</strong> Country vs EU-non <strong>Euro</strong> Country x Cultural Openness, Min of 2 Countries (0-10) -2.498 -1.071[3.032] [1.234]Observations 198,777 198,777 201,969 239,612 244,392Number of Items 217 217 217 217 217R-squared 0.02 0.02 0.02 0.02 0.02Robust standard errors in brackets* significant at 10%; ** significant at 5%; *** significant at 1%Table 16. Cultural Variables and <strong>the</strong> Effect of <strong>the</strong> Introduction of <strong>the</strong> <strong>Euro</strong>We estimate cross-sectional regressions where <strong>the</strong> endogenous variable is <strong>the</strong> width of <strong>the</strong> border between cities iand j in 2001. We use product-fixed effects, city-i fixed effects, and city-j fixed effects, in all <strong>the</strong> regressions.Distance between cities, and border width, is in kilometers. The sample includes pairwise price differencesbetween cities in <strong>Euro</strong>pe, only for <strong>the</strong> tradable items in our dataset. Robust standard errors are in paren<strong>the</strong>ses.
Border Widthin 2001Border WidthChange 2001-2002Border Widthin 2001Border WidthChange 2001-2002<strong>Common</strong> Border (Y/N) -4.768*** 0.895** -4.775*** 0.875**[0.613] [0.409] [0.613] [0.409]Distance Between Cities -1.001*** 0.000 -1.001*** 0.000[0.001] [0.000] [0.001] [0.000]Constant -128.758 -36.328 36.327*** -2.691*[80.828] [49.859] [3.339] [1.475]Both Countries in <strong>Euro</strong>pean Union 5.734*** 4.041*** 5.584*** 3.610***[1.407] [0.861] [1.406] [0.861]Both Countries in <strong>Euro</strong> Area -31.597*** 6.286*** -31.794*** 5.724***[3.829] [1.812] [3.821] [1.804]One of <strong>the</strong> Currencies is a "Weak" <strong>Currency</strong> (Y/N) 75.218*** -8.353**[6.294] [3.745]Both Currencies are "Weak" Currencies (Y/N) 149.560*** -19.205***[12.213] [7.243]<strong>Euro</strong> Country vs non-EU -3.272* 4.191*** -3.471* 3.622***[1.913] [0.897] [1.902] [0.887]<strong>Euro</strong> Country vs EU-non <strong>Euro</strong> Country -2.195 0.232 -2.217 0.169[1.991] [0.964] [1.990] [0.964]Cities Speak Same Language (Y/N) -0.922 0.084 -0.863 0.253[0.661] [0.428] [0.655] [0.425]Difference in City GDP per capita (Abs. Value) 3.587*** 0.087 3.625*** 0.194[0.304] [0.216] [0.299] [0.213]Difference in City Population (Abs. Value) -0.180*** 0.178*** -0.180*** 0.179***[0.043] [0.028] [0.043] [0.028]Difference in City Inflation 1996-2001 (Abs. Value) 0.064 0.038 0.101* 0.143***[0.060] [0.037] [0.054] [0.034]Countries Share Legal Origin (Y/N) -0.369 -0.700* -0.461 -0.964**[0.525] [0.384] [0.512] [0.381]Difference in Country Size (Sq. Kms., Abs. Value) 0.102*** -0.033*** 0.102*** -0.033***[0.006] [0.004] [0.006] [0.004]Difference in VAT (Absolute Value) -1.071*** 0.607*** -1.061*** 0.635***[0.111] [0.076] [0.111] [0.075]Observations 210887 210887 210887 210887Number of Items 217 217 217 217R-squared 0.98 0.02 0.98 0.02Robust standard errors in brackets* significant at 10%; ** significant at 5%; *** significant at 1%Table 17. The Effect of <strong>Currency</strong> Characteristics on <strong>the</strong> 2001 and 2002BordersWe estimate cross-sectional regressions where <strong>the</strong> endogenous variable is <strong>the</strong>width of <strong>the</strong> border between cities i and j in 2001, and <strong>the</strong> change in border width<strong>from</strong> 2001 to 2002. We use product-fixed effects, city-i fixed effects, and city-jfixed effects, in all <strong>the</strong> regressions. Distance between cities, and border width, isin kilometers. The sample includes pairwise price differences between cities in<strong>Euro</strong>pe, only for <strong>the</strong> tradable items in our dataset. Robust standard errors are inparen<strong>the</strong>ses.
AMSTERDAMATHENSBARCELONABELGRADEBERLINBRUSSELSBUCHARESTBUDAPESTCOPENHAGENDUBLINDUSSELDORFFRANKFURTGENEVAHAMBURGHELSINKIKIEVLISBONAMSTERDAM - 2,161 1,236 1,413 576 173 1,785 1,146 621 755 179 361 690 368 1,503 1,793 1,860 359 317 734 1,479 496 827 666 914 427 709 2,014 1,307 1,741 1,125 931 1,091 612 AMSTERDAMATHENS - 1,877 808 1,803 2,088 745 1,124 2,135 2,852 1,984 1,800 1,709 2,022 2,468 1,489 2,848 2,392 1,903 1,781 2,365 2,628 1,462 1,495 2,605 2,096 1,534 4,157 1,038 526 2,408 1,287 1,601 1,616 ATHENSBARCELONA - 1,533 1,501 1,063 1,971 1,501 1,758 1,468 1,149 1,093 624 1,473 2,603 2,403 1,003 1,137 964 531 501 1,386 724 1,055 2,142 831 1,353 2,960 869 1,740 2,277 1,352 1,864 833 BARCELONABELGRADE - 999 1,373 444 315 1,326 2,146 1,241 1,062 1,126 1,228 1,729 983 2,532 1,693 1,203 1,227 2,029 1,903 890 773 1,797 1,447 739 3,371 328 1,619 493 824 963 963 BELGRADEBERLIN - 653 1,293 689 352 1,316 478 424 876 252 1,103 1,217 2,312 934 602 975 1,869 1,051 845 505 836 878 281 2,381 1,194 1,318 808 519 514 673 BERLINBRUSSELS - 1,769 1,131 766 773 175 317 533 491 1,649 1,850 1,709 322 188 567 1,314 537 696 602 1,086 261 718 2,124 1,185 1,697 1,280 912 1,159 492 BRUSSELSBUCHAREST - 639 1,571 2,534 1,623 1,452 1,568 1,542 1,749 749 2,972 2,091 1,610 1,671 2,469 2,283 1,334 1,185 2,002 1,870 1,078 3,668 1,131 294 1,742 857 946 1,394 BUCHARESTBUDAPEST - 1,011 1,895 982 813 992 926 1,458 907 2,470 1,453 978 1,103 1,975 1,642 791 563 1,481 1,247 445 3,069 814 628 1,316 218 545 793 BUDAPESTCOPENHAGEN - 1,238 627 669 1,144 286 883 1,339 2,476 958 800 1,229 2,071 985 1,160 839 484 1,025 632 2,102 1,540 1,634 521 863 667 965 COPENHAGENDUBLIN - 915 1,085 1,191 1,075 2,024 2,527 1,639 459 951 1,161 1,450 265 1,412 1,376 1,264 776 1,463 1,492 1,897 2,471 1,626 1,677 1,823 1,236 DUBLINDUSSELDORF - 182 560 340 1,505 1,664 1,863 478 184 624 1,448 662 663 486 999 411 557 2,200 1,124 1,569 1,149 767 986 447 DUSSELDORFFRANKFURT - 474 392 1,513 1,559 1,889 639 190 563 1,445 839 519 304 1,096 478 409 2,372 972 1,388 1,184 595 888 307 FRANKFURTGENEVA - 862 1,981 1,853 1,503 748 379 113 1,024 1,009 255 463 1,556 411 752 2,637 695 1,414 1,660 802 1,267 223 GENEVAHAMBURG - 1,163 1,452 2,198 725 514 943 1,786 809 902 611 708 746 489 2,143 1,319 1,552 808 736 748 697 HAMBURGHELSINKI - 1,141 3,359 1,823 1,669 2,078 2,948 1,798 1,938 1,589 787 1,908 1,301 2,411 2,208 1,944 397 1,434 912 1,777 HELSINKIKIEV - 3,362 2,148 1,748 1,967 2,873 2,252 1,689 1,406 1,637 2,037 1,155 3,378 1,685 1,025 1,275 1,064 704 1,650 KIEVLISBON - 1,582 1,710 1,389 502 1,725 1,679 1,962 2,737 1,452 2,242 2,947 1,869 2,752 2,986 2,297 2,757 1,718 LISBONLONDON - 493 737 1,263 262 960 920 1,155 342 1,035 1,884 1,448 2,016 1,433 1,234 1,449 777 LONDONLUXEMBOURG - 440 1,279 721 513 429 1,183 288 595 2,310 1,000 1,523 1,322 760 1,078 304 LUXEMBOURGLYON - 913 1,000 340 576 1,624 393 863 2,629 747 1,508 1,748 915 1,378 624 LYONMADRID - 1,460 1,184 1,483 2,387 1,053 1,771 2,889 1,370 2,251 2,591 1,809 2,288 1,243 MADRIDMANCHESTER - 1,215 1,136 1,066 606 1,208 1,629 1,690 2,230 1,401 1,428 1,561 1,000 MANCHESTERMILAN - 350 1,610 640 647 2,820 490 1,169 1,652 629 1,146 216 MILANMUNICH - 1,310 685 299 2,674 708 1,095 1,313 354 810 245 MUNICHOSLO - 1,340 1,117 1,741 2,017 2,095 415 1,345 1,060 1,403 OSLOPARIS - 883 2,226 1,120 1,758 1,541 1,032 1,365 488 PARISPRAGUE - 2,631 931 1,065 1,053 247 516 529 PRAGUEREYKJAVIK - 3,310 3,696 2,127 2,878 2,763 1,412 REYKJAVIKROME - 887 1,984 775 1,322 696 ROMESOFIA - 1,883 820 1,075 1,270 SOFIASTOCKHOLM - 1,236 808 1,470 STOCKHOLMVIENNA - 552 594 VIENNAWARSAW - 1,045 WARSAWZURICH - ZURICHLONDONLUXEMBOURGLYONMADRIDMANCHESTERMILANMUNICHOSLOPARISPRAGUEREYKJAVIKROMESOFIASTOCKHOLMVIENNAWARSAWZURICH
Appendix Table II: List of Items <strong>by</strong> CategoryTradable ItemsItem Product Category Item Product Category Item Product Category Item Product CategoryBeer, local brand (1 l) (mid-priced store) Alcohol Women's cardigan sweater (chain store) Clothing Beef: stewing, shoulder (1 kg) (mid-priced store) Food, Perishables Veal: chops (1 kg) (mid-priced store) Food, PerishablesBeer, local brand (1 l) (supermarket) Alcohol Women's cardigan sweater (mid-priced/branded store) Clothing Beef: stewing, shoulder (1 kg) (supermarket) Food, Perishables Veal: chops (1 kg) (supermarket) Food, PerishablesBeer, top quality (330 ml) (mid-priced store) Alcohol Women's raincoat, Burberry type (chain store) Clothing Butter, 500 g (mid-priced store) Food, Perishables Veal: fillet (1 kg) (mid-priced store) Food, PerishablesBeer, top quality (330 ml) (supermarket) Alcohol Women's raincoat, Burberry type (mid-priced/branded s Clothing Butter, 500 g (supermarket) Food, Perishables Veal: fillet (1 kg) (supermarket) Food, PerishablesCognac, French VSOP (700 ml) (mid-priced store) Alcohol Women's shoes, town (chain store) Clothing Carrots (1 kg) (mid-priced store) Food, Perishables Veal: roast (1 kg) (mid-priced store) Food, PerishablesCognac, French VSOP (700 ml) (supermarket) Alcohol Women's shoes, town (mid-priced/branded store) Clothing Carrots (1 kg) (supermarket) Food, Perishables Veal: roast (1 kg) (supermarket) Food, PerishablesGin, Gilbey's or equivalent (700 ml) (mid-priced store) Alcohol Chicken: frozen (1 kg) (mid-priced store) Food, Non Perishables Cheese, imported (500 g) (mid-priced store) Food, Perishables White bread, 1 kg (mid-priced store) Food, PerishablesGin, Gilbey's or equivalent (700 ml) (supermarket) Alcohol Chicken: frozen (1 kg) (supermarket) Food, Non Perishables Cheese, imported (500 g) (supermarket) Food, Perishables White bread, 1 kg (supermarket) Food, PerishablesLiqueur, Cointreau (700 ml) (mid-priced store) Alcohol Coca-Cola (1 l) (mid-priced store) Food, Non Perishables Chicken: fresh (1 kg) (mid-priced store) Food, Perishables Yoghurt, natural (150 g) (mid-priced store) Food, PerishablesLiqueur, Cointreau (700 ml) (supermarket) Alcohol Coca-Cola (1 l) (supermarket) Food, Non Perishables Chicken: fresh (1 kg) (supermarket) Food, Perishables Yoghurt, natural (150 g) (supermarket) Food, PerishablesScotch whisky, six years old (700 ml) (mid-priced store) Alcohol Cocoa (250 g) (mid-priced store) Food, Non Perishables Cornflakes (375 g) (mid-priced store) Food, Perishables Batteries (two, size D/LR20) (mid-priced store) House SuppliesScotch whisky, six years old (700 ml) (supermarket) Alcohol Cocoa (250 g) (supermarket) Food, Non Perishables Cornflakes (375 g) (supermarket) Food, Perishables Batteries (two, size D/LR20) (supermarket) House SuppliesVermouth, Martini & Rossi (1 l) (mid-priced store) Alcohol Drinking chocolate (500 g) (mid-priced store) Food, Non Perishables Eggs (12) (mid-priced store) Food, Perishables Dishwashing liquid (750 ml) (mid-priced store) House SuppliesVermouth, Martini & Rossi (1 l) (supermarket) Alcohol Drinking chocolate (500 g) (supermarket) Food, Non Perishables Eggs (12) (supermarket) Food, Perishables Dishwashing liquid (750 ml) (supermarket) House SuppliesWine, common table (1 l) (mid-priced store) Alcohol Frozen fish fingers (1 kg) (mid-priced store) Food, Non Perishables Flour, white (1 kg) (mid-priced store) Food, Perishables Electric toaster (for two slices) (mid-priced store) House SuppliesWine, common table (1 l) (supermarket) Alcohol Frozen fish fingers (1 kg) (supermarket) Food, Non Perishables Flour, white (1 kg) (supermarket) Food, Perishables Electric toaster (for two slices) (supermarket) House SuppliesWine, fine quality (700 ml) (mid-priced store) Alcohol Ground coffee (500 g) (mid-priced store) Food, Non Perishables Fresh fish (1 kg) (mid-priced store) Food, Perishables Frying pan (Teflon or good equivalent) (mid-priced store House SuppliesWine, fine quality (700 ml) (supermarket) Alcohol Ground coffee (500 g) (supermarket) Food, Non Perishables Fresh fish (1 kg) (supermarket) Food, Perishables Frying pan (Teflon or good equivalent) (supermarket) House SuppliesWine, superior quality (700 ml) (mid-priced store) Alcohol Instant coffee (125 g) (mid-priced store) Food, Non Perishables Ham: whole (1 kg) (mid-priced store) Food, Perishables Insect-killer spray (330 g) (mid-priced store) House SuppliesWine, superior quality (700 ml) (supermarket) Alcohol Instant coffee (125 g) (supermarket) Food, Non Perishables Ham: whole (1 kg) (supermarket) Food, Perishables Insect-killer spray (330 g) (supermarket) House SuppliesLow priced car (900-1299 cc) (low) Cars Mineral water (1 l) (mid-priced store) Food, Non Perishables Lamb: chops (1 kg) (mid-priced store) Food, Perishables Laundry detergent (3 l) (mid-priced store) House SuppliesLow priced car (900-1299 cc) (high) Cars Mineral water (1 l) (supermarket) Food, Non Perishables Lamb: chops (1 kg) (supermarket) Food, Perishables Laundry detergent (3 l) (supermarket) House SuppliesCompact car (1300-1799 cc) (low) Cars Olive oil (1 l) (mid-priced store) Food, Non Perishables Lamb: leg (1 kg) (mid-priced store) Food, Perishables Light bulbs (two, 60 watts) (mid-priced store) House SuppliesCompact car (1300-1799 cc) (high) Cars Olive oil (1 l) (supermarket) Food, Non Perishables Lamb: leg (1 kg) (supermarket) Food, Perishables Light bulbs (two, 60 watts) (supermarket) House SuppliesFamily car (1800-2499 cc) (low) Cars Peaches, canned (500 g) (mid-priced store) Food, Non Perishables Lamb: Stewing (1 kg) (mid-priced store) Food, Perishables Soap (100 g) (mid-priced store) House SuppliesFamily car (1800-2499 cc) (high) Cars Peaches, canned (500 g) (supermarket) Food, Non Perishables Lamb: Stewing (1 kg) (supermarket) Food, Perishables Soap (100 g) (supermarket) House SuppliesDeluxe car (2500 cc upwards) (low) Cars Peanut or corn oil (1 l) (mid-priced store) Food, Non Perishables Lemons (1 kg) (mid-priced store) Food, Perishables Toilet tissue (two rolls) (mid-priced store) House SuppliesDeluxe car (2500 cc upwards) (high) Cars Peanut or corn oil (1 l) (supermarket) Food, Non Perishables Lemons (1 kg) (supermarket) Food, Perishables Toilet tissue (two rolls) (supermarket) House SuppliesBoy's dress trousers (chain store) Clothing Peas, canned (250 g) (mid-priced store) Food, Non Perishables Lettuce (one) (mid-priced store) Food, Perishables Cigarettes, local brand (pack of 20) (mid-priced store) O<strong>the</strong>rBoy's dress trousers (mid-priced/branded store) Clothing Peas, canned (250 g) (supermarket) Food, Non Perishables Lettuce (one) (supermarket) Food, Perishables Cigarettes, local brand (pack of 20) (supermarket) O<strong>the</strong>rBoy's jacket, smart (chain store) Clothing Sliced pineapples, canned (500 g) (mid-priced store) Food, Non Perishables Margarine, 500g (mid-priced store) Food, Perishables Cigarettes, Marlboro (pack of 20) (mid-priced store) O<strong>the</strong>rBoy's jacket, smart (mid-priced/branded store) Clothing Sliced pineapples, canned (500 g) (supermarket) Food, Non Perishables Margarine, 500g (supermarket) Food, Perishables Cigarettes, Marlboro (pack of 20) (supermarket) O<strong>the</strong>rBusiness shirt, white (chain store) Clothing Tea bags (25 bags) (mid-priced store) Food, Non Perishables Milk, pasteurised (1 l) (mid-priced store) Food, Perishables Pipe tobacco (50 g) (average) O<strong>the</strong>rBusiness shirt, white (mid-priced/branded store) Clothing Tea bags (25 bags) (supermarket) Food, Non Perishables Milk, pasteurised (1 l) (supermarket) Food, Perishables Aspirins (100 tablets) (mid-priced store) Personal CareBusiness suit, two piece, medium weight (chain store) Clothing Tomatoes, canned (250 g) (mid-priced store) Food, Non Perishables Mushrooms (1 kg) (mid-priced store) Food, Perishables Aspirins (100 tablets) (supermarket) Personal CareBusiness suit, two piece, medium weight (mid-priced/bra Clothing Tomatoes, canned (250 g) (supermarket) Food, Non Perishables Mushrooms (1 kg) (supermarket) Food, Perishables Facial tissues (box of 100) (mid-priced store) Personal CareChild' s shoes, sportswear (mid-priced/branded store) Clothing Tonic water (200 ml) (mid-priced store) Food, Non Perishables Onions (1 kg) (mid-priced store) Food, Perishables Facial tissues (box of 100) (supermarket) Personal CareChild's jeans (chain store) Clothing Tonic water (200 ml) (supermarket) Food, Non Perishables Onions (1 kg) (supermarket) Food, Perishables Hand lotion (125 ml) (mid-priced store) Personal CareChild's jeans (mid-priced/branded store) Clothing White rice, 1 kg (mid-priced store) Food, Non Perishables Orange juice (1 l) (mid-priced store) Food, Perishables Hand lotion (125 ml) (supermarket) Personal CareChild's shoes, dresswear (chain store) Clothing White rice, 1 kg (supermarket) Food, Non Perishables Orange juice (1 l) (supermarket) Food, Perishables Lipstick (deluxe type) (mid-priced store) Personal CareChild's shoes, dresswear (mid-priced/branded store) Clothing Apples (1 kg) (mid-priced store) Food, Perishables Oranges (1 kg) (mid-priced store) Food, Perishables Lipstick (deluxe type) (supermarket) Personal CareChild's shoes, sportswear (chain store) Clothing Apples (1 kg) (supermarket) Food, Perishables Oranges (1 kg) (supermarket) Food, Perishables Razor blades (five pieces) (mid-priced store) Personal CareDress, ready to wear, daytime (chain store) Clothing Bacon (1 kg) (mid-priced store) Food, Perishables Pork: chops (1 kg) (mid-priced store) Food, Perishables Razor blades (five pieces) (supermarket) Personal CareDress, ready to wear, daytime (mid-priced/branded stor Clothing Bacon (1 kg) (supermarket) Food, Perishables Pork: chops (1 kg) (supermarket) Food, Perishables Shampoo & conditioner in one (400 ml) (mid-priced stor Personal CareGirl's dress (chain store) Clothing Bananas (1 kg) (mid-priced store) Food, Perishables Pork: loin (1 kg) (mid-priced store) Food, Perishables Shampoo & conditioner in one (400 ml) (supermarket) Personal CareGirl's dress (mid-priced/branded store) Clothing Bananas (1 kg) (supermarket) Food, Perishables Pork: loin (1 kg) (supermarket) Food, Perishables Toothpaste with fluoride (120 g) (mid-priced store) Personal CareMens raincoat, Burberry type (chain store) Clothing Beef: filet mignon (1 kg) (mid-priced store) Food, Perishables Potatoes (2 kg) (mid-priced store) Food, Perishables Toothpaste with fluoride (120 g) (supermarket) Personal CareMen's raincoat, Burberry type (mid-priced/branded store Clothing Beef: filet mignon (1 kg) (supermarket) Food, Perishables Potatoes (2 kg) (supermarket) Food, Perishables Compact disc album (average) RecreationMen's shoes, business wear (chain store) Clothing Beef: ground or minced (1 kg) (mid-priced store) Food, Perishables Spaghetti (1 kg) (mid-priced store) Food, Perishables Cost of six tennis balls eg Dunlop, Wilson (average) RecreationMen's shoes, business wear (mid-priced/branded store) Clothing Beef: ground or minced (1 kg) (supermarket) Food, Perishables Spaghetti (1 kg) (supermarket) Food, Perishables Daily local newspaper (average) RecreationSocks, wool mixture (chain store) Clothing Beef: roast (1 kg) (mid-priced store) Food, Perishables Sugar, white (1 kg) (mid-priced store) Food, Perishables International foreign daily newspaper (average) RecreationSocks, wool mixture (mid-priced/branded store) Clothing Beef: roast (1 kg) (supermarket) Food, Perishables Sugar, white (1 kg) (supermarket) Food, Perishables Kodak colour film (36 exposures) (average) RecreationTights, panty hose (chain store) Clothing Beef: steak, entrecote (1 kg) (mid-priced store) Food, Perishables Tomatoes (1 kg) (mid-priced store) Food, Perishables Paperback novel (at bookstore) (average) RecreationTights, panty hose (mid-priced/branded store) Clothing Beef: steak, entrecote (1 kg) (supermarket) Food, Perishables Tomatoes (1 kg) (supermarket) Food, Perishables Personal computer (64 MB) (average) RecreationTelevision, colour (66 cm) (average)Recreation
Non-Tradable ItemsCost of developing 36 colour pictures (average)International weekly news magazine (Time) (average)Simple meal for one person (average)Two-course meal for two people (average)Three course dinner for four people (average)Four best seats at <strong>the</strong>atre or concert (average)Four best seats at cinema (average)One good seat at cinema (average)Laundry (one shirt) (standard high-street outlet)Laundry (one shirt) (mid-priced outlet)Dry cleaning, man's suit (standard high-street outlet)Dry cleaning, man's suit (mid-priced outlet)Dry cleaning, woman's dress (standard high-street outlet)Dry cleaning, woman's dress (mid-priced outlet)Dry cleaning, trousers (standard high-street outlet)Dry cleaning, trousers (mid-priced outlet)Man's haircut (tips included) (average)Woman's cut & blow dry (tips included) (average)Hourly rate for domestic cleaning help (average)Maid's monthly wages (full time) (average)Ba<strong>by</strong>sitter's rate per hour (average)Cost of a tune up (but no major repairs) (low)Cost of a tune up (but no major repairs) (high)Taxi: initial meter charge (average)Taxi rate per additional kilometre (average)Taxi: airport to city centre (average)Telephone and line, monthly rental (average)Telephone, charge per local call <strong>from</strong> home (3 mins) (average)Electricity, monthly bill (average)Gas, monthly bill (average)Water, monthly bill (average)Furnished residential apartment: 1 bedroom (moderate)Furnished residential apartment: 1 bedroom (high)Furnished residential apartment: 2 bedroom (moderate)Furnished residential apartment: 2 bedroom (high)Unfurnished residential apartment: 2 bedrooms (moderate)Unfurnished residential apartment: 2 bedrooms (high)Unfurnished residential apartment: 3 bedrooms (moderate)Unfurnished residential apartment: 3 bedrooms (high)Unfurnished residential apartment: 4 bedrooms (moderate)Unfurnished residential apartment: 4 bedrooms (high)Furnished residential house: 3 bedrooms (moderate)Furnished residential house: 3 bedrooms (high)Unfurnished residential house: 3 bedrooms (moderate)Unfurnished residential house: 3 bedrooms (high)Unfurnished residential house: 4 bedrooms (moderate)Unfurnished residential house: 4 bedrooms (high)Yearly road tax or registration fee (low)Yearly road tax or registration fee (high)Annual premium for car insurance (low)Annual premium for car insurance (high)Regular unleaded petrol (1 l) (average)Green fees on a public golf course (average)Hire of tennis court for one hour (average)Entrance fee to a public swimming pool (average)One drink at bar of first class hotel (average)Fast food snack: hamburger, fries and drink (average)Routine checkup at family doctor (average)One X-ray at doctor's office or hospital (average)Visit to dentist (one X-ray and one filling) (average)Business trip, typical daily costHilton-type hotel, single room, one night including breakfast (average)Moderate hotel, single room, one night including breakfast (average)Heating oil (100 l) (average)Office rent per sq metre per yearTypical lease term for office property (years)Industrial space, per sq metre per yearFrench school: annual tuition, ages 5-12 (average)French school: annual tuition, ages 13-17 (average)French school: extra costs, ages 5-12 (average)French school: extra costs, ages 13-17 (average)French school: kindergarten annual fees (average)German school: annual tuition, ages 5-12 (average)German school: annual tuition, ages 13-17 (average)German school: extra costs, ages 5-12 (average)German school: extra costs, ages 13-17 (average)German school: kindergarten annual fees (average)American /English school: annual tuition, ages 5-12 (average)American/English school: annual tuition, ages 13-17 (average)American/English school: extra costs, ages 5-12 (average)American/English school: extra costs, ages 13-17 (average)American/English school: kindergarten annual fees (average)
Variable Definition SourceCity prices Prices in <strong>Euro</strong>s for Items (Appendix II) and Cities (Table 1) Economist Intelligence UnitCumulative inflationEconomist Intelligence UnitCity populationCity wealthAbsolute value of <strong>the</strong> difference in Price Index 1996-2001. Index base1996=100http://www.citypopulation.de/<strong>Euro</strong>pe.htmlhttp://www.citymayors.com/features/euro_cities.htmlhttp://en.wikipedia.org/wiki/Largest_cities_of_<strong>the</strong>_<strong>Euro</strong>pean_Union_<strong>by</strong>_population_within_city_limits#Top_100_administrative_unitshttp://randburg.com/is/capital/facts-figures-about-Reykjavik.pdfhttp://www.citymayors.com/statistics/richest-cities-2005.htmlhttp://www.communities.gov.uk/pub/129/Competitive<strong>Euro</strong>peanCitiesWheredo<strong>the</strong>CoreCitiesStandFullReport_id1508129.dochttp://www.ine.es/daco/daco42/cre00/cre0106u.xlshttp://www.oslo.technopole.no/cgi/wbch3.exe?p=1306Flying distance between cities GeoBytes and ETN http://www.geo<strong>by</strong>tes.com/CityDistanceTool.htmhttp://www.etn.nl/distanc4.htmCountry size CIA World Factbook CIA World FactbookVATAbsolute value of <strong>the</strong> difference in Country's VAT rates (in percent) <strong>Euro</strong>pean UnionBordering countriesbCIAtWorlditFactbooki d it jCIA World FactbookLegal originCIA World FactbookTrustAbsolute value of <strong>the</strong> difference in City polulation between city i and city j(both in millions) divided <strong>by</strong> <strong>the</strong> minimum of <strong>the</strong> twoAbsolute value of <strong>the</strong> difference in City's GDP per capita between city iand city j (both in euros) divided <strong>by</strong> <strong>the</strong> minimum of <strong>the</strong> two. When cityGDP per Capita is not available, we use <strong>the</strong> Country's GDP per capita asa proxyLegal origin identifies <strong>the</strong> origin of <strong>the</strong> Company Law or CommercialCode in each countryTrust is calculated <strong>by</strong> taking <strong>the</strong> average response to <strong>the</strong> followingquestion: ”I would like to ask you a question about how much trust youhave in people <strong>from</strong> various countries. For each, please tell me whe<strong>the</strong>ryou have a lot of trust, some trust, not very much trust or no trust at all”.The answers are coded in <strong>the</strong> following way:=1 ( no trust at all), = 2 (notvery much trust), =3 (some trust), =4 (a lot of trust).Guiso, Sapienza, and Zingales (2007)Bilateral tradeCultural OpenessSum of Imports and Exports (in euro billion) between country i andcountry jThe Cultural Openess index ranges <strong>from</strong> 0 to 10 and measures whe<strong>the</strong>r<strong>the</strong> national culture is open to foreign ideas, based on a surveyconducted among business managers across <strong>the</strong> world.World Bank Development IndicatorsIMD World Competitiveness CenterAppendix Table III. Variable Definitions and SourcesVariables used in <strong>the</strong> paper, definitions and sources