Water Balance - The Next Stage - Iwa-waterloss.org
Water Balance - The Next Stage - Iwa-waterloss.org
Water Balance - The Next Stage - Iwa-waterloss.org
Create successful ePaper yourself
Turn your PDF publications into a flip-book with our unique Google optimized e-Paper software.
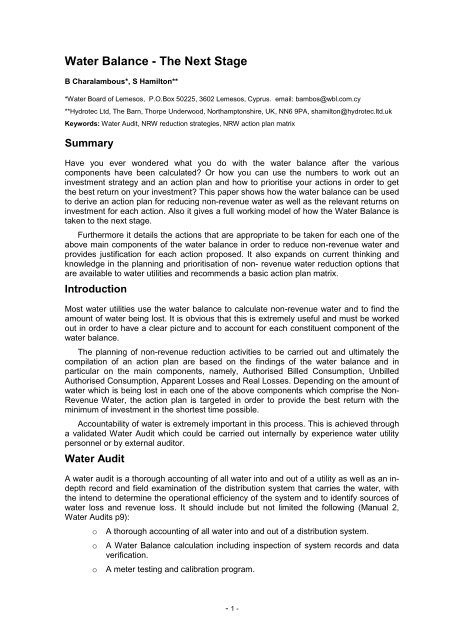
<strong>Water</strong> <strong>Balance</strong> - <strong>The</strong> <strong>Next</strong> <strong>Stage</strong>B Charalambous*, S Hamilton***<strong>Water</strong> Board of Lemesos, P.O.Box 50225, 3602 Lemesos, Cyprus. email: bambos@wbl.com.cy**Hydrotec Ltd, <strong>The</strong> Barn, Thorpe Underwood, Northamptonshire, UK, NN6 9PA, shamilton@hydrotec.ltd.ukKeywords: <strong>Water</strong> Audit, NRW reduction strategies, NRW action plan matrixSummaryHave you ever wondered what you do with the water balance after the variouscomponents have been calculated? Or how you can use the numbers to work out aninvestment strategy and an action plan and how to prioritise your actions in order to getthe best return on your investment? This paper shows how the water balance can be usedto derive an action plan for reducing non-revenue water as well as the relevant returns oninvestment for each action. Also it gives a full working model of how the <strong>Water</strong> <strong>Balance</strong> istaken to the next stage.Furthermore it details the actions that are appropriate to be taken for each one of theabove main components of the water balance in order to reduce non-revenue water andprovides justification for each action proposed. It also expands on current thinking andknowledge in the planning and prioritisation of non- revenue water reduction options thatare available to water utilities and recommends a basic action plan matrix.IntroductionMost water utilities use the water balance to calculate non-revenue water and to find theamount of water being lost. It is obvious that this is extremely useful and must be workedout in order to have a clear picture and to account for each constituent component of thewater balance.<strong>The</strong> planning of non-revenue reduction activities to be carried out and ultimately thecompilation of an action plan are based on the findings of the water balance and inparticular on the main components, namely, Authorised Billed Consumption, UnbilledAuthorised Consumption, Apparent Losses and Real Losses. Depending on the amount ofwater which is being lost in each one of the above components which comprise the Non-Revenue <strong>Water</strong>, the action plan is targeted in order to provide the best return with theminimum of investment in the shortest time possible.Accountability of water is extremely important in this process. This is achieved througha validated <strong>Water</strong> Audit which could be carried out internally by experience water utilitypersonnel or by external auditor.<strong>Water</strong> AuditA water audit is a thorough accounting of all water into and out of a utility as well as an indepthrecord and field examination of the distribution system that carries the water, withthe intend to determine the operational efficiency of the system and to identify sources ofwater loss and revenue loss. It should include but not limited the following (Manual 2,<strong>Water</strong> Audits p9):oooA thorough accounting of all water into and out of a distribution system.A <strong>Water</strong> <strong>Balance</strong> calculation including inspection of system records and dataverification.A meter testing and calibration program.- 1 -
A water audit is a critical first step in the establishment of an effective water lossmanagement program. With the successful completion of a system water audit, the utilitygains a quantified understanding of the integrity of the distribution system and begin toformulate an economically sound plan to address losses. <strong>Water</strong> loss in a public watersystem can be a major operational issue. Non-revenue water components cansignificantly affect the financial stability of the utility. Addressing the issues associated withthe non-revenue components will certainly entail a significant cost for the utility. <strong>The</strong>economic trade-offs between value of lost water given it generates no revenue and theinvestment to reduce this loss requires careful planning and economic judgment. <strong>The</strong>utility needs to clearly understand the type of loss as well as its magnitude. <strong>Water</strong>resource, financial and operational consequences must be weighed when consideringthese issues and the decision taken is unique to every system.A brief summary of the main steps to perform an initial water audit is given below forease of reference:1. <strong>The</strong> amount of water put into the distribution system is determined.2. <strong>The</strong> authorised consumption (billed + unbilled) is obtained from records.3. <strong>Water</strong> losses are calculated (water losses = system input – authorisedconsumption).4. Apparent losses are estimated (theft + meter error + billing errors andadjustments).5. Real losses are calculated (real losses = water losses – apparent losses).<strong>The</strong> above steps are an example of a top down audit, which starts at the “top” withexisting information and records. It may also be known as a desktop audit or paper auditsince no additional field work is required. Distribution systems are dynamic. <strong>The</strong> auditprocess and water balance has to be periodically performed to be meaningful to a utility‟swater loss management program.After performing an initial top down audit it may become evident that some of thenumbers are approximate estimates and inspire little confidence in their accuracy. <strong>The</strong>next action in the audit process is to refine the quantities that may have been initiallyestimated and begin reducing non-revenue water losses. A bottom up approach is oftenimplemented after top down audit has been completed which can help in identifying thereal losses component more accurately thus adjusting the initial Apparent losses estimate.A bottom up approach will help with finding real losses and begins by looking atcomponents or discrete areas in the distribution system. It also assesses and verifies theaccuracy of the water loss data associated with individual components of the distributionsystem.It is important to stress that although utility personnel are well experienced and arefamiliar with the operational characteristics of the network it may be worth while having anexternal or independent audit carried out. External audits are usually an excellent way ofhelping water utilities to analyse and improve their data. It must stressed the externalaudits are an independent process, ensure accurate reporting, improve data collectionand accuracy by identifying statistical and reporting errors and is an excellent method ofhelping utilities to improve their performance.<strong>The</strong>re are many types of audits that will analyse water use, from distribution systembalances to household reviews. <strong>The</strong> accuracy of results depends on the methods used togenerate the data. Audits have an important part to play in the development of strategicaction plans for water efficiencies and financial savings as well as short and long termmanagement. <strong>The</strong>refore it is vital they are undertaken in ways which ensure that the mostaccurate data possible is generated (Queensland Environmental Protection Agency /Wide Bay <strong>Water</strong>, Manual 2, <strong>Water</strong> Audits p43).- 2 -
Assessing Losses – IWA <strong>Water</strong> <strong>Balance</strong>A significant contribution to reaching the point of water accountability was theestablishment of the IWA <strong>Water</strong> <strong>Balance</strong> (Figure 1) which is a useful tool in analysing thevarious components of water production, storage and distribution. Through this analysisthe utility will gain an understanding of the magnitude of the water loss problem and willset priorities for rectifying the situation based on the component analysis of the Revenueand Non-Revenue <strong>Water</strong> elements.Figure 1, IWA <strong>Water</strong> <strong>Balance</strong><strong>The</strong> findings from the water balance and in particular its main components should:oooAssist in estimating the best return with the minimum of investment in theshortest time possibleForm the basis for planning NRW reduction activitiesProvide sufficient information for an effective action planIt is strange however, that for a number of reasons instead of following the abovedesired results a different approach is adopted which follows the steps below:ooooooooLimited and / or unreliable data is usedCalculate non-revenue waterFind the amount of water lostDo not like the outcomeChange assumptions made to suitManagement „blaming‟ staff for not doing their jobEmployees pointing out lack of funding, commitment and support bymanagementFinally, work out figures to suit management and employees- 3 -
Obviously the above approach will result in serious problems for the utility and it mustbe avoided at any cost. <strong>The</strong> <strong>Water</strong> <strong>Balance</strong> is a useful tool which if used correctly it willcertainly point the way to the actions and measures that need to be taken to reduce NRW.Answers to the questions below will take you to the next stage from the desk top to thefield environment.• Have you ever wondered what you do with the water balance after the variouscomponents have been calculated?• Or how you can use the numbers to work out an investment strategy and an actionplan?• Or how to prioritise your actions in order to get the best return on your investment?Answers to the above questions and what could be done with the water balance will bedemonstrated using examples from case studies.Case Study ExamplesTop Down ApproachIn this example the constituent components of the water balance are entered into thewater balance using absolute volume figures and working out the correspondingpercentage figures. It is this percentage figures which are usually quoted and has to bestressed that they could be misleading as a performance indicator since they are stronglyinfluenced by consumption as well as changes in consumption.Figure 2, Top down approach using the IWA <strong>Water</strong> <strong>Balance</strong><strong>The</strong> Non Revenue <strong>Water</strong> is often expressed as a percentage of the System InputVolume. However, a true financial performance indicator needs to reflect costs as well asvolumes. An improved financial indicator can be used by converting the Non Revenue<strong>Water</strong> Volume to values. An example is shown in Table 1 below where the NRW volumes- 4 -
in the above <strong>Water</strong> <strong>Balance</strong> were converted to values using the corresponding unit valuefor water. <strong>The</strong> unit value for Unbilled Authorised Consumption and Apparent Losses isusually the average sale price of water to customers. <strong>The</strong> unit value for Real Losses isusually taken as the marginal cost of water that is the unit cost of producing anddistributing water into the network or bulk charge whichever is the higher.Table 1: Converting NRW Volume Components to ValuesFrom Table 1 it can be seen that the Real Losses have the biggest financial loss forthe utility and it is evident that this area is critical and should be examined further. Thisexamination should provide proof that repairing the leaks and savings this amount ofwater which is being lost makes financial sense for the utility. In order to arrive at thisresult the following methodology needs to be followed.From the top down analysis in Figure 1 the amount of detectable losses are 1047938m 3 . This figure is equivalent to a Night Line reduction of 1047938 m 3 / 365 days / 20 hrs=144 m 3 /hr. Assuming an average leak of the order of 1.6 m 3 /hr then the number ofequivalent leaks that should be located and repaired is 90. Given that the network lengthis 345 km it works out that there is on average 1 leak every 3.83 km. Assume a leakagedetection team comprises 2 technicians with an average output of 2.5 km per day, 5 dayworking week and a weekly charge of €5000/week. <strong>The</strong> average number of leaks foundby the team per week is 5 x 2.5 /3.83= 3.26, say 3 leaks found per week. <strong>The</strong> total timerequired to find all leaks will be 90 leaks / 3= 30 weeks. Based on the above the followingfinancial calculations can be madeo Total Cost for locating leaks= 30 x €5000 = €150000o Total Cost for repairing leaks= 90 x €1500= €135000o <strong>Water</strong> Saving = 1047938 m 3 x €0.8/m 3 = €838350o NET SAVING = € 838350 - € 150000 - €135000 = €553350It obvious from the above calculation that the utility will have a considerable saving bymoving forward with repairing the leaks first and an action plan to this effect should bework out.In order to highlight a different approach to the above the apparent losses in Table 1 areincreased with the corresponding reduction in the real losses. <strong>The</strong> revised figures areshown in Table 2 below.- 5 -
Table 2: Converting NRW Volume Components to Values (Revised)In this instance the action plan needs to be different to the above for the followingreasons:ooooo<strong>The</strong> Apparent Losses are almost equal to Real Losses in terms of revenue lossNeed to deploy a strategy that will maximise benefitsTackle apparent losses with the minimum expenditure; reduce unauthorisedconsumption, meter reading and accounting errors at the first instance whichwill increase revenue.Simultaneously reduce leakage in order to save money in producing / buyingless water.Invest savings in further reducing Apparent and Real Losses.Bottom Up Audit – Case study to show bottom up and top down comparisonsIt this example it is explained how the bottom up audit is extremely useful incomplementing the top down approach. <strong>The</strong> case study data used are of the area of „Sky‟in Piraeus, Greece (Kanellopoulou, S., 2011). <strong>The</strong> main characteristics of the area are asfollows:oLength of network= 56kmo Number of consumers= 16840o Service connections= 4000A top down approach is carried out and the result is given in the table below. It should benoted that under the Real Losses the two main constituent components are included:ooBackground Leakage on mains and service connections, andDetactable Losses- 6 -
Table 3: Top down approach for the area of Sky, Piraeus, GreeceDescription M 3 / year Average Daily Volume (m 3 )Input volume 2 898 100 7940Construction 1 881 575 5155Non-revenue water 1 016 525 2785Unbilled Authorised Consumption (measured) 26Apparent Losses (assumed 2.5% of consumption) 129Real Losses 2630In order to verify the assumption made for the Apparent Losses a bottom up audit willbe carried out based on measured values. <strong>The</strong> Minimum Night Flow (MNF) as measuredis shown in Figure 3. <strong>The</strong> Minimum Night Flow is 55 lit/sec (198 m 3 /hr). Based on thismeasured figure a bottom up audit is carried out of the constituent components of theMNF in order to arrive at the amount of potentially detectable losses as shown in Table 4.Figure 3, Minimum Night Flow Diagram for the area of Sky, Piraeus, GreeceAs it can be seen from Table 4 below the potentially Detectable Losses are 2352 m 3per day compared to the overall figure of 2631 m 3 per day estimated for all Real Losses inthe system using the Top Down approach (Table 3).This exercise shows that the initial assumption for Apparent Losses is reasonable andthe NRW reduction plan should concentrate on reducing the Real Losses particularly inlocating and repairing the leaks in the distribution network. <strong>The</strong> potentially detectablelosses comprise 89% of the overall Real Losses which is of the right order consideringthat apart from a small percentage of Background Losses and Customer Night Use the- 7 -
emainder is attributed to losses in the distribution network which could potentially belocated and repaired. Of course the Economic Level of Leakage must be taken intoconsideration in deciding how much of the amount of potentially detectable losses isfinancially worthwhile recovering.Table 4: Bottom up audit for the area of Sky, Piraeus, GreeceDescription m 3 / hr Daily (m 3 )Minimum Night Flow(measured)Background Losses(calculated)198 198 x 20hr=396021 21 x 24= 504Customer Night Use 46 46 x 24= 1104Potentially DetectableLosses3960-504-1104 2352Benchmarking of Non-Revenue <strong>Water</strong>It is extremely useful to have a matrix which could be used to benchmark theperformance of a utility based on the NRW figures.<strong>The</strong> authors have developed and are proposing for use an action plan matrix which isbased on the percentage of System Input Volume for each constituent component of theNon Revenue <strong>Water</strong>. <strong>The</strong> action plan matrix which is shown in Table 5 provides guidanceas to the general actions that could be taken depending on the percentage figure in orderto reduce the NRW in each component.Of course the proposed matrix is only a guideline and much more investigation anddevelopment of this Matrix is required. <strong>The</strong> intention is to provide a guideline as to thegeneral actions required which could be carried out by the utility whilst collecting andvalidating further data and information for more detailed analysis which will result inspecific water loss management strategies.Table 5: Proposed Action Plan Matrix for NRW- 8 -
ConclusionsIt could not be stressed enough that utilities must target their actions and investmentsin order to get the maximum benefit. To achieve this it is important to have the necessaryknowhow either internally or externally in order to be in a position to justify a proposedNRW reduction action plan which above all should be financially viable and sustainable.Needles to say in order to carry out such a plan the right level of knowledge andexperience are required.So, tackle first whatever gives you the quickest revenue return which will providemoney for the longer term savings – think of the returns and not get caught up in theexpensive solutions because it may be more attractive.It is important to be understood that the <strong>Water</strong> <strong>Balance</strong> is the starting point for anyNRW work. This paper aims to show that this could be done at the very early stageswithout having to wait until DMAs, pressure management, etc. are set up and datacollected and analysed.<strong>The</strong> <strong>Water</strong> <strong>Balance</strong> provides sufficient information to assist in the drafting of a NRWmaster plan in order to move ahead with water loss reduction and in parallel to makestrategic improvements to the network. In the past it was thought necessary, mostly indeveloping countries, to develop DMAS in order to drive a NRW reduction master plan.<strong>The</strong> authors are suggesting that this could be done in parallel and that in the initial stagesthe <strong>Water</strong> <strong>Balance</strong> is the vehicle for driving a NRW Master Plan.ReferencesLambert A., Assessing Non Revenue water and its components, <strong>Water</strong>21 article, IWA, 2002.Manual 2, <strong>Water</strong> Audits, State of Queensland Environmental Protection Agency, Wide Bay <strong>Water</strong>, 2002, p9,p43, p54.Kanellopoulou S., Data from „Sky‟ DMA, Piraeus, Greece, 2011- 9 -


