
You also want an ePaper? Increase the reach of your titles
YUMPU automatically turns print PDFs into web optimized ePapers that Google loves.
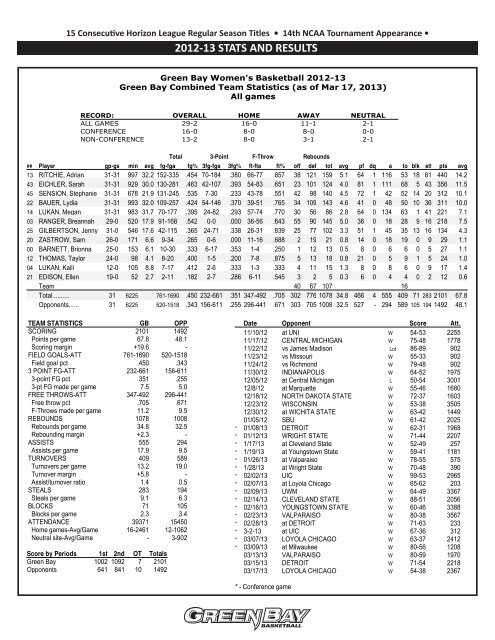
15 Consecutive Horizon League Regular Season Titles • 14th NCAA Tournament Appearance •2012-13 STATS AND RESULTSGreen Bay Women's Basketball 2012-13Green Bay Combined Team Statistics (as of Mar 17, 2013)All gamesRECORD: OVERALL HOME AWAY NEUTRALALL GAMES 29-2 16-0 11-1 2-1CONFERENCE 16-0 8-0 8-0 0-0NON-CONFERENCE 13-2 8-0 3-1 2-1Total 3-Point F-Throw Rebounds## Player gp-gs min avg fg-fga fg% 3fg-fga 3fg% ft-fta ft% off def tot avg pf dq a to blk stl pts avg13 RITCHIE, Adrian 31-31 997 32.2 152-335 .454 70-184 .380 66-77 .857 38 121 159 5.1 64 1 116 53 18 81 440 14.243 EICHLER, Sarah 31-31 929 30.0 130-281 .463 42-107 .393 54-83 .651 23 101 124 4.0 81 1 111 68 5 43 356 11.545 SENSION, Stephanie 31-31 678 21.9 131-245 .535 7-30 .233 43-78 .551 42 98 140 4.5 72 1 42 52 14 20 312 10.122 BAUER, Lydia 31-31 993 32.0 109-257 .424 54-146 .370 39-51 .765 34 109 143 4.6 41 0 48 50 10 36 311 10.014 LUKAN, Megan 31-31 983 31.7 70-177 .395 24-82 .293 57-74 .770 30 56 86 2.8 64 0 134 63 1 41 221 7.103 RANGER, Breannah 29-0 520 17.9 91-168 .542 0-0 .000 36-56 .643 55 90 145 5.0 36 0 18 28 9 16 218 7.525 GILBERTSON, Jenny 31-0 546 17.6 42-115 .365 24-71 .338 26-31 .839 25 77 102 3.3 51 1 45 35 13 16 134 4.320 ZASTROW, Sam 26-0 171 6.6 9-34 .265 0-6 .000 11-16 .688 2 19 21 0.8 14 0 18 19 0 9 29 1.100 BARNETT, Brionna 25-0 153 6.1 10-30 .333 6-17 .353 1-4 .250 1 12 13 0.5 8 0 6 6 0 5 27 1.112 THOMAS, Taylor 24-0 98 4.1 8-20 .400 1-5 .200 7-8 .875 5 13 18 0.8 21 0 5 9 1 5 24 1.004 LUKAN, Kaili 12-0 105 8.8 7-17 .412 2-6 .333 1-3 .333 4 11 15 1.3 8 0 8 6 0 9 17 1.421 EDISON, Ellen 19-0 52 2.7 2-11 .182 2-7 .286 6-11 .545 3 2 5 0.3 6 0 4 4 0 2 12 0.6Team 40 67 107 16Total.......... 31 6225 761-1690 .450 232-661 .351 347-492 .705 302 776 1078 34.8 466 4 555 409 71 283 2101 67.8Opponents...... 31 6225 520-1518 .343 156-611 .255 296-441 .671 303 705 1008 32.5 527 - 294 589 105 194 1492 48.1TEAM STATISTICS GB OPPSCORING 2101 1492Points per game 67.8 48.1Scoring margin +19.6 -FIELD GOALS-ATT 761-1690 520-1518Field goal pct .450 .3433 POINT FG-ATT 232-661 156-6113-point FG pct .351 .2553-pt FG made per game 7.5 5.0FREE THROWS-ATT 347-492 296-441Free throw pct .705 .671F-Throws made per game 11.2 9.5REBOUNDS 1078 1008Rebounds per game 34.8 32.5Rebounding margin +2.3 -ASSISTS 555 294Assists per game 17.9 9.5TURNOVERS 409 589Turnovers per game 13.2 19.0Turnover margin +5.8 -Assist/turnover ratio 1.4 0.5STEALS 283 194Steals per game 9.1 6.3BLOCKS 71 105Blocks per game 2.3 3.4ATTENDANCE 39371 15450Home games-Avg/Game 16-2461 12-1062Neutral site-Avg/Game - 3-902Score by Periods 1st 2nd OT TotalsGreen Bay 1002 1092 7 2101Opponents 641 841 10 1492Date Opponent Score Att.11/10/12 at UNI W 54-53 225511/17/12 CENTRAL MICHIGAN W 75-48 177811/22/12 vs James Madison Lot 86-89 90211/23/12 vs Missouri W 55-33 90211/24/12 vs Richmond W 79-48 90211/30/12 INDIANAPOLIS W 64-52 197512/05/12 at Central Michigan L 50-54 300112/8/12 at Marquette W 55-46 168012/18/12 NORTH DAKOTA STATE W 72-37 160312/23/12 WISCONSIN W 53-38 350512/30/12 at WICHITA STATE W 63-42 144901/05/12 SBU W 61-42 2025* 01/08/13 DETROIT W 62-31 1968* 01/12/13 WRIGHT STATE W 71-44 2207* 1/17/13 at Cleveland State W 52-49 257* 1/19/13 at Youngstown State W 59-41 1181* 01/26/13 at Valparaiso W 78-55 575* 1/28/13 at Wright State W 70-48 390* 02/02/13 UIC W 99-53 2965* 02/07/13 at Loyola Chicago W 65-62 203* 02/09/13 UWM W 64-49 3367* 02/14/13 CLEVELAND STATE W 88-51 2056* 02/16/13 YOUNGSTOWN STATE W 60-46 3388* 02/23/13 VALPARAISO W 80-38 3567* 02/28/13 at DETROIT W 71-63 233* 3-2-13 at UIC W 67-36 312* 03/07/13 LOYOLA CHICAGO W 63-37 2412* 03/09/13 at Milwaukee W 80-56 120803/13/13 VALPARAISO W 80-59 197003/15/13 DETROIT W 71-54 221803/17/13 LOYOLA CHICAGO W 54-38 2367* - Conference game