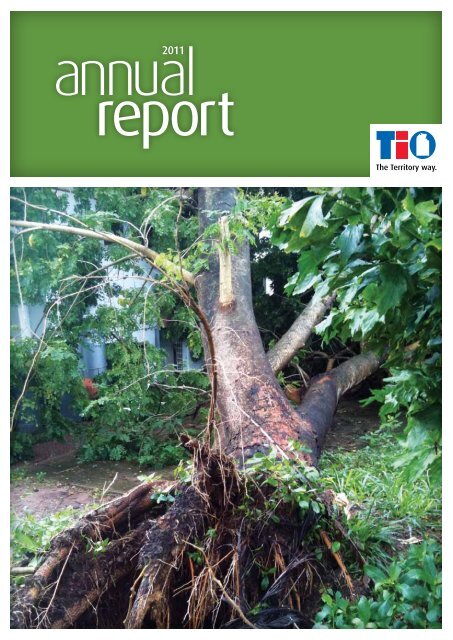
Annual Report 2011 - TIO
Annual Report 2011 - TIO
Annual Report 2011 - TIO

You also want an ePaper? Increase the reach of your titles
YUMPU automatically turns print PDFs into web optimized ePapers that Google loves.
1“I had my car booked in for repair the verynext morning – it was so simple! It’s great toknow I have my insurance in the right place.Judith CampbellPolicy holder, pictured withher children Miles and Stella“
The Territory way. <strong>TIO</strong> <strong>Annual</strong> <strong>Report</strong> 2010/<strong>2011</strong>About <strong>TIO</strong>Our Charter<strong>TIO</strong> was established under Section 4 of the Territory Insurance Office Act 1979 andcommenced operations on 1 July 1979. Its policies and contracts of insurance orindemnity, deposits placed with it and liabilities in relation to the Motor AccidentsCompensation business are guaranteed by the Northern Territory Government underSection 30 of the Act. The functions of <strong>TIO</strong> are defined under Section 5.2They are:››To act as an insurer in respect ofthe assets and prospective liabilitiesof the Territory and statutorycorporations.››To transact Workers Compensationinsurance in respect of personsrequired by the Workers Rehabilitationand Compensation Act, or any Actreplacing that Act, to insure.››To administer a Motor AccidentCompensation Scheme in accordancewith an Act or an agreementbetween <strong>TIO</strong> and the person orbody responsible for the scheme.››To carry out such functions in relationto the management and controlof moneys and other assets of theTerritory and statutory corporations,and on such terms and conditionsas the Minister directs.››To provide such financial servicesas are approved by the Minister.››To transact such general businessof insurance as the Minister directs.››To promote and participatein the promotion of road andindustrial safety.››Such other functions as are, from timeto time, imposed upon it by or underany other Act.From comprehensive and disasterinsurance through to home loans,<strong>TIO</strong>’s complete range of productshelps to build confidence andresilience among Territorians.Our Business<strong>TIO</strong> is a statutory corporation owned bythe NT Government. It provides insuranceand financial services to Territorians andoperates on a commercial basis.It was established by the NorthernTerritory Government in 1979 to provideinsurance cover within the NorthernTerritory. It particularly focuses on meetingthe unique needs of the Territory.Over the years, the business hasdiversified and now includes financialservices, insurance, the administration anddelivery of NT schemes for compulsorypersonal injury motor accidentscompensation and Government homeloans for low to middle income earners.While <strong>TIO</strong> is “guaranteed” by theGovernment, the organisation operateson a commercial basis and is committedto complying with Australian PrudentialRegulation Authority (APRA) standards andachieving key industry benchmarks.
Our Purpose<strong>TIO</strong>’s purpose is to help build confidence and resilience in the Territory. It does so byconcentrating on three areas:››Road Safety – educate and influencecommunity attitudes to reducethe number and severity of roadaccidents and improve motoraccident compensation andinsurance claim outcomes.››Community Resilience – promoteand support community preparation,property maintenance and insurancecover to build resilience againsteconomic loss, resume their lifestyleafter loss, and reduce the severityof insurance claims as a result ofsevere events.››Home Ownership – promotethe benefits of and pathways tohomeownership to increase family,social, and financial stability andstrengthen the community byincreasing access to home ownership.In addition to these key themes <strong>TIO</strong> also recognises its role in the community in supportof all of the NT population.3<strong>TIO</strong>’s Branches at Alice Springs, Katherine,Palmerston and Darwin City are complementedby extensive on-line and telephone access options.This <strong>Report</strong>Under Section 27 of the Territory InsuranceOffice Act 1979, the Board is required toprepare an annual report and financialstatements for submission to the Minister,who is required to present them tothe Legislative Assembly. This reportis prepared in accordance with thoserequirements.This report is also intended to inform<strong>TIO</strong> customers, other stakeholders andinterested parties of the performanceof <strong>TIO</strong> during the 2010/<strong>2011</strong> year asit relates to our purpose, values andstrategic goals.
The Territory way. <strong>TIO</strong> <strong>Annual</strong> <strong>Report</strong> 2010/<strong>2011</strong>4Chairman’s OverviewThe past year has seen <strong>TIO</strong> consolidatestrategies put in place to focus oncontinuing to improve the strengthand sustainability of our business forTerritorians. The results we see now aretestament to a journey we began severalyears ago to refocus our purpose andrealign our business.Net profit after tax increased comparedto the previous year. Most pleasingwas the contribution that all threebusinesses made to the group position.It is also pleasing to see that underlyingperformance has made a majorcontribution to profit and surplus results.Although investment returns play animportant part in company profitability,we only need to consider the impact theinvestment market had on our companytwo years ago to underline the need toensure our businesses are performingat a high level.The nature of our business means wewill always be subject to the volatilityof investment markets. However, strongunderlying profitability and the capitalstrength of our business ensures <strong>TIO</strong> is ina good position to weather future events.Of particular note this year was theimpact of Cyclone Carlos and heavy rainfallin the Top End. Cyclone Carlos resulted in$9.57 million in claims, one of the largestevents in recent <strong>TIO</strong> history. While thispales into insignificance against a globalbackdrop of natural disasters this pastyear, it is a reminder that the Territory issubject to extreme weather events andunderlines our role in helping Territoriansbuild resilience against such impacts.Board ChangesIn last year’s <strong>Annual</strong> <strong>Report</strong>, our thenChairman John Flynn talked of the needfor renewal on the Board. This year, muchof that renewal was achieved, with fivemembers retiring and five new Boardmembers welcomed.focus that he was so well respected for,both within our business and the broadercommunity. We wish him well in hisretirement in Darwin and I am sure he willcontinue to take a strong interest in theactivities of <strong>TIO</strong>.Our Deputy Chairman John Messengeralso retired this year after nine years onthe Board, four as Deputy Chairman. Inaddition, Denise Fincham retired after8 years service on the Board. I know allthe Board would join me in thanking themfor their valuable contributions.It was with great sadness and regret thatwe farewelled former <strong>TIO</strong> Board DeputyChairman David Farquhar who passedaway after a long illness. David wasa champion of <strong>TIO</strong> values and culture,and worked tirelessly to ensure that <strong>TIO</strong>evolved with “heart and soul”.To honour David’s contribution to <strong>TIO</strong> as aBoard member and trusted legal advisor,as well as his efforts on Motor AccidentCompensation reform, <strong>TIO</strong> has developeda law scholarship to be offered annually atCharles Darwin University.This year we welcomed Julia Davison,Julie-Anne Schafer, George Venardos,Peter Caldwell and Paul Tyrrell to the <strong>TIO</strong>Board. Collectively they bring a wealth ofexperience from various business sectorsto the Board.Looking forward, <strong>TIO</strong> has been through aperiod of significant renewal and changeover the past few years, and this journeywill continue. Our business is morefocused and relevant to Territorians, witha strong outlook and sustainable position.I would like to thank my fellow Boardmembers for their support, as well as theefforts of our management team and allemployees who have demonstrated theircommitment to the company.John Flynn retired in April <strong>2011</strong> afterleading the Board for almost nine years.John always showed a strong interest inour people and achievements. It was thisBruce CarterChair
The Territory way. <strong>TIO</strong> <strong>Annual</strong> <strong>Report</strong> 2010/<strong>2011</strong>6Chief Executive’s OverviewSince joining <strong>TIO</strong> three years ago we havebeen on a journey to become a strongerand more sustainable business, here tobuild confidence and resilience amongTerritorians. This year we have seennumerous demonstrations that we arewell down the path to achieve this.Net profit after tax has grown 47 percent, mostly driven by improvements inoperational performance. Our people aredelivering more and are more engaged.With that comes a reduced reliance onexternally-driven investment income anda better overall result. All three businesseshave contributed to the profit result, againa pleasing trend.<strong>TIO</strong> has cemented its place as a companythat supports Territorians in buildingconfidence and resilience.Our commitment to road safety, buildingresilience to extreme weather events andsupporting home ownership have shownTerritorians that <strong>TIO</strong> is much more than aninsurance and banking business.Nowhere was this displayed moretangibly than our response to CycloneCarlos and associated heavy rainfall in theTop End in February this year. During theaftermath of the event, our Call Centreand Claims Centre staff handled 1,781claims totaling $9.57 million and reassuredcountless other Territorians about theirinsurance cover.I would like to thank our staff whoworked to support our customers duringthis very trying and busy time. Providingunderstanding and reassurance to ourcustomers is as much a part of our roleand value proposition as is handling claimsand issuing insurance policies.Overall PerformanceIt is pleasing to report a net profit after tax across all parts of the business this year, withgroup profit up from $35 million to $52 million after tax.Group Operating ResultsOperating Results08/09$m09/10$m10/11$mUnderlying operating performance 12 34 50Difference between actual investment returnsand expected returns (66) 23 13Change in inflation assumptions and discount rates (3) (17) (8)Restructure and one-off costs (2) (3) -Net profit before tax (59) 37 55Tax (6) 2 3Net profit after tax (53) 35 52
The Territory way. <strong>TIO</strong> <strong>Annual</strong> <strong>Report</strong> 2010/<strong>2011</strong>Home OwnershipThe great Australian dream of owning your own home seems to be harder to achieve thanever before. Uncertain financial times have seen a flattening of the real estate market withdemand being dampened by both higher interest rates and economic uncertainty.Banking Financial PerformanceAn overall flattening of the home loanmarket across Australia and generalmoderation of real estate values werereflected in reduced home loan demandthis year and lower than expected lending.<strong>TIO</strong>’s response has been to continue tofocus on close management of interestmargins and costs. With both lendingand deposits down on last year, Bankingfinancial performance was maintainedthrough operational efficiency gains. Wealso maintained our responsible lendingpractices, with bad debts well belowindustry standards.Surplus and Loss Summary2009$m2010$m<strong>2011</strong>$m18Interest Income 47.1 41.7 44.1Interest Expense 37.9 29.8 32.6Net Interest Income 9.2 11.9 11.5Profit/(Loss) Before Tax (0.2) 3.8 3.7Profit/(Loss) from normal operations before tax 2.7 3.8 3.5Deposits and Loans2009$m2010$m<strong>2011</strong>$mDeposits 448.4 531.3 497.7Loans 544.2 564.1 525.9Balance Summary2009$m2010$m<strong>2011</strong>$mTotal Assets 618.3 655.9 605.6Total Liabilities 592.2 626.8 573.9Total Equity 26.1 29.1 31.7The HOMESTART NT initiative allows eligible Territoriansearning low-to-middle incomes to buy their own homeusing up to 30 per cent of their income.
23<strong>TIO</strong> interacts with customers and the communitythrough a wide variety of channels, includingthe Darwin Home Show.
Financial Statements2010/<strong>2011</strong>
Territory Insurance OfficeBoard Members’ <strong>Report</strong>Chief Executive Officerand Board Members' StatementThe Chief Executive Officer and members of the Board are of the opinion that to the best oftheir belief:The Statement of Comprehensive Income, the Statement of Financial Position, theStatement of Changes in Equity, the Statement of Cash Flows and Notes to theFinancial Statements of the Territory Insurance Office are drawn up so as to presentfairly <strong>TIO</strong> and the MAC Fund’s financial position as at 30 June <strong>2011</strong> and theirperformance for the year ended on that date.The financial statements are drawn up in accordance with Australian Accounting Standardsand Interpretations, International Financial <strong>Report</strong>ing Standards, other mandatoryprofessional reporting requirements, and the Territory Insurance Office Act, as amended.R M HardingChief Executive OfficerB J CarterChairman of the BoardJ F HandDeputy Chairman of the Board16 September <strong>2011</strong><strong>TIO</strong> <strong>Annual</strong> <strong>Report</strong> 2010/<strong>2011</strong> 31
Board Members' <strong>Report</strong>Territory Insurance OfficeBoard Members’ <strong>Report</strong>The Board Members present their report on the financial statements for the year ended 30June <strong>2011</strong> in accordance with a resolution of the Board members and the auditor’s reportthereon.Board membersThe Board Members of the Territory Insurance Office at any time during or since the end ofthe financial year and up to the date of this report are:B J Carter appointed Chairperson 1 st April <strong>2011</strong>P J Caldwell retired 31 st January <strong>2011</strong>, reappointed 1 st May <strong>2011</strong>R A Davis unchangedJ H Davison appointed 1 st October 2010D L Fincham retired 31 st July 2010J G Flynn AM retired 31 st March <strong>2011</strong>J F Hand appointed Deputy Chairperson 1 st April <strong>2011</strong>J I Messenger retired 31 st January <strong>2011</strong>J Schafer appointed 1 st October 2010P C W Tyrrell AO appointed 1 st May <strong>2011</strong>G Venardos appointed 1 st October 2010Details of Board Members, their directorships/experience and any special responsibilities areset out in the board members section of the annual report.Corporate structureThe Territory Insurance Office is a statutory body established under Section 4 of theTerritory Insurance Office Act, and is domiciled in Australia. <strong>TIO</strong> employed 237 employeesas at 30 June <strong>2011</strong> (2010: 231 employees).Principal activitiesThe principal continuing activities during the year of <strong>TIO</strong> are the provision of directinsurance business and related investment activities, and the administration of the MotorAccidents Compensation Scheme on behalf of the Northern Territory Government. <strong>TIO</strong> alsooperates a Banking business, which accepts deposits, makes loans and administers theHomestart loan scheme.There was no significant change in the nature of these activities during the year.ResultsNet profit after tax / (loss) forthe year<strong>TIO</strong><strong>2011</strong> 2010<strong>TIO</strong>Insurance& BankingMACFund<strong>TIO</strong><strong>TIO</strong>Insurance& BankingMACFund$’000 $’000 $’000 $’000 $’000 $’00051,987 7,720 44,267 35,456 3,290 32,166DividendsThe Board has not provided for a dividend in respect of the 2010/<strong>2011</strong> financial year.<strong>TIO</strong> <strong>Annual</strong> <strong>Report</strong> 2010/<strong>2011</strong> 32
Territory Insurance OfficeBoard Members’ <strong>Report</strong>Review of operationsInsurance and Banking performance has resulted in an after tax profit for the year of $7.7mcompared to an after tax profit of $3.3m for the year ended 30 June 2010. The MotorAccidents Compensation Fund [MAC Fund], managed by <strong>TIO</strong>, reported a surplus of $44.3mcompared to a surplus of $32.2m for the year ended 30 June 2010.A full report on the operations of <strong>TIO</strong> is provided within the <strong>Annual</strong> <strong>Report</strong> section.Impact of legislation and other external requirementsThe Board does not believe that there have been any significant impacts of legislation orother external requirements imposed on <strong>TIO</strong> during the year that are not otherwisedisclosed in this report.Significant changes in the state of affairsIn the opinion of the Board Members there have been no significant changes in the state ofaffairs of <strong>TIO</strong> that occurred during the year under review not otherwise disclosed in thisreport.Matters subsequent to the end of the financial yearIn the interval between the end of the financial year and the date of this report, there havebeen no matters or circumstances that have arisen, which have significantly affected or maysignificantly affect:(a)(b)(c)<strong>TIO</strong>’s operations;the results of those operations; or<strong>TIO</strong>’s state of affairs.Likely developments and expected results of operationsThe Board does not believe that it would be in the best interests of <strong>TIO</strong> to discloseinformation other than that disclosed elsewhere in this report.Indemnification and insurance of officersDuring the financial year ended 30 June <strong>2011</strong>, <strong>TIO</strong> paid an insurance premium in respect ofa contract insuring the Board Members and officers of <strong>TIO</strong> against certain liabilities that maybe incurred in discharging their duties and responsibilities as a Board Member or officer of<strong>TIO</strong>. The insurance contract prohibits the disclosure of the nature of the liabilities insuredagainst and the premium paid in respect of that insurance.<strong>TIO</strong> <strong>Annual</strong> <strong>Report</strong> 2010/<strong>2011</strong> 33
Territory Insurance OfficeBoard Members’ <strong>Report</strong>Meetings of board membersThe number of meetings of the <strong>TIO</strong> Board and of each Board committee held during the yearended 30 June <strong>2011</strong>, and the numbers of meetings attended by each Board Member were:Meetings ofBoardMembersMeetings ofAudit & RiskCommitteeMeetings ofInvestmentCommitteeMeetings ofReinsuranceCommitteeMeetings ofPeople,RemunerationNomination &SuccessionCommitteeMeetings ofMAC AppealsCommittee *A B A B A B A B A B A BB J Carter 8 7 7 7 x x 3 2 3 3 x xP J Caldwell 6 5 x x x x x x x x x xR A Davis 8 7 x x 5 5 x x 2 2 x xJ H Davison 5 4 2 2 x x x x 2 2 x xD L Fincham 1 1 1 1 1 1 x x 0 0 1 1J G Flynn AM 7 6 x x 4 4 x x 2 2 3 3J F Hand 8 8 7 7 5 5 3 3 x x 3 3J I Messenger 6 5 5 4 x x 3 3 1 0 x xJ Schafer 5 4 x x 2 2 x x 2 2 x xP C W Tyrrell AO 1 0 x x x x x x x x x xG Venardos 5 4 2 2 2 2 x x x x x xNote: Peter Caldwell attended the strategy session in March as the shareholderrepresentative.A = Number of meetings held during the time the board member held office or was amember of the committee during the year.B = Number of meetings attendedx = Not a member of the relevant committee* = The MAC Appeals Committee had limited tenure of 24 months from 29 April 2009<strong>TIO</strong> <strong>Annual</strong> <strong>Report</strong> 2010/<strong>2011</strong> 34
Territory Insurance OfficeBoard Members’ <strong>Report</strong>Board members’ benefitsNo Board Member of <strong>TIO</strong> has received, or has become entitled to receive, a benefit (otherthan a remuneration benefit included in the financial statements) because of a contractthat:(a) the Board Member; orwith:(b)(c)(i)(ii)a firm of which the Board Member is a member; oran entity in which the Board Member has a substantial financial interest;has made (during the year ended 30 June <strong>2011</strong> or at any time)<strong>TIO</strong>; oran entity that <strong>TIO</strong> controlled, or a body corporate that was related to <strong>TIO</strong>,when the contract was made or when the Board Member received, or becameentitled to receive, the benefit (if any).B J CarterChairman of the BoardJ F HandDeputy Chairman of the Board16 September <strong>2011</strong><strong>TIO</strong> <strong>Annual</strong> <strong>Report</strong> 2010/<strong>2011</strong> 35
Statement of Comprehensive Incomefor the year ended 30 June <strong>2011</strong>Territory Insurance OfficeFinancial StatementsProfit and lossNotes <strong>2011</strong> 2010<strong>TIO</strong><strong>TIO</strong>Insurance& BankingMAC Fund<strong>TIO</strong><strong>TIO</strong>Insurance& BankingMAC Fund$’000 $’000 $’000 $’000 $’000 $’000Revenue 5 295,167 198,798 105,612 280,411 182,797 106,673Outwards reinsurancepremium expense(46,012) (39,544) (6,468) (45,050) (37,421) (7,629)Claims expense 21 (122,231) (78,191) (44,040) (130,985) (76,088) (54,897)Acquisition costs (6,305) (5,933) (372) (5,143) (4,461) (682)Grants provided to fund roadsafety programs(2,843) - (2,843) (2,273) - (2,273)Finance costs (32,491) (32,491) - (29,779) (29,779) -Depreciation and amortisationexpense(2,007) (1,395) (612) (3,304) (1,224) (2,080)Salaries and employeebenefits expense(21,670) (21,670) - (21,088) (21,088) -Other expenses (6,508) (8,741) (7,010) (6,116) (8,229) (6,946)Profit/(Loss) beforeincome tax55,100 10,833 44,267 36,673 4,507 32,166Income tax benefit/(expense) 10 (3,113) (3,113) - (1,217) (1,217) -Net profit/(loss) for theperiod51,987 7,720 44,267 35,456 3,290 32,166Other comprehensiveincomeRevaluation of property, plantand equipment1,389 347 1,042 1,395 349 1,046Cash Flow Hedges:Gain/(Loss) taken on Equity (166) (166) - 892 892 -Transferred to Statement ofFinancial Position197 197 - (470) (470) -Income tax on items of othercomprehensive income(113) (113) - (231) (231) -Other comprehensiveincome for the period, net1,307 265 1,042 1,586 540 1,046of taxTotal comprehensiveincome for the period53,294 7,985 45,309 37,042 3,830 33,212Profit and total comprehensive income for the period are attributable to the owner.The above Statement of Comprehensive Income should be read in conjunction with the accompanying notes.<strong>TIO</strong> <strong>Annual</strong> <strong>Report</strong> 2010/<strong>2011</strong> 36
Statement of Financial Positionas at 30 June <strong>2011</strong>Territory Insurance OfficeFinancial StatementsNotes <strong>2011</strong> 2010<strong>TIO</strong><strong>TIO</strong>Insurance &BankingMACFund<strong>TIO</strong><strong>TIO</strong>Insurance& BankingMAC Fund$’000 $’000 $’000 $’000 $’000 $’000CURRENT ASSETSCash and cash equivalents 11 26,543 20,951 5,592 30,215 27,855 2,360Trade and other receivables 12 53,563 51,043 3,820 52,418 50,486 2,959Other financial assets 13 617,366 226,182 391,184 567,016 224,803 342,213Loans 14 11,973 11,973 - 14,333 14,333 -Reinsurance and otherrecoveries receivable17 23,138 21,686 1,452 17,439 13,719 3,720Deferred reinsurance expense 18 19,704 19,704 - 27,344 27,344 -Deferred acquisition costs 18 4,289 4,119 170 4,804 4,559 245Current tax assets 10 - - - 1,364 1,364 -Total Current Assets 756,576 355,658 402,218 714,933 364,463 351,497NON-CURRENT ASSETSIntangible assets 15 1,251 1,116 135 1,784 1,390 394Loans 14 513,923 513,923 - 549,742 549,742 -Property, plant and equipment 16 47,324 14,895 32,429 46,282 14,299 31,983Reinsurance and otherrecoveries receivable17 47,711 17,914 29,797 45,043 16,072 28,971Deferred tax assets 10 4,082 4,082 - 5,965 5,965 -Total Non-Current Assets 614,291 551,930 62,361 648,816 587,468 61,348Total Assets 1,370,867 907,588 464,579 1,363,749 951,931 412,845CURRENT LIABILITIESOutstanding claims liability 19 81,700 47,904 33,796 71,628 40,106 31,522Trade and other payables 22 29,085 27,763 2,622 39,054 37,569 2,512Deposits 23 497,688 497,688 - 531,309 531,309 -Other financial liabilities 13 - - - 102 102 -Current tax liabilities 10 221 221 - - - -Provisions 24 4,092 4,092 - 4,742 4,742 -Unearned premium liability 20 88,212 62,023 26,189 82,921 58,472 24,449Securitisation liabilities 25 1,333 1,333 - 1,562 1,562 -Total Current Liabilities 702,331 641,024 62,607 731,318 673,862 58,483NON-CURRENT LIABILITIESOutstanding claims liability 19 329,457 90,563 238,894 327,240 90,647 236,593Deferred tax liabilities 10 2,103 2,103 - 2,345 2,345 -Provisions 24 792 792 - 649 649 -Securitisation liabilities 25 64,640 64,640 - 83,948 83,948 -Total Non-Current Liabilities 396,992 158,098 238,894 414,182 177,589 236,593Total Liabilities 1,099,323 799,122 301,501 1,145,500 851,451 295,076Net Assets 271,544 108,466 163,078 218,249 100,480 117,769EQUITYRetained earnings 27 215,868 65,197 160,990 163,881 57,477 116,723Asset revaluation reserve 27 16,336 3,929 2,088 15,049 3,684 1,046Contributed equity 27 39,340 39,340 - 39,340 39,340 -Hedging Reserve 27 - - - (21) (21) -Total Equity 271,544 108,466 163,078 218,249 100,480 117,769The above statement of financial position should be read in conjunction with the accompanying notes.<strong>TIO</strong> <strong>Annual</strong> <strong>Report</strong> 2010/<strong>2011</strong> 37
Statement of Changes in Equityfor the year ended 30 June <strong>2011</strong>Territory Insurance OfficeFinancial Statements<strong>TIO</strong>NotesRetainedEarningsAssetRevaluationReserveContributedEquityHedgingReserveTotal$’000 $’000 $’000 $’000 $’000Balance as at 1 July 2009 128,425 13,759 39,340 (317) 181,207Profit for the period 35,456 - - - 35,456Other comprehensive incomeRevaluation of property, Plant andequipment- 1,395 - - 1,395Cash flow HedgesGain/(Loss) taken on Equity - - - 892 892Transferred to Statement ofFinancial Position- - - (470) (470)Income tax on items of othercomprehensive income- (105) - (126) (231)Total comprehensive income for theperiod attributable to the owner35,456 1,290 - 296 37,042Balance as at 30 June 2010 163,881 15,049 39,340 (21) 218,249Profit for the period 51,987 - - - 51,987Other comprehensive incomeRevaluation of property, Plant andequipment- 1,391 - - 1,391Cash flow HedgesGain/(Loss) taken on Equity - - - (166) (166)Transferred to Statement ofFinancial Position- - - 196 196Income tax on items of othercomprehensive income- (104) - (9) (113)Total comprehensive income for theperiod attributable to the owner51,987 1,287 - 21 53,295Balance as at 30 June <strong>2011</strong> 215,868 16,336 39,340 - 271,544The above Statement of Changes in Equity should be read in conjunction with the accompanying notes.<strong>TIO</strong> <strong>Annual</strong> <strong>Report</strong> 2010/<strong>2011</strong> 38
Statement of Changes in Equityfor the year ended 30 June <strong>2011</strong> continued…Territory Insurance OfficeFinancial Statements<strong>TIO</strong> Insurance & BankingNotesRetainedEarningsAssetRevaluationReserveContributedEquityHedgingReserveTotal$’000 $’000 $’000 $’000 $’000Balance as at 1 July 2009 54,187 3,440 39,340 (317) 96,650Profit for the period 3,290 - - - 3,290Other comprehensive incomeRevaluation of property, Plant andequipment- 349 - - 349Cash flow HedgesGain/(Loss) taken on Equity - - - 892 892Transferred to Statement ofFinancial Position- - - (470) (470)Income tax on items of othercomprehensive income- (105) - (126) (231)Total comprehensive income for theperiod attributable to the owner3,290 244 - 296 3,830Balance as at 30 June 2010 57,477 3,684 39,340 (21) 100,480Profit for the period 7,720 - - - 7,720Other comprehensive incomeRevaluation of property, Plant andequipment- 349 - - 349Cash flow HedgesGain/(Loss) taken on Equity - - - (166) (166)Transferred to Statement ofFinancial Position- - - 196 196Income tax on items of othercomprehensive income- (104) - (9) (113)Total comprehensive income for theperiod attributable to the owner7,720 245 - 21 7,986Balance as at 30 June <strong>2011</strong> 65,197 3,929 39,340 - 108,466The above Statement of Changes in Equity should be read in conjunction with the accompanying notes.<strong>TIO</strong> <strong>Annual</strong> <strong>Report</strong> 2010/<strong>2011</strong> 39
Statement of Changes in Equityfor the year ended 30 June <strong>2011</strong> continued…MAC FundNotesRetainedEarningsAssetRevaluationReserveTerritory Insurance OfficeFinancial StatementsContributedEquityHedgingReserveTotal$’000 $’000 $’000 $’000 $’000Balance as at 30 June 2009 84,557 - - - 84,557Profit for the period 32,166 - - - 32,166Other comprehensive incomeRevaluation of property, Plant andequipment- 1,046 - - 1,046Total comprehensive income for theperiod attributable to the owner32,166 1,046 - - 33,212Balance as at 30 June 2010 116,723 1,046 - - 117,769Profit for the period 44,267 - - - 44,267Other comprehensive incomeRevaluation of property, Plant andequipment- 1,042 - - 1,042Total comprehensive income for theperiod attributable to the owner44,267 1,042 - - 45,309Balance as at 30 June <strong>2011</strong> 160,990 2,088 - - 163,078The above Statement of Changes in Equity should be read in conjunction with the accompanying notes.<strong>TIO</strong> <strong>Annual</strong> <strong>Report</strong> 2010/<strong>2011</strong> 40
Statement of Cash Flows for the year ended30 June <strong>2011</strong>Territory Insurance OfficeFinancial StatementsCash flows from operating activitiesNotes <strong>2011</strong> 2010<strong>TIO</strong><strong>TIO</strong>Insurance &BankingMAC Fund<strong>TIO</strong><strong>TIO</strong>Insurance& BankingMAC Fund$’000 $’000 $’000 $’000 $’000 $’000Premiums received 184,429 114,488 69,941 172,829 107,129 65,700Outwards reinsurance premiums paid (51,299) (44,012) (7,287) (44,428) (36,945) (7,483)Claims paid (109,401) (69,005) (40,396) (104,974) (63,620) (41,354)Reinsurance recoveries received 13,827 10,538 3,289 15,378 11,282 4,096Trust distributions received 25,673 5,577 20,096 17,665 3,934 13,731Interest received 16,849 9,474 7,375 14,227 8,621 5,606Operating lease income received 3,344 1,299 2,045 2,571 888 1,683Other income received 6,463 5,297 1,166 8,384 7,813 571Acquisition costs paid (6,523) (6,173) (350) (8,325) (7,575) (750)General and administration expensespaid(29,593) (23,661) (5,932) (25,327) (18,918) (6,409)Funding for road safety programs paid (2,669) - (2,669) (3,261) - (3,261)Goods and services tax paid (8,058) (4,267) (3,791) (8,502) (5,103) (3,399)Monies held on trust received / (paid) (46) (46) - (3,891) (3,891) -Interest expense paid on deposits (32,905) (32,905) - (30,018) (30,018) -Unrealised Investment Income - - - - - -Interest income received from loans 38,860 38,860 - 36,554 36,554 -Income Tax paid - - - 1,415 1,415 -Net cash inflow from/(used in)operating activities 3148,951 5,464 43,487 40,297 11,566 28,731Cash flows from investing activitiesNet loans extended to customers 38,600 38,600 - (19,680) (19,680) -Net (payments) / receipts forinvestments(37,239) 3,010 (40,249) (59,081) (24,015) (35,066)Payments for property, plant andequipment(1,646) (1,640) (6) (2,654) (2,615) (39)Proceeds from sale of embeddedderivative- - - 1,320 1,320 -Proceeds from property, plant andequipment101 101 - - - -Net cash flow from/(used in)investing activities(184) 40,071 (40,255) (80,095) (44,990) (35,105)Cash flows from financing activitiesNet increase/(decrease) in savings andother deposit accounts(32,855) (32,855) - 86,021 86,021 -Repayments of securitisation funding (19,584) (19,584) - (48,786) (48,786) -Net cash flow from/(used in)financing activities(52,439) (52,439) - 37,235 37,235 -Net increase/(decrease) in cashheld(3,672) (6,904) 3,232 (2,565) 3,810 (6,375)Cash at the beginning of the period 30,215 27,855 2,360 32,780 24,045 8,735Cash at the end of the period 11 26,543 20,951 5,592 30,215 27,855 2,360The above Statement of cash flows should be read in conjunction with the accompanying notes.<strong>TIO</strong> <strong>Annual</strong> <strong>Report</strong> 2010/<strong>2011</strong> 41
Territory Insurance OfficeNotes to the Financial Statements30 June <strong>2011</strong>1. Corporate InformationThe Territory Insurance Office [<strong>TIO</strong>] was established in 1979 by virtue of section 4 of theTerritory Insurance Office Act [<strong>TIO</strong> Act]. <strong>TIO</strong> is domiciled in the Northern Territory. Theprincipal activities of the office are the operation of the following businesses; Insurance,Banking and administration of the MAC Scheme.<strong>TIO</strong> is only authorised to transact business and carry out functions as provided in the<strong>TIO</strong> Act or as approved or directed by the Minister. Its policies and contracts of insuranceor indemnity and deposits placed with it are fully guaranteed by the Northern TerritoryGovernment under section 30 of the <strong>TIO</strong> Act.<strong>TIO</strong> Head Office & Principal Place of Business24 Mitchell StreetDARWIN2. Summary of significant accounting policies2.1 Basis of PreparationThe financial statements are general purpose financial statements which have beenprepared in accordance with the requirements of <strong>TIO</strong> Act, Australian AccountingStandards and other authoritative pronouncements of the Australian AccountingStandards Board (AASB). The principal accounting policies adopted are consistent withthose of the previous year, except where otherwise stated. The financial statementscomply with Australian Accounting Standards and International Financial <strong>Report</strong>ingStandards (IFRS) as issued by the International Accounting Standards Board.These general purpose financial statements were authorised by the Board for issue on 16September <strong>2011</strong>.The financial statements have been prepared in accordance with the fair value basis ofaccounting with certain exceptions as described in the accounting policies set below atNote 2.3. Balances among <strong>TIO</strong> Insurance & Banking and the MAC Fund are gross ofinter-business transactions and in the <strong>TIO</strong> balance (which is the combined total of <strong>TIO</strong>Insurance & Banking and the MAC Fund as a whole) the inter-business transactions areeliminated.Fiduciary Responsibilities in respect of the Motor AccidentsCompensation Fund<strong>TIO</strong> administers the MAC Scheme pursuant to section 5(c) of the <strong>TIO</strong> Act. The MACscheme is created by the Motor Accidents (Compensation) Act. <strong>TIO</strong> Act has establishedthe Motor Accidents Compensation Fund [MAC Fund] and other requirements around theoperation of the fund. The establishment of the MAC Fund on 1 July 2006 did not createa trust and <strong>TIO</strong>, and the Board members are not trustees in relation of the MAC Fund.<strong>TIO</strong> <strong>Annual</strong> <strong>Report</strong> 2010/<strong>2011</strong> 42
Territory Insurance OfficeNotes to the Financial Statements30 June <strong>2011</strong>Pursuant to Section 22C of the <strong>TIO</strong> Act, the assets of the fund must be solely applied forthe following purposes• Operating the MAC scheme;• The promotion of road safety;• The acquisition of assets for the MAC Fund;• The discharge of liabilities in relation to the MAC businessUnder the <strong>TIO</strong> Act, the <strong>Annual</strong> report of <strong>TIO</strong> must consist of:a) a report for the Territory Insurance Office as a whole; andb) a separate report for the commercial business andc) a separate report for the MAC business.<strong>TIO</strong> has addressed its obligations under the <strong>TIO</strong> Act by segregating the assets andliabilities of the MAC Fund and presenting in the financial statements the aboveinformation requirements using a 6 column approach.The disclosures for both <strong>TIO</strong> [Insurance and Banking] and the MAC Fund are their standalone results and balances and necessarily disclose all transactions that occur betweenthe two business activities.Accounting policies applicable to both <strong>TIO</strong> and the MAC Fund are outlined throughoutNote 2.3.2.2 New and Revised Accounting StandardsThe following new and revised Standards and Interpretations have not resulted insignificant changes to the financial statements.AmendmentsAASB 2009-5AASB 2009-8AASB 2009-9AASB 2009-10Interpretation 19AASB 2009-13AASB 2010-1AASB 2010-3TitleAmendments to Australian Accounting Standards - <strong>Annual</strong>Improvements ProcessAmendments to Australian Accounting Standards - Group Cash-Settled Share-based Payment TransactionsAmendments to Australian Accounting Standards – AdditionalExemptions for First-time AdoptersAmendments to Australian Accounting Standards - Classificationof Rights IssuesAmendment to Australian Accounting Standards - ExtinguishingFinancial Liabilities with Equity InstrumentsLimited Exemption from Comparative AASB 7 Disclosures forFirst-time Adopters - Amendment to AASB 1Amendments to Australian Accounting Standards arising fromthe <strong>Annual</strong> Improvements Project<strong>TIO</strong> <strong>Annual</strong> <strong>Report</strong> 2010/<strong>2011</strong> 43
Territory Insurance OfficeNotes to the Financial Statements30 June <strong>2011</strong>The following new and revised Standards and Interpretations have recently been issuedor amended but are not yet effective; however, are available for early adoption. <strong>TIO</strong> haselected early adoption for the reporting period ended 30 June <strong>2011</strong>. There is no financialimpact from the early adoption as the standard relates purely to disclosure.AmendmentsAASB 124 (revised)AASB 2009-12AASB 8 (asamended) andAASB 2009-12TitleAmendments to Australian AccountingStandards - Related Party DisclosuresOperating Segments as amended and theconsequential amendments to otherstandards resulting from its issue.Effective on orafter1 January <strong>2011</strong>1 January <strong>2011</strong>Other new and revised Standards and Interpretations that have been issued or amendedbut are not yet effective, have not been adopted for the reporting period ended 30 June<strong>2011</strong>. <strong>TIO</strong> will apply these standards for the annual reporting periods beginning on orafter the effective dates. It is expected that there will be no material financial impactfrom the application of these standards as they are primarily disclosure related.2.3 Significant Accounting PoliciesIn addition to <strong>TIO</strong>’s primary operations of providing Insurance and Banking services tothe Northern Territory, <strong>TIO</strong> administers the MAC Fund pursuant to the <strong>TIO</strong> Act. Theresults and balances are disclosed separately to fulfil the reporting obligations set out bythe Act.All accounting policies are consistent between <strong>TIO</strong> [Insurance and Banking] and the MACFund unless otherwise stated below. Accounting policies relating to Banking activities donot apply to the MAC Fund.a) Revenue recognitionRevenue is recognised to the extent that it is probable that the economic benefitswill flow to the entity and the revenue can be reliably measured. The followingspecific recognition criteria are also used before revenue is recognised:Premium revenuePremium is comprised of amounts charged to policyholders or other insurers, butexcludes stamp duties, GST and other amounts collected on behalf of third parties.The earned portion of premiums received and receivable, including unclosedbusiness, is recognised as revenue. Premium is treated as earned from the date ofattachment of risk. Premiums on unclosed business are estimated with reference tothe previous year's premium processing delays and the impact of recent trends andevents on the pattern of new business and renewals.<strong>TIO</strong> <strong>Annual</strong> <strong>Report</strong> 2010/<strong>2011</strong> 44
Territory Insurance OfficeNotes to the Financial Statements30 June <strong>2011</strong>The pattern of recognition of income over the policy or indemnity periods is inaccordance with the pattern of the incidence of risk expected under the insurancecontracts. In most cases, time approximates the pattern of risks underwritten.Unearned premium liability, which is the proportion of premium received orreceivable not earned in the statement of comprehensive income, is determined byapportioning the premiums written in the year over the periods of indemnity fromthe attachment of risk, and is treated as a liability on the statement of financialposition at the reporting date.Reinsurance and other recoveries receivableReinsurance and other recoveries receivable on paid claims, reported claims not yetpaid, claims incurred but not reported and unexpired risk liabilities are recognisedas revenue.Recoveries receivable are assessed in a manner similar to the assessment ofoutstanding claims. Recoveries receivable in relation to "long-tail" classes aremeasured as the present value of the expected future receipts, calculated on thesame basis as the provision for outstanding claims. The details of discount andinflation rates applied are included in note 3.Interest, fees and commissionInterest income is recognised on an accrual basis. Banking related fees andcommissions are brought to account on an accrual basis whilst loan establishmentfees are brought to account over the estimated average life of the loan on aneffective interest rate basis.Rental revenueRental revenue is recognised as income on a straight line basis over the term of thelease. Lease incentives granted are recognised as an integral part of the total rentalincome.b) Unexpired risk liabilityThe adequacy of the unearned premium liability is assessed by considering currentestimates of all expected future cash flows relating to future claims covered bycurrent insurance contracts. This assessment is referred to as the liability adequacytest and is performed separately for each group of the contracts subject to broadlysimilar risks and managed together in a single portfolio.If the unearned premium liability less related intangible assets and related deferredacquisition costs is exceeded by the present value of the expected future cash flowsrelating to future claims plus the additional risk margin to reflect the inherentuncertainty in the central estimate, then the unearned premium liability is deemedto be deficient. <strong>TIO</strong> applies a risk margin to achieve the same probability ofsufficiency for future claims as is achieved on the outstanding claims liability.The entire deficiency, gross and net of reinsurance is recognised immediately in thestatement of comprehensive income. The deficiency is recognised first by writingdown any related intangible assets and then related deferred acquisition costs, withany excess being recorded in the statement of financial position as an unexpiredrisk liability.<strong>TIO</strong> <strong>Annual</strong> <strong>Report</strong> 2010/<strong>2011</strong> 45
Territory Insurance OfficeNotes to the Financial Statements30 June <strong>2011</strong>c) Outwards reinsurancePremium ceded to reinsurers is recognised as an expense in the statement ofcomprehensive income from the attachment date over the period of indemnity ofthe insurance contract in accordance with the pattern of reinsurance protectionreceived. Where appropriate, an unearned portion of outwards reinsurance istreated at the reporting date as an asset.d) Outstanding claims liabilityThe liability for outstanding claims is measured as the central estimate of thepresent value of expected future payments against claims incurred at the reportingdate under insurance contracts issued by <strong>TIO</strong>, with an additional risk margin toallow for the inherent uncertainty in the central estimate.Claims expense and a provision for outstanding claims are recognised in respect ofdirect insurance and inwards reinsurance business and the Motor AccidentsCompensation Scheme. The provision covers claims reported but not yet paid,incurred but not reported claims ("IBNR") and the anticipated direct and indirectcosts of settling those claims. Claims outstanding are assessed by review ofindividual claim files and estimating changes in the ultimate cost of settling claims,IBNRs and settlement costs using statistics based on past experience and trends.Outstanding claims are subject to independent actuarial assessment.The provision for outstanding claims is measured as the present value of expectedfuture payments. These payments are estimated on the basis of the ultimate cost ofsettling claims, which is affected by factors arising during the period to settlementsuch as normal and "superimposed" inflation. The expected future payments arediscounted to present value at the statement of financial position date using a riskfree rate. The details of rates applied are included in note 3.e) ReceivablesReceivables comprise premium receivables, interest receivables, other debtors andreinsurance and other recoveries. These amounts are initially recognised at fairvalue.Premium receivables and reinsurance and other recoveries, which include amountsdue from policy holders, reinsurers and intermediaries, are subsequently measuredat fair value through the profit and loss section of the Statement of ComprehensiveIncome. Interest receivables and other debtors are subsequently measured atamortised cost using the effective interest rate method.An allowance for impairment of receivables is established when there is objectiveevidence that <strong>TIO</strong> will not be able to collect all moneys due. The amount of theallowance is equal to the difference between the carrying amount and the presentvalue of estimated future cash flows, discounted at the original effective interestrate. The impairment charge is recognised in the statement of comprehensiveincome.<strong>TIO</strong> <strong>Annual</strong> <strong>Report</strong> 2010/<strong>2011</strong> 46
Territory Insurance OfficeNotes to the Financial Statements30 June <strong>2011</strong>f) Deferred acquisition costsAcquisition costs are costs associated with obtaining and recording generalinsurance contracts. These costs include commissions and brokerage paid,advertising, underwriting and other selling costs, premium collection costs andother administrative costs. Acquisition costs incurred in obtaining general insurancecontracts are deferred and recognised as assets where they can be reliablymeasured and where it is probable that they will give rise to premium revenue thatwill be recognised in the statement of comprehensive income in subsequentreporting periods.Deferred acquisition costs are amortised in accordance with the expected pattern ofthe incidence of risk under the general insurance contracts to which they relate.This pattern of amortisation corresponds to the earning pattern of thecorresponding premium revenue.Liability Adequacy TestThe liability adequacy test is an assessment of the carrying amount of the unearnedpremium liability and is conducted at each reporting date. If current estimates ofthe present value of the expected future cash flows relating to future claims arisingfrom the rights and obligations under current insurance contracts, plus an additionalrisk margin to reflect the inherent uncertainty in the central estimate, exceed theunearned premium liability (net of reinsurance) less related deferred acquisitioncosts, then the unearned premium liability is deemed to be deficient. The test isperformed at the level of a portfolio of contracts that are subject to broadly similarrisks and that are managed together as a single portfolio. Any deficiency arisingfrom the test is recognised in profit or loss with the corresponding impact on thestatement of financial position recognised first through the write down of deferredacquisition costs for the relevant portfolio of contracts, with any remaining balancebeing recognised on the statement of financial position as an unexpired risk liability.g) Assets backing insurance liabilities<strong>TIO</strong> actively manages its investment portfolio to ensure that investments mature inaccordance with the expected pattern of future cash flows arising from insuranceliabilities. <strong>TIO</strong> undertook a process of identifying and matching all assets whicharise from the issuing of insurance contracts. This review determined that thefollowing assets are held to back insurance liabilities. These assets comprise:Receivables: Premium receivables, reinsurance and other recoveries.Financial Assets: Investment assets, cash, cash equivalents and overdrafts.Owner-occupied property.ReceivablesRefer to note 2.3(e).<strong>TIO</strong> <strong>Annual</strong> <strong>Report</strong> 2010/<strong>2011</strong> 47
Territory Insurance OfficeNotes to the Financial Statements30 June <strong>2011</strong>Financial AssetsInvestment assets held to back insurance liabilities, have been categorised as “atfair value through profit and loss”, as they are held for trading. They are part of aportfolio of identified financial instruments that are managed together and for whichthere is evidence of a recent actual pattern of short-term profit-taking.Initial recognition is at fair value in the statement of financial position andsubsequent measurement is at fair value with any resultant gains or lossesrecognised in the statement of comprehensive income.Details of fair value for financial assets are listed below:Financial assetListed fixed interest securities,Units in listed unit trusts,Government securities.Unlisted fixed interest securities.Units in unlisted unit trusts.Cash assets and bank overdrafts.Details of how fair value is determined.Initially recognised at cost and the subsequent fair value is taken asthe quoted bid price of the instrument at the reporting date.Initially recognised at cost and the subsequent fair value ismeasured based on valuations using rates of interest equivalent tothe yields obtainable on comparable investments at the reportingdate.Initially recognised at cost and the subsequent fair value ismeasured at fund manager’s valuation at the reporting date.Initially recognised at cost and the subsequent fair value ismeasured at face value of the amounts deposited or drawn.All purchases and sales of financial assets that require delivery of the asset withinthe time frame established by regulation or market convention (‘regular way’transactions) are recognised on the date of settlement, being the date the asset isdelivered to or by <strong>TIO</strong>.In cases where the period between trade and settlement exceeds this time frame,the transaction is also recognised at settlement date. Financial assets arederecognised when the rights to receive future cash flows from the assets haveexpired, or have been transferred, and <strong>TIO</strong> has transferred substantially all therisks and rewards of ownership or control of the asset.Finance revenue, comprising trust distributions and interest, is brought to accounton an accruals basis. Revenue on investments in unlisted unit trusts is deemed toaccrue on the date the distributions are declared.Owner-occupied property accounted for as Property, Plant and EquipmentThe owner-occupied property is valued using the revaluation model wherebymeasurement subsequent to initial recognition is at fair value at the date of thelatest revaluation less any subsequent accumulated depreciation and accumulatedimpairment losses.A valuation is conducted annually and is based on an external property valuationreport.When a revaluation increases the carrying value of a property, the increase iscredited directly to equity under the heading of asset revaluation reserve.<strong>TIO</strong> <strong>Annual</strong> <strong>Report</strong> 2010/<strong>2011</strong> 48
Territory Insurance OfficeNotes to the Financial Statements30 June <strong>2011</strong>However, any increase is recognised in profit and loss to the extent that it reversesa revaluation decrease of the same asset previously recognised in profit and loss.When an asset’s carrying amount is decreased as a result of a revaluation, thedecrease is recognised in profit and loss. However, any decrease is debited directlyto equity under the heading of asset revaluation reserve to the extent of any creditbalance existing in the asset revaluation reserve in respect of that asset.Any remaining balance on the asset revaluation reserve is credited to retainedearnings when the corresponding property is realised by sale.h) Fire service levy and other charges - <strong>TIO</strong> Insurance & BankingA liability for fire service levy and other charges is recognised on certain businesswritten to the balance date. Levies and charges payable are expensed on the samebasis as the recognition of premium revenue, with the portion relating to unearnedpremium being recorded as an asset.i) TaxesIncome tax<strong>TIO</strong> is assessable for income tax by the Australian Taxation Office under theNational Tax Equivalent Regime (NTER). Under this arrangement, <strong>TIO</strong> is required tobe assessed in accordance with the Income Tax Assessment Act (as amended). <strong>TIO</strong>has elected under S148 (2) of the Income Tax Assessment Act, to have allowed asa deduction reinsurance payments to non-resident reinsurers.<strong>TIO</strong> Insurance & Banking:The income tax expense or revenue for the period is the tax payable on the currentperiod’s taxable income based on the applicable income tax rate adjusted bychanges in deferred tax assets and liabilities attributable to temporary differencesbetween the tax bases of assets and liabilities and their carrying amounts in thefinancial statements, and unused tax losses.Deferred tax assets and liabilities are recognised for temporary differences at thetax rates expected to apply when the assets are recovered or the liabilities aresettled. The tax rate is applied to the cumulative amounts of deductible andassessable temporary differences to measure the deferred tax asset or liability.Deferred tax assets are recognised for deductible temporary differences and unusedtax losses only if it is probable that future taxable amounts will be available toutilise those temporary differences and losses.Current and deferred tax balances attributable to amounts recognised directly inequity are also recognised directly in equity.MAC Fund:The MAC Fund is not subject to the National Tax Equivalents Regime andaccordingly the MAC Fund has no tax related balances or transactions reported.<strong>TIO</strong> <strong>Annual</strong> <strong>Report</strong> 2010/<strong>2011</strong> 49
Territory Insurance OfficeNotes to the Financial Statements30 June <strong>2011</strong>Goods and Services Tax (GST)Revenues, expenses and assets are recognised net of the amount of GST except:• Where the GST incurred on a purchase of goods and services is not recoverablefrom the taxation authority, in which case the GST is recognised as part of thecost of acquisition of the asset or as part of the expense item as applicable; and• Receivables and payables are stated with the amount of GST included.The net amount of GST recoverable or payable to the taxation authority is includedas part of receivables or payables in the statement of financial position. Cash flowsare included in the statement of cash flows on a gross basis.j) Dividend – <strong>TIO</strong> Insurance & BankingPursuant to Section 26 of the Territory Insurance Office Act, the Minister may directthat any amount of funds held by <strong>TIO</strong> which, in his opinion, is in excess of thatrequired as adequate provision for actual and contingent liabilities or for thereasonable operating and other expenses of <strong>TIO</strong> shall be paid by <strong>TIO</strong> to theConsolidated Fund of the Territory.k) Transportation of accident victims – MAC FundPursuant to section 18 of the Motor Accidents (Compensation) Act there is payableto or on behalf of a person entitled to a benefit under this Act all reasonablemedical and rehabilitation expenses incurred in relation to treatment for injuriessustained in a motor vehicle accident. "Treatment" includes inter alia, theconveyance of that person to any place for the purpose of his/her receiving anytreatment or to a hospital. Reimbursements to the Territory during the year tocover intrastate transfer costs have been included in claims expense, along withambulance conveyance charges.l) Hospital bed days payments – MAC FundPayment for the treatment of MAC Fund patients in Northern Territory publichospitals occurs at the time of treatment.m) Property, plant and equipmentThe owner-occupied property located at 24 Mitchell Street is used in the supply ofservices and for administrative purposes and has been held to back insuranceliabilities. It is stated in the statement of financial position at its revalued amount,being the fair value at the date of revaluation, less any subsequent accumulateddepreciation and subsequent accumulated impairment losses. Revaluations areperformed annually at the reporting date. Property, plant and equipment are testedfor impairment whenever events or changes in circumstances indicate that thecarrying amount may not be recoverable.<strong>TIO</strong> <strong>Annual</strong> <strong>Report</strong> 2010/<strong>2011</strong> 50
Territory Insurance OfficeNotes to the Financial Statements30 June <strong>2011</strong>Any revaluation increase arising on the revaluation of such land and buildings iscredited to the asset revaluation reserve, except to the extent that it reverses arevaluation decrease for the same asset previously recognised in profit and loss, inwhich case the increase is credited to profit and loss to the extent of the decreasepreviously charged. A decrease in carrying amount arising on the revaluation ofsuch land and buildings is charged to profit and loss to the extent that it exceedsthe balance, if any, held in the asset revaluation reserve relating to a previousrevaluation of that asset.Depreciation on revalued buildings is charged to the profit and loss. On thesubsequent sale or retirement of a revalued property, the attributable revaluationsurplus remaining in the asset revaluation reserve is transferred directly to retainedearnings. The effective useful life of the owner-occupied property has beenassessed at 50 years (2010: 50 years).Costs associated with the negotiation of operating leases associated with the owneroccupied property are capitalised and amortised over the term of the respectiveleases. These costs include the costs of fit outs and the accrual of rent during rentfree periods of occupation.Plant and equipment are stated at cost less accumulated depreciation and anyaccumulated impairment losses.Depreciation is charged so as to write off the cost or valuation of assets, other thanowner-occupied properties, over their estimated useful lives, using the straight-linemethod.Leasehold assets are depreciated over the life of the assets or term of the lease,whichever is shorter.The gain or loss arising on the disposal or retirement of an item of property, plantand equipment is determined as the difference between the sales proceeds and thecarrying amount of the asset and is recognised in the statement of comprehensiveincome.The expected useful lives for plant and equipment, other than owner-occupied landand buildings, range from 2.5 to 20 years (2010: 2.5 to 20 years).n) Financial instruments not held to back insurance liabilitiesFinancial assets not held to back insurance liabilities include financialinstruments used in the provision of banking services and assets not included innote 2.3(g). Financial assets and financial liabilities are recognised on <strong>TIO</strong>’sstatement of financial position when <strong>TIO</strong> becomes a party to the contractualprovisions of the instrument.<strong>TIO</strong> <strong>Annual</strong> <strong>Report</strong> 2010/<strong>2011</strong> 51
Territory Insurance OfficeNotes to the Financial Statements30 June <strong>2011</strong>Trade receivables (excluding premium receivables)Trade receivables and other debtors are measured at initial recognition at fairvalue, and are subsequently measured at amortised cost using the effective interestrate method. Appropriate allowances for estimated irrecoverable amounts arerecognised in the statement of comprehensive income when there is objectiveevidence that the asset is impaired. The allowance recognised is measured as thedifference between the asset’s carrying amount and the present value of estimatedfuture cash flows discounted at the effective interest rate computed at initialrecognition.Loans <strong>TIO</strong> Insurance & BankingAll loans are measured at initial recognition at fair value, and are subsequentlymeasured at amortised cost using the effective interest rate method. The effectiveinterest rate calculation includes the contractual terms of loans together with feesand transaction costs.All loans are kept under continuous management review to assess whether there isany objective evidence that any loan or group of loans is impaired. A specificprovision is made for all identified impaired loans when there is reasonable doubtover the collectability of principal and interest in accordance with the loanagreement. All bad debts are written off against the specific provision in the periodin which they are classified as not recoverable. An appropriate collective impairmentprovision is determined by estimation of expected losses in relation to loanportfolios where specific identification is impractical, based on peer groupexperience. Adjustments to the collective impairment provision are accounted forthrough the statement of comprehensive income. The provision recognised ismeasured as the difference between the asset’s carrying amount and the presentvalue of estimated future cash flows discounted at the effective interest rate.Securitisation – <strong>TIO</strong> Insurance & Banking<strong>TIO</strong> has a sub origination and management agreement with Integris SecuritisationServices Pty Ltd (Master Servicer) and Cuscal Management Pty Limited (Manager)which are wholly owned subsidiaries of Cuscal Limited, to assign securitised homeloans with Integrity Trust, which is managed by Perpetual Trustee Company Limited(Trustee of the Trust).These securitised loans are reported as “on statement of financial position”mortgage products under AASB 139, and are subject to mortgage insurance. <strong>TIO</strong>recognises the financial liability to the Trust as a securitisation liability. Thecontractual arrangements of the securitisation program do not meet the criteriaoutlined in AASB139 Financial Instruments: Recognition and Measurement fortransferring assets off statement of financial position.<strong>TIO</strong> is the loan originator and it services and assigns selected loans to the Trusteeof the Trust in exchange for cash consideration. <strong>TIO</strong> passes on all cash flows of theloans to the Trust. <strong>TIO</strong> will continue to service these securitised loans on behalf ofthe trust and receives fee income for doing so. <strong>TIO</strong> receives interest from the loanportfolio and pays interest expense in relation to the funding costs of thesecuritisation. As loans are not derecognised, <strong>TIO</strong> will continue to recognise interestincome on an accrual basis.<strong>TIO</strong> <strong>Annual</strong> <strong>Report</strong> 2010/<strong>2011</strong> 52
Territory Insurance OfficeNotes to the Financial Statements30 June <strong>2011</strong>In respect of insurance costs associated with mortgage insurance, <strong>TIO</strong> account forthese costs as a prepayment and they will be charged to the statement ofcomprehensive income over the life of the contract.Loan assets are assessed for impairment.InvestmentsAll purchases and sales of financial assets that require delivery of the asset withinthe time frame established by regulation or market convention (‘regular way’transactions) are recognised on the date of settlement, being the date the asset isdelivered to or by <strong>TIO</strong>. In cases where the period between trade and settlementexceeds this time frame, the transaction is also recognised at settlement date.Financial assets are derecognised when the rights to receive future cash flows fromthe assets have expired, or have been transferred, and <strong>TIO</strong> has transferredsubstantially all the risks and rewards of ownership.Investment assets other than those held to back insurance liabilities, have beencategorised as “at fair value through the profit and loss”, as they are held fortrading. They are part of a portfolio of identified financial instruments that aremanaged together and for which there is evidence of a recent actual pattern ofshort-term profit-taking.Cash and cash equivalentsCash and cash equivalents comprise cash on hand, demand deposits and short termhighly liquid investments that are readily convertible into known amounts of cashand which are subject to an insignificant risk of changes in value. Short term cashequivalents held for investment purposes and not to meet the short term cashcommitments of <strong>TIO</strong> are excluded from cash and cash equivalents.Subordinated loans and depositsInterest-bearing subordinated loan and deposits are initially measured at fair value,and are subsequently measured at amortised cost, using the effective interest ratemethod.Trade payablesTrade payables are initially measured at fair value, and are subsequently measuredat amortised cost, using the effective interest rate method.Derivative financial instruments - <strong>TIO</strong> Insurance & Banking<strong>TIO</strong>’s activities expose it primarily to the financial risk associated with changes ininterest rates.<strong>TIO</strong> uses interest rate swaps to hedge its risks associated with interest ratefluctuations relating to certain loans attracting a fixed rate of interest. <strong>TIO</strong>’s policyis to convert a proportion of its fixed rate loan assets to a variable rate of interest.<strong>TIO</strong>’s external investment managers utilise derivatives as part of the managementof exposures associated with those portfolios of investments held for trading.<strong>TIO</strong> <strong>Annual</strong> <strong>Report</strong> 2010/<strong>2011</strong> 53
Territory Insurance OfficeNotes to the Financial Statements30 June <strong>2011</strong>The use of financial derivatives is governed by the <strong>TIO</strong>’s policies approved by <strong>TIO</strong>’sBoard, which provide written principles on the use of financial derivatives consistentwith the <strong>TIO</strong>’s risk management strategy. <strong>TIO</strong> does not use derivative financialinstruments for speculative purposes.Derivative financial instruments are initially measured at fair value on the contractdate, and are remeasured to fair value at subsequent reporting dates. Derivativesare carried as assets when their fair value is positive and as liabilities when theirfair value is negative.Hedge accounting<strong>TIO</strong> designates its interest rate swaps as cash flow hedges. The movement in fairvalue is recognised in the statement of comprehensive income for all derivativesother than those which qualify for hedge accounting.At the inception of the hedge relationship <strong>TIO</strong> documents the relationship betweenthe hedging instrument and hedged item, along with its risk managementobjectives and its strategy for undertaking the hedge transaction. Furthermore, atthe inception of the hedge and on an ongoing basis, <strong>TIO</strong> documents whether thehedging instrument that is used in a hedging relationship is highly effective inoffsetting changes cash flows of the hedged item.Note 33 includes details of the fair values of the derivative instruments used forhedging purposes. Movements in the hedging reserve in equity are also detailed inthe Statement of Changes in Equity.Cash flow hedgeThe effective portion of changes in the fair value of derivatives that are designatedand qualify as cash flow hedges are deferred in equity. The gain or loss relating tothe ineffective portion is recognised immediately in profit or loss as part of otherexpenses or other income. Amounts deferred in equity are recycled in profit or lossin the periods when the hedged item is recognised in profit or loss in the same lineof the statement of comprehensive income as the recognised hedged item. Hedgeaccounting is discontinued when <strong>TIO</strong> revokes the hedging relationship, the hedginginstrument expires or is sold, terminated, or exercised, or no longer qualifies forhedge accounting. Any cumulative gain or loss deferred in equity at that timeremains in equity and is recognised when the forecast transaction is ultimatelyrecognised in profit or loss. When a forecast transaction is no longer expected tooccur, the cumulative gain or loss that was deferred in equity is recognisedimmediately in profit or loss.o) Employee benefits<strong>TIO</strong> Insurance & Banking:Provision is made for employee benefits accumulated as a result of employeesrendering services up to the reporting date. These benefits include wages andsalaries, annual leave and long service leave.<strong>TIO</strong> <strong>Annual</strong> <strong>Report</strong> 2010/<strong>2011</strong> 54
Territory Insurance OfficeNotes to the Financial Statements30 June <strong>2011</strong>Liabilities arising in respect of wages and salaries, all annual leave, and any otheremployee benefits expected to be settled within twelve months of the reportingdate are measured at their undiscounted amounts based on remuneration rateswhich are expected to be paid when the liability is settled.All other employee benefit liabilities are recognised, and are measured as thepresent value of expected future payments to be made in respect of servicesprovided by employees up to the reporting date. Consideration is given to theexpected future wage and salary levels, experience of employee departures andperiods of service. Expected future payments are discounted using interest rates onnational government guaranteed securities with terms to maturity that match, asclosely as possible, the estimated future cash outflows.MAC Fund:The MAC Fund does not employ staff in its own right; accordingly there are noemployee benefit liabilities.p) Translation of foreign currency transactionsForeign currency transactions are initially translated into Australian currency at therate of exchange at the date of the transaction. At balance date amounts payableand receivable in foreign currencies are translated to Australian currency at rates ofexchange at that date. Resulting exchange differences are recognised in thestatement of comprehensive income for the year.q) Cash and Cash EquivalentsCash and cash equivalents comprise cash on hand, demand deposits and short termhighly liquid investments that are readily convertible into known amounts of cashand which are subject to an insignificant risk of changes in value. Short term cashequivalents held for investment purposes and not to meet the short term cashcommitments of <strong>TIO</strong> are excluded from cash and cash equivalents.r) Intangible assetsIntangible assets are measured at cost. Following initial recognition, the intangibleasset is carried at cost less any accumulated amortisation and accumulatedimpairment losses. <strong>TIO</strong> amortises intangible assets on a basis which reflects thepattern of when expected economic benefits are likely to be realised.All intangible assets are not internally generated and are considered to have a finitelife. Software development expenditure that meets the criteria for recognition as anintangible asset is capitalised on the statement of financial position and amortisedover 1-4 years, subject to impairment testing.s) Funding for road safety programs – MAC FundPursuant to Sections 23 and 26 of the Territory Insurance Office Act, <strong>TIO</strong> providesthe Northern Territory Government with funds to meet certain costs in relation tothe operation of the road safety programs.t) Accounts payableThese amounts represent liabilities for goods and services provided to <strong>TIO</strong> prior tothe end of the financial year and which are unpaid. The amounts are unsecured andare usually paid within 30 days of recognition.<strong>TIO</strong> <strong>Annual</strong> <strong>Report</strong> 2010/<strong>2011</strong> 55
Territory Insurance OfficeNotes to the Financial Statements30 June <strong>2011</strong>u) Deposits<strong>TIO</strong> Insurance & Banking:Interest-bearing deposits are initially measured at fair value, and are subsequentlymeasured at amortised cost, using the effective interest rate method.MAC Fund:This policy is not applicable to the MAC Fund.v) LeasesLeases are classified at their inception as either operating or finance leases basedon the economic substance of the agreement so as to reflect the risks and benefitsincidental to ownership.Operating leases where <strong>TIO</strong> is a lessee<strong>TIO</strong> enters into operating leases for office accommodation. Rentals payable underoperating leases are charged to the statement of comprehensive income on astraight-line basis over the term of the relevant lease. Benefits received andreceivable as an incentive to enter into an operating lease are also spread on astraight-line basis over the lease term.Operating leases where <strong>TIO</strong> is a lessor<strong>TIO</strong> is a lessor in respect of operating leases that are entered into with tenants whooccupy properties owned by <strong>TIO</strong>. Rental income from operating leases is recognisedon a straight-line basis over the term of the relevant lease. Initial direct costsincurred in negotiating and arranging operating leases are added to the carryingamount of the leased assets and recognised on a straight-line basis over the leaseterm.w) ProvisionsA Provision is a liability of uncertain timing or amount which is recognised in thestatement of financial position when:• <strong>TIO</strong> has a present obligation (legal or constructive) as a result of a past event;• It is probable that an outflow of economic benefits will be required to settle theobligation; and• The amount can be reliably measured.If the effect is material, provisions are determined by discounting the expectedfuture cash flows at a pre-tax rate that reflects current market assessments of thetime value of money and, when appropriate, the risks specific to the liability.x) Contingent liabilities and contingent assetsContingent liabilities are not recognised in the statement of financial position butare disclosed in the financial statements, unless the possibility of settlement isremote, in which case no disclosure is made. If settlement becomes probable, aprovision is recognised.Contingent assets are not recognised in the statement of financial position but aredisclosed in the financial statements when inflows are probable. If inflows becomevirtually certain, an asset is recognised.<strong>TIO</strong> <strong>Annual</strong> <strong>Report</strong> 2010/<strong>2011</strong> 56
Territory Insurance OfficeNotes to the Financial Statements30 June <strong>2011</strong>The amount disclosed as a contingent liability or contingent asset is the bestestimate of the settlement or inflow.y) CommitmentsCommitments are not recorded on the statement of financial position but aredisclosed in the financial statements at their face value.z) ComparativesWhere necessary, comparatives have been reclassified and repositioned forconsistency with current year disclosures.aa) Rounding of amountsAmounts in the financial statements are presented in Australian dollars and havebeen rounded off to the nearest thousand dollars, or in certain cases, to the nearestdollar.2.4 Critical accounting judgments and estimates<strong>TIO</strong> makes estimates, judgments and assumptions in respect of certain key assetsand liabilities. Estimates and judgments are continually evaluated and are based onhistorical experience and other factors, including expectations of future events thatare believed to be reasonable under the circumstances. The key areas in whichcritical estimates are applied are described below and relate to outstanding claimsliabilities and reinsurance assets.a) The ultimate liability arising from claims made underinsurance contractsProvision is made at the year end for the estimated cost of claims incurred but notsettled at the statement of financial position date, including the cost of claimsincurred but not yet reported to <strong>TIO</strong>. The estimated cost of claims includes directexpenses to be incurred in settling claims gross of the expected value of salvageand other recoveries.<strong>TIO</strong> takes all reasonable steps to ensure that it has appropriate informationregarding its claims exposures. However, given the uncertainty in establishingclaims provisions, it is likely that the final outcome will prove to be different fromthe original liability established.The estimation of claims incurred but not reported ('IBNR') is generally subject to agreater degree of uncertainty than the estimation of the cost of settling claimsalready notified to <strong>TIO</strong>, where more information about the claim event is generallyavailable. IBNR claims may often not be apparent to the insured until many yearsafter the events giving rise to the claims have happened. In relation to the workerscompensation, liability and MAC Fund classes of businesses, there is typically agreater variation between initial estimates and final outcomes due to theuncertainty in estimating the ultimate cost of claims reported.<strong>TIO</strong> <strong>Annual</strong> <strong>Report</strong> 2010/<strong>2011</strong> 57
Territory Insurance OfficeNotes to the Financial Statements30 June <strong>2011</strong>For the short-tail personal and domestic classes, claims are typically reported soonafter the claim event, are settled within a reasonably short period, and hence tendto display lower levels of volatility. In calculating the estimated cost of unpaidclaims <strong>TIO</strong> uses a variety of estimation techniques, generally based upon statisticalanalyses of historical experience, which assumes that the development pattern ofthe current claims will be consistent with past experience. Allowance is made,however, for changes or uncertainties which may create distortions in theunderlying statistics or which might cause the cost of unsettled claims to increaseor reduce when compared with the cost of previously settled claims including:• changes in <strong>TIO</strong> processes which might accelerate or slow down thedevelopment and/or recording of paid or incurred claims, compared with thestatistics from previous periods• changes in the legal environment• the effects of inflation• changes in the mix of business• the impact of large losses• movements in industry benchmarks• medical and technological developmentsA component of these estimation techniques is usually the estimation of the cost ofnotified but not paid claims. In estimating the cost of these claims <strong>TIO</strong>has regard to the claim circumstance as reported, any information available fromloss adjusters and information on the cost of settling claims with similarcharacteristics in previous periods.Large claims impacting each relevant business class are generally assessedseparately, being measured on a case by case basis or projected separately inorder to allow for the possible distortive effect of the development and incidence ofthese large claims.Where possible, <strong>TIO</strong> adopts multiple techniques to estimate the required level ofprovisions. This assists in giving greater understanding of the trends inherent in thedata being projected. The projections given by the various methodologies alsoassist in setting the range of possible outcomes. The most appropriate estimationtechnique is selected taking into account the characteristics of the business classand the extent of the development of each accident year.Provisions are calculated gross of any reinsurance recoveries. A separateestimate is made of the amounts that will be recoverable from reinsurersbased upon the gross provisions.Details of specific assumptions used in deriving the outstanding claims liability atyear end are detailed in note 3.b) Assets arising from reinsurance contractsAssets arising from reinsurance contracts are also computed using the abovemethods. The recoverability of these assets is assessed on a periodic basis toensure that the balance is reflective of the amounts that will ultimately bereceived, taking into consideration factors such as counterparty and credit risk.Impairment is recognised where there is objective evidence that <strong>TIO</strong> may notreceive amounts due to it and these amounts can be reliably measured.<strong>TIO</strong> <strong>Annual</strong> <strong>Report</strong> 2010/<strong>2011</strong> 58
3. Actuarial assumptions and methodsTerritory Insurance OfficeNotes to the Financial Statements30 June <strong>2011</strong><strong>TIO</strong> currently writes the following classes of business:Disclosure category Category of business Class of business NatureGeneral Insurance Personal lines Home Short TailMotorMarineOtherShort TailShort TailShort TailCommercial lines Fire and ISR Short TailContractorsMarineMotorOtherShort TailShort TailShort TailShort TailWorkers compensation Workers compensation Long TailLiability Public liability Long TailIndemnityLong TailMAC Fund Compulsory Third Party Compulsory Third Party Long TailShort Tail – claims are typically settled within one year of being reported.Long Tail – claims are typically settled over a period longer than one year of beingreported or are not typically reported within a year of inception of the loss event.The process for determining the value of outstanding claims liabilities in respect of theseclasses of business categories is described below.Personal and commercial lines (short tail)With personal and commercial lines short tail business, there is not a significant delaybetween the occurrence of the claim and the claim being reported to <strong>TIO</strong>. Historicloss ratios are analysed to determine how claims incurred in previous periods havedeveloped over time. In addition, ultimate claims incurred are estimated based onpast reporting patterns, and payments per claim incurred models are used to projectfuture payments. Final estimates are adopted taking both loss ratio and paymentsbased models into account.<strong>TIO</strong> <strong>Annual</strong> <strong>Report</strong> 2010/<strong>2011</strong> 59
Territory Insurance OfficeNotes to the Financial Statements30 June <strong>2011</strong>Workers compensation, liability and MAC Fund (long tail)Claims estimates for <strong>TIO</strong>’s long tail business are derived from analysis of the results ofseveral different actuarial methods including claims incurred, payment per active claims,claims estimates, and annuity. Payment reporting patterns and payment experience areanalysed to develop a weighting to each method that the actuary expects to bestrepresent likely future payments at that the valuation date. In the latest valuation for<strong>TIO</strong> more weight has been given to average claims size based results for most accidentyears. For MAC more weight has been given to claims estimates based results for mostaccident years.Claims inflation is incorporated into the resulting projected payments, to allow for bothgeneral economic inflation as well as any superimposed inflation detected in themodelling of payments experience. Superimposed inflation arises from non-economicfactors such as developments of legal precedent.Projected payments are discounted to allow for the time value of money. The long tailclasses of business are also subject to the emergence of new types of latent claims, butno specific allowance is included for this as at the statement of financial position date.Such uncertainties are considered when setting the risk margin appropriate for thisclass.Inwards reinsurance<strong>TIO</strong>’s inwards reinsurance portfolio is in run-off. Claims estimates for <strong>TIO</strong>'s inwardsreinsurance business are derived from an analysis of the historic development ofincurred claims, paid claims and loss ratios. For some classes, ultimate loss ratios areapplied which reflect the long term expected level. For other classes, estimates arebased on case estimates, with appropriate allowance for future development based onhistoric experience. Allowance is made for inflation and projected payments arediscounted to allow for the time value of money.Actuarial assumptionsThe following assumptions were made in determining the outstanding claims liabilities.<strong>2011</strong> 2010 <strong>2011</strong> 2010Insurance Insurance MAC Fund MAC FundAverage weighted term to settlement 4.01 3.95 9.64 9.55Average claim frequency (latest accident year) 7.83% 8.98% 0.27% 0.30%Average claim size 5,074 5,441 75,795 74,437Expense rate 6.78% 6.05% 7.50% 7.50%Discount rate 4.8%-5.8% 4.5%-5.8% 4.8%-5.8% 4.5%-5.8%Inflation 4.20% 4.20% 4.20% 4.20%Process used to determine assumptionsA description of the processes used to determine these assumptions is provided below:Average weighted term to settlementThe average weighted term to settlement is calculated separately by class of businessbased on historic payment patterns.<strong>TIO</strong> <strong>Annual</strong> <strong>Report</strong> 2010/<strong>2011</strong> 60
Territory Insurance OfficeNotes to the Financial Statements30 June <strong>2011</strong>Average claim frequencyClaim frequency is estimated by projecting the number of claims incurred based on pastpatterns and dividing this by the number of policies in force.Expense rateClaims handling expenses were calculated by reference to budgeted future expenditure,allocated to class of business and compared to past payments.Discount rateDiscount rates derived from market yields on Commonwealth Government securities asat the balance date have been adopted.InflationEconomic inflation assumptions are set by reference to current economic indicators.Sensitivity analysis - insurance contractsi) Summary<strong>TIO</strong> conducts sensitivity analyses to quantify the exposure to risk of changes in the keyunderlying variables. The valuations included in the reported results are calculated usingcertain assumptions about these variables as disclosed above. The movement in any keyvariable will impact the performance and equity of <strong>TIO</strong>. The tables below describe how achange in each assumption will affect the insurance liabilities and show an analysis ofthe sensitivity of the profit/(loss) and equity to changes in these assumptions both grossand net of reinsurance.VariableAverage weighted termto settlementAverage claim frequencyExpense rateDiscount rateInflationImpact of movement in variableA decrease in the average term to settlement in the long tail classes of business classwould lead to more claims being paid sooner than anticipated. Expected paymentpatterns are used in determining the outstanding claims liability. An increase ordecrease in the average weighted term would have a corresponding increase ordecrease on claims expense respectively.Claims frequencies are used in determining the level of claims incurred but not reported(IBNR). An increase or decrease in the assumed average frequency levels would have acorresponding impact on claims expense.An estimate for the internal costs of handling claims is included in the outstandingclaims liability. An increase or decrease in the expense rate assumption would have acorresponding impact on claims expense.The outstanding claims liability is calculated by reference to expected future payments.These payments are discounted to adjust for the time value of money. An increase ordecrease in the assumed discount rate will have an opposing impact on total claimsexpense.Expected future payments are inflated to take account of inflationary increases. Inaddition to the general economic inflation rate an amount is superimposed to takeaccount of non- economic inflationary factors, such as increases in court awards. Suchrates of inflation are specific to the model adopted. An increase or decrease in theassumed levels of inflation would have a corresponding impact on claims expense, withparticular reference to longer tail business.<strong>TIO</strong> <strong>Annual</strong> <strong>Report</strong> 2010/<strong>2011</strong> 61
Territory Insurance OfficeNotes to the Financial Statements30 June <strong>2011</strong>ii) Impact of changes in key variablesVariableMovement invariableEffect on Profit/(loss)before taxGross of Net ofreinsurance reinsurance$’000 $’000Adjusted amountsEquity$’000InsuranceWeighted term to settlement +10% (1,668) (1,150) (805)-10% 1,642 1,136 795Average claim frequency – latest accidentyear+10% (6,248) (4,850) (3,395)-10% 5,955 4,578 3,205Average claim size +10% (12,571) (9,888) (6,922)-10% 12,571 9,888 6,922Expense rate +1% (1,264) (1,262) (884)-1% 1,264 1,262 884Discount rate +1% 5,255 3,681 2,577-1% (5,917) (4,066) (2,846)Inflation +1% (5,922) (4,387) (3,071)-1% 5,353 4,029 2,820MAC FundWeighted term to settlement +10% (3,022) (2,382) (2,382)-10% 2,989 2,359 2,359Average claim frequency – latest accidentyear+10% (1,368) (1,384) (1,384)-10% 1,111 1,125 1,125Average claim size +10% (27,143) (24,142) (24,142)-10% 27,143 24,142 24,142Expense rate +1% (2,525) (2,525) (2,525)-1% 2,525 2,525 2,525Discount rate +1% 22,729 20,137 20,137-1% (27,483) (24,396) (24,396)Inflation +1% (27,551) (27,551) (27,551)-1% 23,169 23,169 23,169<strong>TIO</strong> <strong>Annual</strong> <strong>Report</strong> 2010/<strong>2011</strong> 62
Territory Insurance OfficeNotes to the Financial Statements30 June <strong>2011</strong>4. Insurance contracts – risk management policiesand proceduresUnless stated otherwise the following disclosures relate to both <strong>TIO</strong> and the MACFund.a) Objectives in managing risks arising from insurance contracts andpolicies for mitigating those risks<strong>TIO</strong> has an objective to control insurance risk thus reducing the volatility ofoperating profits. In addition to the inherent uncertainty of insurance risk, whichcan lead to significant variability in the loss experience, profits from insurancebusiness are affected by market factors, particularly competition and movements inasset values. Short-term variability is, to some extent, a feature of insurancebusiness.The Board and senior management of <strong>TIO</strong> have developed, implemented andmaintained a sound and prudent Risk Management Framework (RMF) and aReinsurance Management Strategy (REMS).The RMF and REMS identify <strong>TIO</strong>'s policies and procedures, processes and controlsthat comprise its risk management and control systems. These systems address allmaterial risks, financial and non-financial, likely to be faced by <strong>TIO</strong>.The RMF and REMS have been approved by the Board. Key aspects of theprocesses established in the RMF to mitigate risks include:• The maintenance and use of management information systems, which provideup to date, reliable data on the risks to which the business is exposed at anypoint in time.• Information from the management information systems, is used to calculatepremiums and monitor claims patterns. Statistical analysis of past experience isused as part of the process. Actuarial models are also utilised in specific classesand in all claims valuations.• Documented procedures are followed for underwriting and accepting insurancerisks.• Natural disasters such as cyclones are more challenging to manage. <strong>TIO</strong> monitorexposure to such risks through special modelling techniques involving thecollation of data on weather patterns which support decisions on limitingexposure.• Reinsurance is used to limit <strong>TIO</strong>’s exposure to large single claims andcatastrophes. When selecting a reinsurer we only consider those companies thatprovide high security. In order to assess this we use rating information from thepublic domain or gathered through internal investigations.• In order to limit concentrations of credit risk, in purchasing reinsurance <strong>TIO</strong> hasregard to existing reinsurance assets and seeks to limit excess exposure to anysingle reinsurer or group of related reinsurers.• The mix of assets in which we invest is driven by the nature and term of theinsurance liabilities.• The diversification of the business over numerous classes of insurance and largenumbers of uncorrelated individual risks seeks to reduce variability in lossexperience.<strong>TIO</strong> <strong>Annual</strong> <strong>Report</strong> 2010/<strong>2011</strong> 63
Territory Insurance OfficeNotes to the Financial Statements30 June <strong>2011</strong>b) Terms and conditions of insurance and inwards reinsurancebusinessThe terms and conditions attaching to insurance contracts affect the level ofinsurance risk accepted by <strong>TIO</strong>. The majority of direct insurance contracts writtenare entered into on a standard form basis. All inwards reinsurance contracts aresubject to substantially the same terms and conditions. There are no special termsand conditions in any non standard contracts that have a material impact on thefinancial statements. All insurance contracts written in the Northern Territory aresubject to substantially the same terms and conditions.c) Concentration of insurance risk<strong>TIO</strong>’s exposure to concentrations of insurance risk is lessened by a portfoliodiversified into numerous classes of business. Specific processes for monitoringidentified key concentrations are set out below.Risk Source of concentration Risk management measuresNatural catastrophesProperties concentrated inregions that are subject tocyclones, floods and stormsurges.<strong>TIO</strong> has modelled aggregated risk bypostcode using commercially availablecatastrophe models with a specific <strong>TIO</strong>model developed in conjunction with WillisRe.Based on the probable maximum loss perthe models, <strong>TIO</strong> purchases catastrophereinsurance cover to limit exposure to anysingle event.d) Development of claimsThere is a possibility that changes may occur in the estimate of our obligations atthe end of a contract period. The tables in note 19 show our estimates of totalclaims outstanding for each underwriting year at successive year ends.e) Interest rate riskInterest rate risk arises from insurance contracts due to the extent that there is aneconomic mismatch between the fixed-interest portfolios used to back theoutstanding claims’ liabilities and those outstanding claims. The interest rate riskis managed by matching the duration profiles of the investment assets and theoutstanding claims’ liability.f) Credit riskFinancial assets and liabilities arising from insurance and reinsurance contracts arestated in the statement of financial position at the amount that best represents themaximum credit risk exposure at reporting date. There are no significantconcentrations of credit risk. Additional information relating to the ageing ofpremium debtors is included in note 33 (c).<strong>TIO</strong> <strong>Annual</strong> <strong>Report</strong> 2010/<strong>2011</strong> 64
Territory Insurance OfficeNotes to the Financial Statements30 June <strong>2011</strong>g) Reinsurance counterparty risk<strong>TIO</strong> reinsures a portion of risks underwritten to control exposure to insurancelosses, reduce volatility and protect capital. <strong>TIO</strong>’s strategy in respect of theselection, approval and monitoring of reinsurance arrangements is addressed by thefollowing protocols, which are overseen by the Reinsurance Committee:• Treaty or facultative reinsurance is placed in accordance with the requirementsof <strong>TIO</strong>’s reinsurance management strategy.• Reinsurance arrangements are regularly reassessed to determine theireffectiveness based on current exposures, historical losses and potential futurelosses based on Realistic Disaster Scenarios and <strong>TIO</strong>’s Maximum EventRetention.• Exposure to reinsurance counterparties and the credit quality of thosecounterparties is actively monitored.Strict controls are maintained over reinsurance counterparty exposures.Reinsurance is placed with counterparties that have a strong credit rating andconcentration of risk is managed by adherence to counterparty limits. Counterpartylimits are reviewed by management on a regular basis. Credit risk exposures arecalculated regularly and compared with authorised credit limits.The following table provides information about the quality of <strong>TIO</strong>’s credit riskexposure in respect of reinsurance and other recoveries on outstanding claims atthe balance date. The analysis classifies the assets according to Standard & Poor’scounterparty credit ratings. AAA is the highest possible rating.Credit RatingsAAA AA A Unrated Total$’000 $’000 $’000 $’000 $’000Reinsurance and other recoverieson outstanding claimsReinsurance and other recoverieson paid claims<strong>2011</strong> 40 29,608 28,797 7,319 65,7642010 1,530 22,425 25,187 6,546 55,688<strong>2011</strong> 4 545 300 4,422 5,2712010 1,067 2,221 1,845 2,168 7,301The following table provides further information regarding the ageing of reinsuranceand other recoveries on paid claims as at 30 June.0 to 3months3 to 6monthsGreaterthan 6monthsImpairedTotal$’000 $’000 $’000 $’000 $’000Reinsurance andrecoveries on paidclaims<strong>2011</strong>Insurance 5,019 3 89 160 5,271MAC (15) (5) 0 20 -Total <strong>TIO</strong> 5,004 (2) 89 180 5,2712010 Insurance 5,127 (1,666) 1,279 318 5,058MAC 2,411 (144) (213) 189 2,243Total <strong>TIO</strong> 7,538 (1,810) 1,066 507 7,301<strong>TIO</strong> <strong>Annual</strong> <strong>Report</strong> 2010/<strong>2011</strong> 65
Territory Insurance OfficeNotes to the Financial Statements30 June <strong>2011</strong>5. Revenue<strong>2011</strong> 2010$’000 $’000 $’000 $’000 $’000 $’000<strong>TIO</strong><strong>TIO</strong> Insurance& Banking MAC Fund <strong>TIO</strong><strong>TIO</strong> Insurance& BankingMAC FundPremium revenueDirect (note 9) 162,991 100,742 62,249 154,687 96,288 58,399Inwards reinsurance (note9) - - - - - -162,991 100,742 62,249 154,687 96,288 58,399Reinsurance and otherrecoveries 27,649 25,021 2,628 26,203 15,279 10,924Revenue from therendering of servicesRevenue from financialassets and liabilities not atfair value through profit andloss 5,796 5,796 - 6,714 6,714 -Other Revenue from therendering of services 325 66 259 292 72 2206,121 5,862 259 7,006 6,786 220Finance revenueInterest revenue – Banking 44,142 44,142 - 41,752 41,752 -Interest revenue – NonBanking 11,824 3,894 7,930 9,151 3,490 5,66155,966 48,036 7,930 50,903 45,242 5,661Financial assets at fair valuethrough profit and loss:Trust distributions 25,673 5,577 20,096 17,664 3,934 13,730Change in the fair value ofinvestments held for trading 4,588 1,451 3,137 16,340 4,640 11,700Net gain on the disposal ofinvestments held for trading 8,665 3,081 5,584 4,081 1,224 2,857Change in fair value ofderivatives – ineffectivecash flow hedges (60) (60) - 470 470 -Change in fair value ofderivatives - other - - - 119 119 -94,832 58,085 36,747 89,577 55,629 33,948Revenue from propertiesRental revenue 2,727 724 3,267 2,091 568 2,8462,727 724 3,267 2,091 568 2,846Other incomeBad debts recovered 131 131 - 44 44 -Operating expensesrecovered from relatedparty - 7,979 - - 7,736 -Other miscellaneous income 716 254 462 803 467 336847 8,364 462 847 8,247 336Total revenue 295,167 198,798 105,612 280,411 182,797 106,673<strong>TIO</strong> <strong>Annual</strong> <strong>Report</strong> 2010/<strong>2011</strong> 66
Territory Insurance OfficeNotes to the Financial Statements30 June <strong>2011</strong>6. Other specific net (losses)/gains and expensesincluded in the statement of comprehensiveincome<strong>TIO</strong><strong>2011</strong> 2010<strong>TIO</strong>Insurance& BankingMAC Fund<strong>TIO</strong><strong>TIO</strong>Insurance& BankingMAC Fund$’000 $’000 $’000 $’000 $’000 $’000Profit (Loss) on sale of property,plant and equipment33 33 - (86) (86) -Depreciation – property, plantand equipment(898) (858) (40) (1,657) (1,103) (554)Amortisation of intangible assets (815) (555) (260) (2,526) (342) (2,184)Impairment loss – Loans andreceivables276 107 169 (205) (192) (13)Interest expense – Banking (32,639) (32,639) - (29,779) (29,779) -Operating expenses on-chargedby related party- - (7,979) - - (7,736)Rental expense relating tooperating leases – minimum leasepayments(711) (1,933) (42) (738) (2,016) (45)7. Interest revenue and interest expenseThe following table shows the amount of interest revenue or expense for each of themajor categories of Banking’s interest-bearing assets and liabilities.<strong>TIO</strong> – BANKING <strong>2011</strong> 2010$’000 $’000Interest revenueFrom assets carried at amortised cost:Commercial loans 2,695 2,900Home loans 34,995 31,614Personal loans 1,170 2,039From assets at fair value through profit and loss:Investment securities & Cash at Bank 4,128 3,102Interest Rate Swaps 1,154 2,09644,142 41,752Interest expenseFrom liabilities carried at amortised cost:Customer deposits 26,299 20,535Securitisation 5,086 6,082From Liabilities at fair value through profit and loss:Interest Rate Swaps 1,254 3,16232,639 29,779Net interest income 11,503 11,973<strong>TIO</strong> <strong>Annual</strong> <strong>Report</strong> 2010/<strong>2011</strong> 67
Territory Insurance OfficeNotes to the Financial Statements30 June <strong>2011</strong>8. Underwriting result<strong>TIO</strong><strong>2011</strong> 2010<strong>TIO</strong>Insurance& BankingMAC Fund<strong>TIO</strong><strong>TIO</strong>Insurance& BankingMAC Fund$’000 $’000 $’000 $’000 $’000 $’000Premium revenue162,991 100,742 62,249 154,687 96,288 58,399Outwards reinsurance premiumexpense(46,012) (39,544) (6,468) (45,050) (37,421) (7,629)Net premium revenue (note 9) 116,979 61,198 55,781 109,637 58,867 50,770Claims expense (122,231) (78,191) (44,040) (130,985) (76,088) (54,897)Reinsurance and other recoveriesrevenue27,649 25,021 2,628 26,203 15,279 10,924Net claims incurred (note 21) (94,582) (53,170) (41,412) (104,782) (60,809) (43,973)Acquisition costs (note 18) (6,305) (5,932) (373) (7,238) (6,556) (682)Deficiency adjustment (note 18) - - - 2,094 2,094 -Underwriting profit/(loss) 16,092 2,096 13,996 (289) (6,404) 6,1159. Net premium revenue<strong>2011</strong><strong>TIO</strong><strong>TIO</strong>Insurance& BankingMACFund$’000 $’000 $’000Gross written premiums168,282 104,294 63,988Movement in unearned premiums (5,291) (3,552) (1,739)Premium revenue 162,991 100,742 62,249Outwards reinsurance premiums (46,012) (39,544) (6,468)Net premium revenue 116,979 61,198 55,7812010<strong>TIO</strong><strong>TIO</strong>Insurance& BankingMACFund$’000 $’000 $’000Gross written premiums 161,867 101,774 60,093Movement in unearned premiums (7,180) (5,486) (1,694)Premium revenue 154,687 96,288 58,399Outwards reinsurance premiums (45,050) (37,421) (7,629)Net premium revenue 109,637 58,867 50,770<strong>TIO</strong> had nil Inwards Reinsurance as at 30 June <strong>2011</strong> (2010: nil).<strong>TIO</strong> <strong>Annual</strong> <strong>Report</strong> 2010/<strong>2011</strong> 68
Territory Insurance OfficeNotes to the Financial Statements30 June <strong>2011</strong>10. Income taxThe following disclosures relate to the operation of the <strong>TIO</strong> as a whole.(a) The major components of income tax expense are:<strong>TIO</strong><strong>2011</strong> 2010$’000 $’000Current income taxCurrent income tax charge 2,342 (644)Adjustment in respect of current income tax of previous years 26 (20)Total current income tax 2,368 (664)Deferred income taxRelating to originating and reversing temporary differencesof deferred tax asset items charged to the statement of comprehensiveincome. 1,100 1,824Relating to originating and reversing temporary differencesof deferred tax liability items charged to the statement of comprehensiveincome. (355) 57Total deferred income tax 745 1,881Income tax (benefit)/expense 3,113 1,217(b) A reconciliation between tax expense and the product of accounting profit beforeincome tax multiplied by <strong>TIO</strong>’s applicable tax rate is as follows:<strong>TIO</strong><strong>2011</strong> 2010$’000 $’000Accounting profit for the period before income tax 55,100 36,673Income tax expense calculated at the tax rate of 30% 16,530 11,001Tax effect of permanent differences:Internal transactions (59) (31)Div 10D building allowance - -Net non-assessable overseas reinsurancepayments/recoveries - -Non deductible expenses 13 7MAC profit (13,280) (9,649)Other items (net) 51 54Income tax expense adjusted for permanent differences 3,255 1,382Adjustments relating to previous years – current income tax 27 (20)Adjustments relating to previous years – deferred income tax - (145)Income tax credits (169) -Income tax expense/(Benefit) 3,113 1,217<strong>TIO</strong> <strong>Annual</strong> <strong>Report</strong> 2010/<strong>2011</strong> 69
Territory Insurance OfficeNotes to the Financial Statements30 June <strong>2011</strong>(c) Amount Recognised in Other Comprehensive Income<strong>TIO</strong><strong>2011</strong> 2010Aggregate current and deferred tax arising in the reporting period and notrecognised in net profit or loss but directly debited to equity$’000 $’000113 231Net deferred tax - debited (credited) directly to equity is made up of thefollowing:Revaluation of Property, Plant and Equipment 104 104Hedging Reserve 9 127113 231(d) Deferred income tax at 30 June relates to the following:<strong>TIO</strong><strong>2011</strong> 2010$’000 $’000Deferred tax assets:Provisions deductible against future taxable income 1,817 2,035Accrued expenditure deductible against future taxable income 707 657Claims handling expense deductible against future taxable income 1,288 1,095Financial Asset losses deductible against future taxable income - 1,111Tax losses - 783Other 270 2844,082 5,965Deferred taxassets:MovementEmployeeentitlementsImpairmentProvisionsExpenseaccrualsClaimshandingFinancialassetsTaxLosses Other Total$’000 $’000 $’000 $’000 $’000 $’000 $’000 $’0001 July 2009 1,341 523 571 1,098 3,304 - 315 7,152Charged/(credited) toincome 276 (105) 86 (3) (2,193) 145 (31) (1,825)Charged directlyto income taxprovision - - - - - 638 - 63830 June 2010 1,617 418 657 1,095 1,111 783 284 5,965Charged/(credited) toincome (152) (66) 50 193 (1,111) - (14) (1100)Charged directlyto income taxprovision - - - - - (783) - (783)30 June <strong>2011</strong> 1,465 352 707 1,288 - - 270 4,082<strong>TIO</strong> <strong>Annual</strong> <strong>Report</strong> 2010/<strong>2011</strong> 70
Territory Insurance OfficeNotes to the Financial Statements30 June <strong>2011</strong><strong>TIO</strong><strong>2011</strong> 2010$’000 $’000Deferred tax liabilities:Interest receivable - 249Property, plant and equipment and investment properties 1,851 1,759Fair value adjustments to financial assets 237 316Other 15 212,103 2,345Deferred taxliabilities: MovementInterestreceivableProperty,plant andequipmentFinancialAssets Other Total$’000 $’000 $’000 $’000 $’0001 July 2009 229 1,668 101 59 2,057Charged /(credited) toincome 20 (14) 88 (37) 57Charged directly toequity - 104 127 - 23130 June 2010 249 1,758 316 22 2,345Charged /(credited) toincome (249) (12) (88) (6) (355)Charged directly toequity - 104 9 - 11330 June <strong>2011</strong> - 1,850 237 16 2,103(e) Tax payable or prepaid as at 30 June:<strong>TIO</strong><strong>2011</strong> 2010$’000 $’000Current tax asset/(liability) is comprised of:Current income tax charge (221) 1,364(221) 1,36411. Cash and cash equivalents<strong>2011</strong> 2010<strong>TIO</strong><strong>TIO</strong>Insurance& BankingMACFund <strong>TIO</strong><strong>TIO</strong>Insurance& BankingMACFund$’000 $’000 $’000 $’000 $’000 $’000Cash at bank and on hand 26,543 20,951 5,592 30,215 27,855 2,36026,543 20,951 5,592 30,215 27,855 2,360<strong>TIO</strong> <strong>Annual</strong> <strong>Report</strong> 2010/<strong>2011</strong> 71
Territory Insurance OfficeNotes to the Financial Statements30 June <strong>2011</strong>12. Trade and other receivables<strong>2011</strong> 2010<strong>TIO</strong><strong>TIO</strong>Insurance& BankingMACFund <strong>TIO</strong><strong>TIO</strong>Insurance& BankingMACFund$’000 $’000 $’000 $’000 $’000 $’000Premiums receivable – direct insurance 47,921 46,784 1,138 47,734 46,648 1,086Less: allowance for impairment loss (179) (179) - (157) (157) -47,742 46,605 1,138 47,577 46,491 1,086Interest receivable 1,915 532 1,383 1,658 830 828Related party receivable - - 1,299 - - 1,027Other debtors 3,906 3,906 - 3,183 3,165 1853,563 51,043 3,820 52,418 50,486 2,959The table below provides a reconciliation of the allowances for impairment losses as at30 June.<strong>2011</strong> 2010<strong>TIO</strong><strong>TIO</strong>Insurance& BankingMACFund<strong>TIO</strong><strong>TIO</strong>Insurance& BankingMACFund$’000 $’000 $’000 $’000 $’000 $’000Opening balance as at30 June(157) (157) - (135) (135) -Premium receivables written off68 68 - 69 69 -(Increase)/ Decrease in the allowancefor the year charged to the statementof comprehensive income(90) (90) - (91) (91) -Closing balance asat 30 June (179) (179) - (157) (157) -Refer to Note 33 (b) for further disclosures.<strong>TIO</strong> <strong>Annual</strong> <strong>Report</strong> 2010/<strong>2011</strong> 72
Territory Insurance OfficeNotes to the Financial Statements30 June <strong>2011</strong>13. Other financial assets and other financial liabilities<strong>2011</strong> 2010Financial Assets<strong>TIO</strong><strong>TIO</strong>Insurance& BankingMACFund <strong>TIO</strong><strong>TIO</strong>Insurance& BankingMACFund$’000 $’000 $’000 $’000 $’000 $’000Derivative financial assetsInterest rate swaps 64 64 - 124 124 -Total derivative financial assets 64 64 - 124 124 -Other financial assetsAt fair value through profit and loss:Investments held for tradingSecurities 617,302 226,118 391,184 566,892 224,679 342,213Total other financial assets 617,302 226,118 391,184 566,892 224,679 342,213Total financial assets 617,366 226,182 391,184 567,016 224,803 342,213Current financial assetsShort term deposits 106,485 93,538 12,947 135,813 98,954 36,859Floating rate notes 7,653 5,755 1,898 10,305 7,952 2,353Bonds 105,945 - 105,945 59,505 - 59,505Other investments 85,042 47,413 37,629 79,649 48,478 31,171Units in unlisted trusts 312,177 79,412 232,765 281,620 69,295 212,325Derivative financial assets 64 64 - 124 124 -Total current financial assets 617,366 226,182 391,184 567,016 224,803 342,213Non-current financial assetsEmbedded derivative financialinstrument - - - - - -Total non-current financial assets - - - - - -Total Financial Assets 617,366 226,182 391,184 567,016 224,803 342,213The investments securities included above represent investments in unlisted unit trusts,bonds and floating rate notes, which offer <strong>TIO</strong> the opportunity for return through interestincome, trust distributions and fair value gains. The fair values of these securities arebased on quoted market prices.The derivative financial asset or financial liability represents the fair value of derivativesin existence at year end. <strong>TIO</strong> is a party to derivative financial instruments in the normalcourse of business in order to economically hedge exposure to fluctuations in interestrates. Interest rate swaps convert the variable nature of the deposits portfolio intofixed.<strong>TIO</strong> <strong>Annual</strong> <strong>Report</strong> 2010/<strong>2011</strong> 73
Territory Insurance OfficeNotes to the Financial Statements30 June <strong>2011</strong>Current Financial LiabilitiesDerivative financial liabilitiesInterest rate swapsTotal derivative financialliabilitiesTotal financial liabilities<strong>2011</strong> 2010<strong>TIO</strong><strong>TIO</strong>Insurance& BankingMACFund <strong>TIO</strong><strong>TIO</strong>Insurance& BankingMACFund$’000 $’000 $’000 $’000 $’000 $’000- - - (102) (102) -- - - (102) (102) -- - - (102) (102) -14. Loans<strong>TIO</strong><strong>2011</strong> 2010<strong>TIO</strong>Insurance&BankingMACFund<strong>TIO</strong><strong>TIO</strong>Insurance&BankingMACFund$’000 $’000 $’000 $’000 $’000 $’000Loans (i) 526,422 526,422 - 564,993 564,993 -Less: allowance for impairment loss (526) (526) - (918) (918) -525,896 525,896 - 564,075 564,075 -Loans - Current assets 11,973 11,973 - 14,333 14,333 -Loans - Non-current assets 513,923 513,923 - 549,742 549,742 -525,896 525,896 - 564,075 564,075 -(i) Includes securitised home loans of $66 million (2010: $86 million) which has anassociated securitised liability of $66 million (2010: $86 million)Refer to note 33 for the financial instrument disclosures relating to these loans. Refer tonote 30 for related party loan disclosures.The table below provides a reconciliation of the allowances for impairment losses as at30 June:<strong>2011</strong> 2010<strong>TIO</strong>Insurance& Banking<strong>TIO</strong>Insurance& Banking<strong>TIO</strong>MAC <strong>TIO</strong>MACFundFund$,000 $,000 $,000 $,000 $,000 $,000Opening balance (918) (918) - (1,053) (1,053) -Loans written off 341 341 - 441 441 -Increase in the allowance for theyear charged to the statement ofcomprehensive income51 51 - (306) (306) -Closing balance (526) (526) - (918) (918) -<strong>TIO</strong> <strong>Annual</strong> <strong>Report</strong> 2010/<strong>2011</strong> 74
Territory Insurance OfficeNotes to the Financial Statements30 June <strong>2011</strong><strong>2011</strong> 2010<strong>TIO</strong><strong>TIO</strong>Insurance &<strong>TIO</strong><strong>TIO</strong>Insurance &Banking MAC FundBanking MAC Fund$,000 $,000 $,000 $,000 $,000 $,000(a) Maturity analysisNot longer than three months 3,309 3,309 - 3,802 3,802 -Longer than three months and not8,664 8,664 - 10,531 10,531 -longer than 12 monthsLonger than one year and not42,298 42,298 - 48,719 48,719 -longer than five yearsLonger than five years 462,500 462,500 - 490,039 490,039 -No maturity specified 9,125 9,125 - 10,984 10,984 -525,896 525,896 - 564,075 564,075 -(b) Loans by purposePersonal 8,049 8,049 - 14,352 14,352 -Commercial 27,773 27,773 - 33,213 33,213 -Home 490,074 490,074 - 516,510 516,510 -525,896 525,896 - 564,075 564,075 -(c) Concentration of risk<strong>TIO</strong> has an exposure to thefollowing geographical segments:Northern Territory residents 483,782 483,782 - 515,827 515,827 -Non-Northern Territory residents 42,114 42,114 - 48,248 48,248 -525,896 525,896 - 564,075 564,075 -<strong>TIO</strong> <strong>Annual</strong> <strong>Report</strong> 2010/<strong>2011</strong> 75
Territory Insurance OfficeNotes to the Financial Statements30 June <strong>2011</strong>15. Intangible assetsAt 1 July 2009AdditionsTransfer from work in progressAmortisation charge for the yearAt 30 June 2010, net of accumulated amortisationAdditionsTransfer from work in progressAmortisation charge for the yearAt 30 June <strong>2011</strong>, net of accumulated amortisation<strong>TIO</strong><strong>TIO</strong>Insurance MAC Fund& Banking$’000 $’000 $’0002,929 351 2,5781,281 1,281 -100 100 -(2,526) (342) (2,184)1,784 1,390 394235 235 -46 46 -(814) (555) (259)1,251 1,116 135At 1 July 2009CostAccumulated amortisationNet carrying amount-10,072 7,177 2,895(7,143) (6,827) (316)2,929 350 2,579At 30 June 2010CostAccumulated amortisationNet carrying amount11,453 8,558 2,895(9,669) (7,169) (2,500)1,784 1,890 395At 30 June <strong>2011</strong>CostAccumulated amortisationNet carrying amount11,735 8,840 2,895(10,484) (7,724) (2,760)1,251 1,116 135Intangible assets consist of software which is not an integral part of related hardware.Software classified in this manner is amortised over a period of 1– 4 years.<strong>TIO</strong> <strong>Annual</strong> <strong>Report</strong> 2010/<strong>2011</strong> 76
Territory Insurance OfficeNotes to the Financial Statements30 June <strong>2011</strong>16. Property, plant and equipment<strong>TIO</strong>Freeholdland andbuildingsDeferredleaseincentivesPlant and Work inequipment progress Total$’000 $’000 $’000 $’000 $’000At 1 July 2009 41,800 52 3,552 142 45,546Additions 52 - 1,048 276 1,376Increase in fair value of owner occupiedproperty 1,394 - - - 1,394Disposals - - (242) - (242)Amortisation of lease incentives - (34) - - (34)Depreciation charge for the year (746) - (909) - (1,655)Transfers to property, plant andequipment and intangible assets - - 40 (140) (100)Transfers to statement of comprehensiveincome - - - (3) (3)At 30 June 2010, net of accumulateddepreciation 42,500 18 3,489 275 46,282Additions 8 - 915 490 1,413Increase in fair value of owner occupiedproperty 1,389 - - - 1,389Disposals - - (69) - (69)Amortisation of lease incentives - - - - -Depreciation charge for the year (747) - (898) - (1,645)Transfers to property, plant andequipment and intangible assets - - 54 (100) (46)Transfers to statement of comprehensiveincome - - - - -At 30 June <strong>2011</strong>, net of accumulateddepreciation 43,150 18 3,491 665 47,324At 1 July 2009Cost or fair value 41,800 52 10,430 142 52,424Accumulated depreciation - - (6,878) - (6,878)Net carrying amount 41,800 52 3,552 142 45,546At 30 June 2010Cost or fair value 42,500 18 10,789 275 53,582Accumulated depreciation - - (7,300) - (7,300)Net carrying amount 42,500 18 3,489 275 46,282At 30 June <strong>2011</strong>Cost or fair value 43,150 18 11,531 665 55,364Accumulated depreciation - - (8,040) - (8,040)Net carrying amount 43,150 18 3,491 665 47,324<strong>TIO</strong> <strong>Annual</strong> <strong>Report</strong> 2010/<strong>2011</strong> 77
Territory Insurance OfficeNotes to the Financial Statements30 June <strong>2011</strong><strong>TIO</strong> - Insurance &BankingFreeholdland andbuildingsDeferredleaseincentivesPlant and Work inequipment progress Total$’000 $’000 $’000 $’000 $’000At 1 July 2009 10,450 13 3,418 142 14,023Additions 13 - 1,048 276 1,337Increase in fair value of owner occupiedproperty 349 - - - 349Disposals - - (242) - (242)Amortisation of lease incentives - (9) - - (9)Depreciation charge for the year (187) - (869) - (1,056)Transfers to property, plant andequipment and intangible assets - - 40 (140) (100)Transfers to statement of comprehensiveincome - - - (3) (3)At 30 June 2010, net of accumulateddepreciation 10,625 4 3,395 275 14,299Additions 2 - 915 490 1,407Increase in fair value of owner occupiedproperty 347 - - - 347Disposals - - (69) - (69)Amortisation of lease incentives - - - - -Depreciation charge for the year (187) - (856) - (1,043)Transfers to property, plant andequipment and intangible assets - - 54 (100) (46)Transfers to statement of comprehensiveincome - - - - -At 30 June <strong>2011</strong>, net of accumulateddepreciation 10,787 4 3,439 665 14,895At 30 June 2009Cost or fair value 10,450 13 10,268 143 20,874Accumulated depreciation - - (6,850) - (6,850)Net carrying amount 10,450 13 3,418 143 14,024At 30 June 2010Cost or fair value 10,625 (21) 10,655 275 21,534Accumulated depreciation - 25 (7,260) - (7,235)Net carrying amount 10,625 4 3,395 275 14,299At 30 June <strong>2011</strong>Cost or fair value 10,787 4 11,398 665 22,853Accumulated depreciation - - (7,959) - (7,959)Net carrying amount 10,787 4 3,439 665 14,895<strong>TIO</strong> <strong>Annual</strong> <strong>Report</strong> 2010/<strong>2011</strong> 78
Territory Insurance OfficeNotes to the Financial Statements30 June <strong>2011</strong>MAC FundFreeholdland andbuildingsDeferredleaseincentivesPlant and Work inequipment progress Total$’000 $’000 $’000 $’000 $’000At 1 July 2009 31,350 39 134 - 31,523Additions 39 - - - 39Increase in fair value of owner occupiedproperty 1,045 - - - 1,045Disposals - - - - -Amortisation of lease incentives - (25) - - (25)Depreciation charge for the year (559) - (40) - (599)Transfers to property, plant and equipmentand intangible assets - - - - -Transfers to investment property - - - - -At 30 June 2010, net of accumulateddepreciation 31,875 14 94 - 31,983Additions 6 - - - 6Increase in fair value of owner occupiedproperty 1,042 - - - 1,042Disposals - - - - -Amortisation of lease incentives - - - - -Depreciation charge for the year (560) - (42) - (602)Transfers to property, plant and equipmentand intangible assets - - - - -Transfers to investment property - - - - -At 30 June <strong>2011</strong>, net of accumulateddepreciation 32,363 14 52 - 32,429At 30 June 2009Cost or fair value 31,350 39 162 - 31,551Accumulated depreciation - - (28) - (28)Net carrying amount 31,350 39 134 - 31,523At 30 June 2010Cost or fair value 31,875 39 134 - 32,048Accumulated depreciation - (25) (40) - (60)Net carrying amount 31,875 14 94 - 31,983At 30 June <strong>2011</strong>Cost or fair value 32,363 14 134 - 32,511Accumulated depreciation - - (82) - (82)Net carrying amount 32,363 14 52 - 32,429<strong>TIO</strong> <strong>Annual</strong> <strong>Report</strong> 2010/<strong>2011</strong> 79
Territory Insurance OfficeNotes to the Financial Statements30 June <strong>2011</strong>The net carrying amount of all classes of property, plant and equipment is considered areasonable approximation of the fair value of the assets in the context of the financialstatements.The Freehold land and buildings represents the building located at 24 Mitchell Street,Darwin. This building has been classified as Property, plant and equipment by virtue ofthe fact that a significant portion is occupied by <strong>TIO</strong>. Portions of this building arehowever leased out for rental income and any costs incurred in the negotiation andarrangement of leases have been capitalised and amortised over the term of therespective leases and are included as part of the carrying value of the respective assetas “Deferred lease incentives”.The fair value of <strong>TIO</strong>’s owner occupied property as at 30 June <strong>2011</strong> has been determinedand approved by the Board on the basis of an independent valuation carried out at thatdate by Bill Linkson; who is a certified practicing valuer of Integrated Valuation ServicesPty Ltd, with relevant experience in the valuation of property in Darwin.The fair value of the property represents the amount at which the assets could beexchanged between a knowledgeable willing buyer and a knowledgeable willing seller inan arm’s length transaction at the date of valuation, in accordance with AustralianValuation Standards.Had the freehold land and buildings have been valued as at 30 June <strong>2011</strong> under a costmodel, the carrying amount would have been $21.4 million (2010: $21.9m).The ownership allocation of the building located at 24 Mitchell Street, Darwin is 25% to<strong>TIO</strong> Insurance and 75% to the MAC Fund.<strong>TIO</strong> <strong>Annual</strong> <strong>Report</strong> 2010/<strong>2011</strong> 80
Territory Insurance OfficeNotes to the Financial Statements30 June <strong>2011</strong>17. Reinsurance and other recoveries receivable<strong>TIO</strong><strong>2011</strong> 2010<strong>TIO</strong>Insurance& BankingMACFund<strong>TIO</strong><strong>TIO</strong>Insurance& BankingMACFund$’000 $’000 $’000 $’000 $’000 $’000Undiscounted on claims paid: 5,271 5,271 - 7,301 5,058 2,243Expected future recoveriesundiscountedon outstanding claims 110,304 50,022 60,282 94,902 38,763 56,139Discount to present value (44,539) (15,526) (29,013) (39,214) (13,712) (25,502)Discounted expected futurerecoveries on outstandingclaims 65,765 34,496 31,269 55,688 25,051 30,637Allowance for impairment loss –Reinsurance Receivables (20) - (20) (189) - (189)Allowance for impairment loss –Reinsurance Recoveries (167) (167) - (318) (318) -Total allowance forimpairment loss (187) (167) (20) (507) (318) (189)Reinsurance and otherrecoveries receivable 70,849 39,600 31,249 62,482 29,791 32,691Current 23,138 21,686 1,452 17,439 13,719 3,720Non-current 47,711 17,914 29,797 45,043 16,072 28,971Reinsurance and otherrecoveries receivable 70,849 39,600 31,249 62,482 29,791 32,691Average inflation rates (normal) and discount rates that were used in the measurementof reinsurance and other recoveries receivable were the same as for outstanding claimsas per note 3.The table below provides a reconciliation of the allowances for impairmentlosses as at 30 June <strong>2011</strong>.<strong>2011</strong> 2010<strong>TIO</strong><strong>TIO</strong>Insurance& BankingMACFund<strong>TIO</strong><strong>TIO</strong>Insurance& BankingMACFund$,000 $,000 $,000 $,000 $,000 $,000Opening balance as at1 July (507) (318) (189) (610) (555) (55)Reinsurance recoveries on paidclaims written off - - - - - -(Increase)/Decrease in theallowance for the year charged tothe statement of comprehensiveincome320 151 169 103 237 (134)Closing balance asat 30 June (187) (167) (20) (507) (318) (189)<strong>TIO</strong> <strong>Annual</strong> <strong>Report</strong> 2010/<strong>2011</strong> 81
Territory Insurance OfficeNotes to the Financial Statements30 June <strong>2011</strong>18. Deferred acquisition and reinsurance costsDeferred acquisitioncosts<strong>2011</strong> 2010<strong>TIO</strong><strong>TIO</strong>Insurance& Banking MAC Fund <strong>TIO</strong><strong>TIO</strong>Insurance& Banking MAC Fund$’000 $’000 $’000 $’000 $’000 $’000Deferred acquisition costsas at 1 July 4,804 4,559 245 2,373 2,145 228Acquisition costs deferred 5,790 5,492 298 7,575 6,876 699Amortisation charged to statementof comprehensive income 1 (6,305) (5,932) (373) (5,144) (4,462) (682)Deferred acquisition costsas at 30 June 4,289 4,119 170 4,804 4,559 2451. 2010 was subject to a write back as a result of a deficiency from 2009.Deferredreinsuranceexpense<strong>2011</strong> 2010<strong>TIO</strong><strong>TIO</strong>Insurance& Banking MAC Fund <strong>TIO</strong><strong>TIO</strong>Insurance& Banking MAC Fund$’000 $’000 $’000 $’000 $’000 $’000Deferred reinsurance expenseas at 1 July 27,344 27,344 - 24,661 24,661 -Reinsurance expenses deferred 38,372 31,904 6,468 47,733 40,104 7,629Amortisation charged tostatement of comprehensiveincome (46,012) (39,544) (6,468) (45,050) (37,421) (7,629)Deferred reinsurance expenseas at 30 June 19,704 19,704 - 27,344 27,344 -19. Outstanding claims liabilitya) Outstanding claims liability<strong>2011</strong> 2010<strong>TIO</strong><strong>TIO</strong>Insurance& Banking MAC Fund <strong>TIO</strong><strong>TIO</strong>Insurance& Banking MAC Fund$’000 $’000 $’000 $’000 $’000 $’000Central estimate undiscounted 593,238 151,833 441,405 571,105 144,412 426,693Claims handling costs undiscounted 43,144 10,203 32,941 40,389 8,546 31,843Risk margin undiscounted 81,117 19,030 62,087 78,381 18,364 60,017Gross claims incurredundiscounted 717,499 181,066 536,433 689,875 171,322 518,553Discount to present value (306,342) (42,599) (263,743) (291,007) (40,569) (250,438)Gross outstanding claims liability 411,157 138,467 272,690 398,868 130,753 268,115Central estimate discounted 340,375 115,992 224,383 330,746 110,127 220,619Current 81,700 47,904 33,796 71,628 40,106 31,522Non-current 329,457 90,563 238,894 327,240 90,647 236,593Gross outstanding claims liability 411,157 138,467 272,690 398,868 130,753 268,115<strong>TIO</strong> <strong>Annual</strong> <strong>Report</strong> 2010/<strong>2011</strong> 82
Territory Insurance OfficeNotes to the Financial Statements30 June <strong>2011</strong>b) Risk marginProcess for determining risk marginThe overall risk margin was determined allowing for diversification between differentportfolios and the relative uncertainty of the outstanding claims estimate for eachportfolio. Uncertainty was analysed for each portfolio taking into account potentialuncertainties relating to the actuarial models and assumptions, the quality of theunderlying data used in the models, the general insurance environment, and thepotential impact of future legislative reform.The assumptions regarding uncertainty for each class were applied to the net centralestimates, and the results were aggregated, allowing for diversification in order to arriveat an overall provision which is intended to have a 75% probability of adequacy.Risk margins appliedClass of business <strong>2011</strong> 2010% %<strong>TIO</strong> Insurance & Banking 11.620 11.929MAC Fund 13.089 13.089c) Reconciliation of movement in discounted outstanding claimsliability<strong>TIO</strong><strong>2011</strong> 2010Gross Reinsurance Net Gross Reinsurance Net$’000 $’000 $’000 $’000 $’000 $’000Brought forward 398,868 (55,689) 343,179 370,858 (50,720) 320,138Effect of changes in assumptions 16,712 (3,331) 13,381 37,912 (18,976) 18,936Increase in claimsincurred/recoveries anticipatedover the year 111,295 (30,093) 81,202 93,073 (7,227) 85,846Incurred claims recognised inthe statement ofcomprehensive income 128,008 (33,424) 94,583 130,985 (26,203) 104,782Net claim payments (115,718) 23,347 (92,371) (102,975) 21,234 (81,741)At 30 June 411,157 (65,766) 345,391 398,868 (55,689) 343,179<strong>TIO</strong> (Insurance &Banking)<strong>2011</strong> 2010Gross Reinsurance Net Gross Reinsurance Net$’000 $’000 $’000 $’000 $’000 $’000Brought forward 130,753 (25,052) 105,701 114,439 (21,005) 93,434Effect of changes in assumptions 10,663 (3,353) 7,310 14,704 (3,074) 11,630Increase in claimsincurred/recoveries anticipatedover the year 71,667 (25,806) 45,861 61,384 (12,205) 49,179Incurred claims recognised inthe statement ofcomprehensive income 82,330 (29,159) 53,171 76,088 (15,279) 60,809Net claim payments (74,616) 19,714 (54,902) (59,774) 11,232 (48,542)At 30 June 138,467 (34,497) 103,970 130,753 (25,052) 105,701<strong>TIO</strong> <strong>Annual</strong> <strong>Report</strong> 2010/<strong>2011</strong> 83
Territory Insurance OfficeNotes to the Financial Statements30 June <strong>2011</strong>MAC Fund<strong>2011</strong> 2010Gross Reinsurance Net Gross Reinsurance Net$’000 $’000 $’000 $’000 $’000 $’000Brought forward 268,115 (30,637) 237,478 256,419 (29,715) 226,704Effect of changes in assumptions 6,049 22 6,071 23,208 (15,902) 7,306Increase in claimsincurred/recoveries anticipatedover the year 39,628 (4,287) 35,341 31,689 4,978 36,667Incurred claims recognised inthe statement ofcomprehensive income 45,677 (2,265) 41,412 54,897 (10,924) 43,973Net claim payments (41,102) 3,633 (37,469) (43,201) 10,002 (33,199)At 30 June 272,690 (31,269) 241,421 268,115 (30,637) 237,478d) Claims development tablesThe following tables show the development of gross and net undiscountedoutstanding claims relative to the ultimate expected claims for the nine most recentaccident years.<strong>TIO</strong> <strong>Annual</strong> <strong>Report</strong> 2010/<strong>2011</strong> 84
Territory Insurance OfficeNotes to the Financial Statements30 June <strong>2011</strong>(i) <strong>TIO</strong> (Insurance & Banking) - gross2002 2003 2004 2005 2006 2007 2008 2009 2010 <strong>2011</strong> TotalAccident year $’000 $’000 $’000 $’000 $’000 $’000 $’000 $’000 $’000 $’000 $’000Estimate of ultimate claimscost:At end of the accident year 15,759 16,449 18,321 17,522 18,392 22,127 29,248 25,173 26,265 17,608 206,864One year later 17,048 18,150 19,439 15,128 16,355 21,525 33,780 27,151 25,510 194,086Two years later 17,882 18,647 17,467 12,466 17,846 22,954 42,148 25,574 174,984Three years later 16,558 18,637 16,082 12,714 19,601 23,939 43,282 150,813Four years later 16,562 17,631 16,292 12,066 21,632 26,254 110,437Five years later 14,238 19,531 16,496 12,051 23,582 85,898Six years later 14,185 18,204 17,660 12,391 62,440Seven years later 14,208 20,306 19,607 54,121Eight years later 13,528 20,289 33,817Nine years later 14,053 14,053Current estimate ofcumulative claims costs 14,053 20,289 19,607 12,391 23,582 26,254 43,282 25,574 25,510 17,608 228,150Cumulative payments (11,647) (14,490) (14,359) (9,206) (16,355) (14,693) (16,455) (13,152) (9,392) (2,880) (122,629)Outstanding claims -undiscounted 2,406 5,799 5,248 3,185 7,227 11,561 26,827 12,422 16,118 14,728 105,521Discount (797) (1,943) (1,819) (1,087) (1,875) (3,681) (11,258) (2,263) (2,930) (2,759) (30,412)Claims handling expenses 109 260 236 142 362 534 1,060 699 931 847 5,180Total gross outstanding claims2002-<strong>2011</strong> 1,718 4,116 3,665 2,240 5,714 8,414 16,629 10,858 14,119 12,816 80,2892001 and prior 17,090Total outstanding claimscentral estimate 97,379Risk margin 14,294Total long tail outstandingClaims 111,673Other short tail outstandingclaims 24,037Other recoveries 2,757Total Insurance grossoutstanding claims 138,467<strong>TIO</strong> <strong>Annual</strong> <strong>Report</strong> 2010/<strong>2011</strong> 85
Territory Insurance OfficeNotes to the Financial Statements30 June <strong>2011</strong>(ii) <strong>TIO</strong> (Insurance & Banking) - net2002 2003 2004 2005 2006 2007 2008 2009 2010 <strong>2011</strong> TotalAccident year $’000 $’000 $’000 $’000 $’000 $’000 $’000 $’000 $’000 $’000 $’000Estimate of ultimate claimscost:At end of the accident year 15,541 16,090 17,946 17,082 17,967 18,932 20,871 24,852 26,158 17,494 192,933One year later 16,877 17,875 19,432 15,128 16,355 18,909 26,105 27,151 24,882 182,714Two years later 17,708 18,386 17,460 12,466 17,846 20,543 28,905 25,574 158,888Three years later 16,468 18,474 16,075 12,714 19,601 21,436 28,792 133,560Four years later 16,493 17,631 16,285 12,066 21,557 22,832 106,864Five years later 14,181 17,454 16,489 11,082 23,477 82,683Six years later 14,139 16,529 17,346 11,599 59,613Seven years later 14,085 18,627 19,235 51,947Eight years later 13,528 18,225 31,753Nine years later 14,743 14,743Current estimate ofcumulative claims costs 14,743 18,225 19,235 11,599 23,477 22,832 28,792 25,574 24,882 17,494 206,853Cumulative payments (11,647) (13,936) (14,353) (9,206) (16,355) (14,693) (16,364) (13,152) (9,392) (2,880) (121,978)Outstanding claims -undiscounted 3,096 4,289 4,882 2,393 7,122 8,139 12,428 12,422 15,490 14,614 84,875Discount (1,487) (1,308) (1,667) (759) (1,837) (2,320) (2,555) (2,263) (2,735) (2,742) (19,673)Claims handling expenses 109 260 236 142 362 534 1,060 699 931 847 5,180Total gross outstanding claims2002-<strong>2011</strong> 1,718 3,241 3,451 1,776 5,647 6,353 10,933 10,858 13,686 12,719 70,3822001 and prior outstanding claims 12,514Total gross outstanding claimscentral estimate 82,896Risk margin 14,182Total long tail outstandingClaims 97,078Other short tail outstandingclaims 6,892Total Insurance grossoutstanding claims 103,971<strong>TIO</strong> <strong>Annual</strong> <strong>Report</strong> 2010/<strong>2011</strong> 86
Territory Insurance OfficeNotes to the Financial Statements30 June <strong>2011</strong>(iii) MAC Fund - gross2002 2003 2004 2005 2006 2007 2008 2009 2010 <strong>2011</strong> TotalAccident year $’000 $’000 $’000 $’000 $’000 $’000 $’000 $’000 $’000 $’000 $’000Estimate of ultimate claimscost:At end of the accident year 32,702 29,938 40,098 40,730 50,710 51,839 50,778 44,114 51,285 47,030 439,224One year later 31,448 40,861 38,434 56,104 45,406 45,623 57,290 44,738 43,481 403,385Two years later 28,627 33,462 37,046 49,490 37,334 44,859 53,073 49,057 332,948Three years later 29,001 35,020 33,585 41,034 35,856 40,484 52,449 267,429Four years later 34,237 36,433 32,288 43,715 31,734 36,856 215,263Five years later 35,309 35,942 34,060 45,917 26,175 177,403Six years later 32,946 36,199 37,320 49,595 156,060Seven years later 29,816 39,879 33,179 102,874Eight years later 31,265 42,319 73,584Nine years later 30,019 30,019Current estimate ofcumulative claims costs 30,019 42,319 33,179 49,595 26,175 36,856 52,449 49,057 43,481 47,030 410,160Cumulative payments (15,863) (21,991) (13,588) (22,782) (17,604) (18,467) (15,185) (13,463) (11,337) (7,869) (158,149)Outstanding claims -undiscounted 14,156 20,328 19,591 26,813 8,571 18,389 37,264 35,594 32,144 39,161 252,011Discount (7,817) (10,991) (7,074) (14,436) (3,541) (9,004) (18,092) (15,613) (14,309) (15,207) (116,084)Claims handling expenses 475 700 939 928 377 704 1,438 1,499 1,338 1,796 10,194Total gross outstanding claims2002-<strong>2011</strong> 6,814 10,037 13,456 13,305 5,407 10,089 20,610 21,480 19,173 25,750 146,1212001 and prior outstanding claims 93,893Other recoveries 1,116Total gross outstanding claimscentral estimate 241,130Risk margin 31,561Total MAC Fund grossoutstanding claims 272,691<strong>TIO</strong> <strong>Annual</strong> <strong>Report</strong> 2010/<strong>2011</strong> 87
Territory Insurance OfficeNotes to the Financial Statements30 June <strong>2011</strong>(iv) MAC Fund - net2002 2003 2004 2005 2006 2007 2008 2009 2010 <strong>2011</strong> TotalAccident year $’000 $’000 $’000 $’000 $’000 $’000 $’000 $’000 $’000 $’000 $’000Estimate of ultimate claimscost:At end of the accident year 31,856 26,189 37,098 38,580 46,062 47,284 47,908 41,816 50,110 45,364 412,267One year later 31,142 32,281 32,974 55,728 45,018 43,274 51,657 43,489 42,089 377,652Two years later 28,537 29,231 33,032 49,490 32,624 41,202 46,124 49,057 309,297Three years later 27,741 30,789 29,053 41,034 32,542 38,506 45,645 245,310Four years later 29,864 32,202 29,042 43,449 27,756 33,196 195,509Five years later 30,618 31,711 27,993 42,346 22,197 154,865Six years later 28,394 31,968 29,417 44,476 134,255Seven years later 27,651 35,648 27,232 90,531Eight years later 28,529 38,088 66,617Nine years later 28,676 28,676Current estimate ofcumulative claims costs 28,676 38,088 27,232 44,476 22,197 33,196 45,645 49,057 42,089 45,364 376,020Cumulative payments (15,863) (17,760) (13,588) (22,782) (13,626) (18,467) (15,185) (13,463) (11,337) (7,869) (149,940)Outstanding claims -undiscounted 12,813 20,328 13,644 21,694 8,571 14,729 30,460 35,594 30,752 37,495 226,080Discount (7,106) (10,991) (5,508) (11,720) (3,541) (7,198) (14,760) (15,613) (13,682) (14,553) (104,672)Claims handling expenses 475 700 939 928 377 704 1,438 1,499 1,338 1,796 10,194Total gross outstanding claims2002-<strong>2011</strong> 6,182 10,037 9,075 10,902 5,407 8,235 17,138 21,480 18,408 24,738 131,6022001 and prior outstanding claims 81,881Other recoveries -Total gross outstanding claimscentral estimate 213,483Risk margin 27,939Total MAC Fund netoutstanding claims 241,422<strong>TIO</strong> <strong>Annual</strong> <strong>Report</strong> 2010/<strong>2011</strong> 88
Territory Insurance OfficeNotes to the Financial Statements30 June <strong>2011</strong>e) The maturity profile of <strong>TIO</strong>’s discounted net outstanding claimsprovision is analysed below.1 year or less> 1 year and< 5 years > 5 years Total30 June <strong>2011</strong> $’000 $’000 $’000 $’000Direct Insurance 31,177 44,913 27,234 103,324Inwards Reinsurance 145 311 191 647Total Insurance 31,322 45,224 27,425 103,971MAC Fund 32,325 74,455 134,642 241,422Total discounted net outstandingclaims 63,647 119,679 162,067 345,3931 year or less> 1 year and< 5 years > 5 years Total30 June 2010 $’000 $’000 $’000 $’000Direct Insurance 30,982 46,753 27,306 105,041Inwards Reinsurance 145 326 191 662Total Insurance 31,127 47,079 27,497 105,703MAC Fund 29,854 74,865 132,758 237,477Total discounted net outstandingclaims 60,981 121,944 160,255 343,18020. Unearned premium liability<strong>2011</strong> 2010<strong>TIO</strong><strong>TIO</strong>Insurance& Banking MAC Fund <strong>TIO</strong><strong>TIO</strong>Insurance& Banking MAC Fund$’000 $’000 $’000 $’000 $’000 $’000Unearned premium liabilityas at 1 July 82,921 58,472 24,449 75,741 52,986 22,755Deferral of premiums on contractswritten in the period 88,212 62,023 26,189 82,921 58,472 24,449Earning of premiums written inprevious periods (82,921) (58,472) (24,449) (75,741) (52,986) (22,755)Unearned premium liabilityas at 30 June 88,212 62,023 26,189 82,921 58,472 24,449The liability adequacy test has identified a surplus for all contracts that are subject tobroadly similar risks and are managed together as a single portfolio. As there is nodeficiency in the unexpired risk liability as at the reporting date, no write down ofdeferred acquisition costs is required (2010:nil).<strong>TIO</strong> <strong>Annual</strong> <strong>Report</strong> 2010/<strong>2011</strong> 89
Premium Liability and Liability Adequacy TestTerritory Insurance OfficeNotes to the Financial Statements30 June <strong>2011</strong><strong>2011</strong> 2010<strong>TIO</strong><strong>TIO</strong>Insurance& BankingMACFund <strong>TIO</strong><strong>TIO</strong>Insurance& BankingMACFund$’000 $’000 $’000 $’000 $’000 $’000Central estimate of present value of expectedfuture cash flows from future claims.69,803 52,242 17,561 52,827 37,323 15,504Central estimate of present value of expectedfuture cash inflows arising from reinsurance (25,015) (23,925) (1,090) (13,870) (13,405) (465)recoveries on future claimsRisk margin 6,679 3,760 2,919 7,782 4,830 2,952Net premium liabilities 51,467 32,077 19,390 46,739 28,748 17,991Risk margin percentage 14.91% 13.28% 17.72% 19.98% 20.19% 19.63%Probability of adequacy 75% 75% 75% 75% 75% 75%The liability adequacy test (LAT) assesses whether the net unearned premium liabilityless any related intangible assets and deferred acquisition costs is sufficient to coverfuture claims costs for in-force policies. Future claims costs are calculated as the presentvalue of the expected cash flows relating to future claims, and includes a risk margin toreflect the inherent uncertainty in the central estimate for each portfolio of contracts,being MAC, Insurance Long Tail and Insurance Short Tail. The test is based onprospective information and is heavily dependent on assumptions and judgements.The LAT as at 30 June <strong>2011</strong> and 2010 resulted in a surplus for all portfolios. Thissurplus arose because the present value of the expected future claims was less than theunearned premium liability less the deferred acquisition costs and related reinsuranceassets.The prudential margin for MACS has been determined with reference to that adopted forthe outstanding claims estimate, increased by 50% to reflect the higher level ofuncertainty surrounding the estimates of claims costs related to claims which have notyet occurred compared to those which have already occurred. The prudential margindetermined in the manner described only applies to claims cost and the claims handlingexpense component and has not been applied to the policy administration expensecomponent.<strong>TIO</strong> <strong>Annual</strong> <strong>Report</strong> 2010/<strong>2011</strong> 90
Territory Insurance OfficeNotes to the Financial Statements30 June <strong>2011</strong>The prudential margin for Insurance has been determined based on selected Coefficientof Variation (CoV) for each class of business. The prudential margin determined in themanner described above only applies to claims costs and the claims handling expensecomponent and has not been applied to the policy administration expense component.The premium liabilities risk margin for Insurance incorporates diversification benefitsseparately, based on the same correlation assumptions as for outstanding claims.For both Insurance and MACS the prudential margin applied to the policy administrationexpense component of premium liabilities has been determined using a risk margin of5%. This reflects a lower uncertainty level associated with these expenses because theyare incurred over the remaining policy period, being the next 12 months.The risk margin adopted for both Insurance and MACS was determined to give aprobability of adequacy of 75% which is consistent with the probability of adequacyadopted in the determination of outstanding claims liability.The risk margin adopted for MACS has been determined excluding any diversificationbenefit and for Insurance including a component for diversification benefit.21. Net claims incurredThe following tables show the impact on current year results of over or under estimationof claims provisions relating to prior years. Current year claims relate to risks borne inthe current reporting period whilst prior year’s claims relate to a reassessment of therisks borne in all previous reporting years.<strong>TIO</strong> (Insurance &Banking)<strong>2011</strong> 2010Current PriorCurrent PriorYear Years Total Year Years Total$’000 $’000 $’000 $’000 $’000 $’000Direct businessGross claims incurred – undiscounted71,005 9,167 80,171 67,771 21,247 89,018Discount movement ,(3,282) 1,252 (2,029) (4,670) (6,072) (10,742)Gross claims incurred – discounted 67,723 10,419 78,142 63,101 15,175 78,276Reinsurance and other recoveries- undiscounted (7,046) (19,789) (26,835) (12,527) (11,264) (23,790)Discount movement19 1,796 1,815 26 8,484 8,511Reinsurance and other recoveries- discounted(7,027) (17,993) (25,021) (12,501) (2,780) (15,279)Net claims incurred60,696 (7,574) 53,121 50,600 12,395 62,997<strong>TIO</strong> <strong>Annual</strong> <strong>Report</strong> 2010/<strong>2011</strong> 91
Territory Insurance OfficeNotes to the Financial Statements30 June <strong>2011</strong>MAC FundCurrentYear<strong>2011</strong> 2010PriorYearsCurrentYearPriorYearsTotalTotal$’000 $’000 $’000 $’000 $’000 $’000Direct businessGross claims incurred– undiscounted 56,239 1,107 57,345 60,911 4,205 65,115Discount movement (18,500) 5,196 (13,305) (22,396) 12,178 (10,218)Gross claims incurred – discounted 37,739 6,303 44,040 38,515 16,383 54,897Reinsurance and other recoveries- undiscounted (2,237) (3,902) (6,139) (1,730) (11,407) (13,137)Discount movement752 2,759 3,511 494 1,720 2,213Reinsurance and other recoveries- discounted(1,485) (1,143) (2,628) (1,236) (9,687) (10,924)Net claims incurred 36,254 5,160 41,412 37,279 6,696 43,973<strong>TIO</strong><strong>2011</strong> 2010CurrentYearPriorYears TotalCurrentYearPriorYears Total$’000 $’000 $’000 $’000 $’000 $’000Direct businessGross claims incurred– undiscounted 127,244 10,274 137,516 128,682 25,452 154,133Discount movement (21,782) 6,448 (15,334) (27,066) 6,106 (20,960)Gross claims incurred – discounted 105,462 16,722 120,182 101,616 31,558 133,173Reinsurance and other recoveries- undiscounted (9,283) (23691) (32,975) (14,257) (22,671) (36,927)Discount movement771 4,555 5,326 520 10,204 10,724Reinsurance and other recoveries- discounted(8,512) (19,136) (27,649) (13,737) (12,467) (26,203)Net claims incurred 96,950 (2,414) 94,533 87,879 19,091 106,970<strong>TIO</strong> <strong>Annual</strong> <strong>Report</strong> 2010/<strong>2011</strong> 92
Territory Insurance OfficeNotes to the Financial Statements30 June <strong>2011</strong>CurrentYear<strong>2011</strong> 2010PriorYearsTotalCurrentYearPriorYearsTotal$’000 $’000 $’000 $’000 $’000 $’000Inwards ReinsuranceBusinessGross claims incurred– undiscounted - 50 50 - (2,607) (2,607)Discount movement - (1) (1) - 419 419Gross claims incurred – discounted - 49 49 - (2,188) (2,188)Reinsurance and other recoveries- undiscounted- - - - - -Discount movement- - - - - -Reinsurance and other recoveries- discounted- - - - - -Net claims incurred - 49 49 - (2,188) (2,188)Total net claims incurred for directand inwards reinsurance business96,950 (2,365) 94,582 87,879 16,903 104,782Total gross claims incurred for direct andinwards reinsurance business 105,462 16,771 122,231 101,616 29,370 130,985Total reinsurance and other recoveries (8,512) (19,136) (27,649) (13,737) (12,467) (26,203)Total net claims incurred for directand inwards reinsurance business 96,950 (2,365) 94,582 87,879 16,903 104,78222. Trade and other payables<strong>2011</strong> 2010<strong>TIO</strong><strong>TIO</strong>Insurance &BankingMACFund <strong>TIO</strong><strong>TIO</strong>Insurance &BankingMACFund$’000 $’000 $’000 $’000 $’000 $’000Trade payables 20,543 19,308 1,235 17,653 17,224 429Reinsurance payables 8,116 6,749 1,368 21,003 18,932 2,071Related party payable - 1,299 - - 1,027 -Other 426 407 19 398 386 1229,085 27,763 2,622 39,054 37,569 2,512<strong>TIO</strong> <strong>Annual</strong> <strong>Report</strong> 2010/<strong>2011</strong> 93
23. DepositsTerritory Insurance OfficeNotes to the Financial Statements30 June <strong>2011</strong><strong>2011</strong> 2010<strong>TIO</strong><strong>TIO</strong>Insurance& Banking MAC Fund <strong>TIO</strong><strong>TIO</strong>Insurance &BankingMACFund$’000 $’000 $’000 $’000 $’000 $’000-Deposits - current liabilities 497,688 497,688 - 531,309 531,309Deposits - non-current liabilities - - - - - -Total Deposits 497,688 497,688 - 531,309 531,309Deposits maturity analysisAt call 97,514 97,514 - 109,466 109,466 -No longer than three months 221,591 221,591 - 250,784 250,784 -Longer than three and not longerthan 12 months 142,365 142,365 - 114,738 114,738 -Longer than one and not longer thanfive years 36,218 36,218 - 56,321 56,321 -497,688 497,688 - 531,309 531,309 -Concentration of deposits<strong>2011</strong> 2010<strong>TIO</strong><strong>TIO</strong>Insurance& Banking MAC Fund <strong>TIO</strong><strong>TIO</strong>Insurance &BankingMACFund$’000 $’000 $’000 $’000 $’000 $’000Northern Territory residents 299,433 299,433 - 393,329 393,329 -Non-Northern Territory residents 198,255 198,255 - 137,980 137,980 -497,688 497,688 - 531,309 531,309 -24. Provisions<strong>2011</strong> 2010<strong>TIO</strong><strong>TIO</strong>Insurance &BankingMACFund <strong>TIO</strong><strong>TIO</strong>Insurance &BankingMACFund$’000 $’000 $’000 $’000 $’000 $’000(a) Current provisionsEmployee benefits 4,092 4,092 - 4,742 4,742 -Other provisions - - - - - -4,092 4,092 - 4,742 4,742 -(b) Non-current provisionsEmployee benefits 792 792 - 649 649 -Total provisions 4,884 4,884 - 5,391 5,391 -<strong>TIO</strong> <strong>Annual</strong> <strong>Report</strong> 2010/<strong>2011</strong> 94
25. Securitisation liabilitiesTerritory Insurance OfficeNotes to the Financial Statements30 June <strong>2011</strong><strong>2011</strong> 2010<strong>TIO</strong><strong>TIO</strong>Insurance& BankingMACFund <strong>TIO</strong><strong>TIO</strong>Insurance& BankingMACFund$’000 $’000 $’000 $’000 $’000 $’000Current 1,333 1,333 - 1,562 1,562 -Non Current 64,640 64,640 - 83,948 83,948 -Securitisation Liabilities 65,973 65,973 - 85,510 85,510 -Securitisation liabilitiesmaturity analysisNot longer than three months 100 100 - 396 396 -Longer than three months and notlonger than 12 months 1,233 1,233 - 1,169 1,169 -Longer than one year and notlonger than five years 5,975 5,975 - 7,328 7,328 -Longer than five years 58,665 58,665 - 76,617 76,617 -No maturity specified - - - - - -26. Subordinated loans65,973 65,973 - 85,510 85,510 -The MAC Fund has a subordinated loan agreement with the Northern TerritoryGovernment which has a maturity date of June 2013. The loan was subordinated to alloutstanding claims liabilities and other liability commitments directly attributable to theMAC Scheme. <strong>TIO</strong> has the ability to redraw any repayments with the approval of theMinister if required to improve the solvency levels of MAC Fund, prior to the maturitydate of the loan. The loan was undrawn as at 30 June <strong>2011</strong>.27. Equity and ReservesContributed equityContributed equity represents equity contributed by the Northern Territory Government.This totals $39 million as at 30 June <strong>2011</strong>.Nature and purpose of reservesAsset revaluation reserveThe asset revaluation reserve is used to record the increments and decrements in thefair value of the owner-occupied land and building net of tax, to the extent that suchdecrements relate to a net increment on the same asset previously recognised as equity.Hedging ReserveThe hedging reserve represents hedging gains and losses recognised on the effectiveportion of cash flow hedges. The cumulative deferred gain or loss on the hedge isrecognised in profit or loss when the hedged transaction impacts the profit or loss,consistent with the applicable accounting policy.<strong>TIO</strong> <strong>Annual</strong> <strong>Report</strong> 2010/<strong>2011</strong> 95
Territory Insurance OfficeNotes to the Financial Statements30 June <strong>2011</strong>28. Board member and executive disclosuresThe following disclosures are for the <strong>TIO</strong> Board and <strong>TIO</strong> key management personnel.Details of key management personnel(a) Board membersB J Carter appointed Chairperson 1 st April <strong>2011</strong>P J Caldwell retired 31 st January <strong>2011</strong>, reappointed 1 st May <strong>2011</strong>R A Davis unchangedJ H Davison appointed 1 st October 2010D L Fincham retired 31 st July 2010J G Flynn AM retired 31 st March <strong>2011</strong>J F Hand appointed Deputy Chairperson 1 st April <strong>2011</strong>J I Messenger retired 31 st January <strong>2011</strong>J Schafer appointed 1 st October 2010P C W Tyrrell AO appointed 1 st May <strong>2011</strong>G Venardos appointed 1 st October 2010(b) Executive management membersName Position From ToRichard Harding Chief Executive Officer 14 July 2008 currentJeff Wright General Manager Corporate Services 17 January <strong>2011</strong> currentMichael HoareGeneral Manager Corporate Services,Chief Financial Officer24 June 2002 17 January <strong>2011</strong>Michael Hoare General Manager Insurance * 17 January <strong>2011</strong> currentIan Faragher General Manager MAC Fund 17 May 2010 2 August 2010Ian Faragher General Manager Insurance 2 August 2010 17 January <strong>2011</strong>Peter Atkinson General Manager Insurance 31 March 2008 30 July 2010Paul JamesonGeneral Manager MAC Fund & WorkersCompensation *9 August 2010 currentMichelle Garnaut General Manager People and Culture 10 December 2008 15 July <strong>2011</strong>Amanda-Lea Smith Acting General Manager People and Culture 19 January <strong>2011</strong> currentGraham Marshall General Manager Banking and Distribution 10 December 2008 3 June <strong>2011</strong>Will Oliver General Counsel 10 December 2008 current* Workers compensation claims transferred from Michael Hoare to Paul Jameson on the 13 May <strong>2011</strong>The key management personnel held their positions for the entire financial year unlessotherwise stated.Compensation of key management personnel<strong>2011</strong> 2010$’000 $’000Short term benefits 2,580 2,408Post employment benefits 248 266Other long-term benefits 6 5Termination benefits 187 43,021 2,683<strong>TIO</strong> <strong>Annual</strong> <strong>Report</strong> 2010/<strong>2011</strong> 96
Loans to key management personnelTerritory Insurance OfficeNotes to the Financial Statements30 June <strong>2011</strong>The following loan balances are in respect of loans made to key managementpersonnel of <strong>TIO</strong> or to their related parties.Balance atbeginning of period$’000InterestCharged$’000Write-offBalance at endof the period$’000Number inGroupYear$’000<strong>2011</strong> 1,075 64 - 1,101 42010 1,420 58 - 1,375 10<strong>TIO</strong> makes loans to key management personnel and related parties in its capacity as aprovider of financial services. These loans are made on commercial terms andconditions no more favourable than those made on similar loans to other employees orcustomers. These loans are predominantly secured home loans with some minorunsecured <strong>TIO</strong> credit card advances.Other transactions and balances with key management personnel<strong>TIO</strong> sells insurance policies, pays insurance claims, makes loans to and accepts depositsfrom key management personnel and their related parties in its capacity as a provider ofinsurance and banking services. These transactions are entered into on commercialterms and conditions no more favourable than those made on similar transactions toother employees or customers and are trivial or domestic in nature<strong>TIO</strong> superannuation schemeThe <strong>TIO</strong> staff superannuation operates a defined contribution plan through a MasterTrust under the Colonial First State First Choice Superannuation Plan. Under the plan,<strong>TIO</strong> makes contributions on behalf of Board members and employees which are chargedas an expense as they fall due. The amount of contributions recognised in the statementof comprehensive income for the year ended 30 June <strong>2011</strong> is $2.04 million (2010:$1.86m).29. Remuneration of auditorsThe auditor of <strong>TIO</strong> is the Auditor-General for the Northern Territory.Amounts paid, or due and payable to the NT Government for services provided by theNorthern Territory Auditor-General for:° Audit of <strong>TIO</strong> financial statements° Other services in relation to <strong>TIO</strong>- assurance related- special audits required by regulators<strong>2011</strong> 2010$ $406,211 327,664-106,1052,508111,028512,316 441,200<strong>TIO</strong> <strong>Annual</strong> <strong>Report</strong> 2010/<strong>2011</strong> 97
30. Related party disclosureTerritory Insurance OfficeNotes to the Financial Statements30 June <strong>2011</strong>The Northern Territory Government is the ultimate parent entity of <strong>TIO</strong>. Companiesand/or agencies that have the Northern Territory Government as a common parent areconsidered related parties to <strong>TIO</strong>.The following is a list of transactions that <strong>TIO</strong> enters into with related parties at marketprice and on normal commercial terms.IncomeRelated PartyWorkers CompensationFeeHome BuildersCertification FeeDepartment of HousingAdministration FeeMotor Vehicle RegistryExpensesRelated PartyPowerWaterReceiver of TerritoryMoniesNT Chamber ofCommerceMotor Vehicle RegistryDetailsManagement fee from NT Government for workerscompensationManagement fee for the administration of Home BuildersCertification FundFees from Department of Housing for the administration ofthe Homestart SchemeGross earned premiums collected from motor vehicleregistrations to fund the MAC SchemeDetailsElectricity transactionsMETAL funding, Road safety funding and DTAL reimbursementMembership and various transactionsGross commission paid for the collection of premiums relatingto the MAC SchemeOutstanding balances at year end are unsecured, interest free and settlement occurs incash.For the year ended 30 June <strong>2011</strong>, <strong>TIO</strong> has not made any allowance for doubtful debtsrelating to amounts owed by related parties as the payment history does not warrant anallowance (2010: $nil).Pursuant to the <strong>TIO</strong> Act, <strong>TIO</strong> administers the MAC Fund in accordance with the MotorAccidents (Compensation) Act. <strong>TIO</strong> provides key management personnel, systems andall administration functions to operate the MAC Scheme pursuant to a Service LevelAgreement.<strong>TIO</strong> <strong>Annual</strong> <strong>Report</strong> 2010/<strong>2011</strong> 98
Territory Insurance OfficeNotes to the Financial Statements30 June <strong>2011</strong>31. Reconciliation of net profit tonet cash inflow from operating activities<strong>2011</strong> 2010<strong>TIO</strong><strong>TIO</strong>Insurance& BankingMACFund <strong>TIO</strong><strong>TIO</strong>Insurance& BankingMACFund$’000 $’000 $’000 $’000 $’000 $’000Net Profit 51,987 7,720 44,267 35,456 3,290 32,166Depreciation and amortisationexpense 2,471 1,610 861 4,183 1,372 2,811Provision for impairment (692) (522) (170) (216) (350) 134Changes in net market value ofinvestments (4,486) (1,348) (3,138) (17,346) (5,647) (11,699)Profit on Sale of InvestmentSecurities (8,665) (3,081) (5,584) (4,081) (1,224) (2,857)Selling Expenses charged directly toprofit on sale of investmentproperties - - - (137) (137) -Loss on sale of non-current assets (33) (33) - 488 488 -Changes in operating assets andliabilities:(Increase)/Decrease in receivables (1,167) (578) (589) (6,046) (6,080) 34(Increase)/Decrease in reinsuranceand other recoveries receivable (8,047) (9,658) 1,611 (8,191) (5,082) (3,109)(Increase)/Decrease in deferredacquisition costs 514 440 74 (2,431) (2,414) (17)Increase/(Decrease) in outstandingclaims 12,291 7,714 4,577 28,009 16,315 11,694Increase/(Decrease) in derivatives (43) (43) - 418 418 -(Increase)/Decrease in net deferredbroker charges (29) (29) - (34) (34) -(Increase)/Decrease in leaseincentives - - - 34 34 -Increase/(Decrease) in unearnedpremiums 5,291 3,551 1,740 7,181 5,486 1,694Increase/(Decrease) in payables (3,659) (3,423) (236) (486) 1,372 (1,858)Increase/(Decrease) in employeebenefits and other liabilities (507) (507) - 922 922 -Increase/(Decrease) in provision forincome tax payable 1,585 1,585 - 1,389 1,389 -Increase/(Decrease) in deferred taxliabilities (356) (356) - 57 57 -(Increase)/Decrease in deferred taxassets 1,883 1,883 - 1,186 1,186 -Increase/(Decrease) in GST payable 565 491 74 (164) 99 (262)Increase/(Decrease) in fixed raterepricing adjustment 48 48 - 106 106 -Net cash inflow from operatingactivities 48,951 5,464 43,487 40,297 11,566 28,731<strong>TIO</strong> <strong>Annual</strong> <strong>Report</strong> 2010/<strong>2011</strong> 99
Territory Insurance OfficeNotes to the Financial Statements30 June <strong>2011</strong>32. Financing arrangements<strong>2011</strong> 2010<strong>TIO</strong><strong>TIO</strong>Insurance& BankingMACFund <strong>TIO</strong><strong>TIO</strong>Insurance& BankingMACFund$’000 $’000 $’000 $’000 $’000 $’000Unrestricted access was availableat balance date to the followinglines of creditTotal facilitiesBank multiple option facility 20,000 20,000 - 20,000 20,000 -20,000 20,000 - 20,000 20,000 -Used at balance dateBank multiple option facility - - - - - -- - - - - -Unused at balance dateBank multiple option facility 20,000 20,000 - 20,000 20,000 -20,000 20,000 - 20,000 20,000 -This multiple option facility may be drawn at any time and may be terminated by thebank without notice. Interest rates on this facility are variable. The Board hasundertaken to inform the Minister in the event of a draw-down.33. Risk management and financial instrumentsinformationClasses of Financial Instruments<strong>2011</strong> 2010<strong>TIO</strong><strong>TIO</strong>Insurance &BankingMACFund <strong>TIO</strong><strong>TIO</strong>Insurance& BankingMACFund$’000 $’000 $’000 $’000 $’000 $’000Financial AssetsCash at Bank and on hand 26,543 20,951 5,592 30,215 27,855 2,360Non-insurance receivables 5,821 4,438 2,682 4,842 3,995 1,873Insurance receivables premiums 47,742 46,605 1,138 47,576 46,491 1,086Insurance recoveries on claims paid 71,036 39,767 31,269 62,482 29,791 32,691Short Term Securities 106,485 93,538 12,947 135,813 98,954 36,859Floating Rate Notes 7,653 5,755 1,898 10,305 7,952 2,353Bonds 105,945 - 105,945 59,505 - 59,505Other instruments 85,042 47,413 37,629 79,649 48,478 31,171Units in unlisted unit trusts 312,177 79,412 232,765 281,620 69,295 212,325Loans and advances 525,896 525,896 - 564,075 564,075 -Derivative financial assets 64 64 - 124 124 -Financial LiabilitiesNon-insurance creditors and accruals 20,969 21,014 1,254 18,051 17,610 441Insurance creditors and accruals 8,117 6,749 1,368 21,003 18,932 2,071Deposits 497,688 497,688 - 531,309 531,309 -Derivative financial liabilities - - - 102 102 -Subordinated loans - - - - - -Securitisation liabilities 65,973 65,973 - 85,510 85,510 -<strong>TIO</strong> <strong>Annual</strong> <strong>Report</strong> 2010/<strong>2011</strong> 100
Territory Insurance OfficeNotes to the Financial Statements30 June <strong>2011</strong>Financial Risk Management objectives<strong>TIO</strong> has exposure to the following key financial risks through the use of financialinstruments:• Market risk (interest rate risk and price risk)• Credit risk• Liquidity riskExposure to these financial risks is managed in accordance with the Treasury Policy (TP).The principal objective of <strong>TIO</strong>’s TP is to establish a robust structure for the measuring,monitoring and reporting of financial risks.<strong>TIO</strong> seeks to manage financial risks to:• Ensure there is sufficient cash flow available to meet contractual obligations.• Outperform an asset allocation strategy benchmark set by the Board based on theexpected growth in the liability portfolio.The <strong>TIO</strong> Board has overall responsibility for the establishment and oversight of the riskmanagement framework. Risk management policies and systems are reviewed regularlyto reflect changes in market conditions and <strong>TIO</strong>’s activities. <strong>TIO</strong> through training andmanagement standards and procedures aims to develop a disciplined and constructivecontrol environment in which all employees understand their roles and obligations.Financial Risk Management structureThe <strong>TIO</strong> board has ultimate responsibility for risk management and governance,including ensuring an appropriate risk framework is in place and is operating effectively.There are, however, other committees and individuals that manage and monitor financialinstrument risks.a) Market RiskMarket risk is the risk that the fair value or future cash flows of financialinstruments will fluctuate because of changes in market factors. Market risk at <strong>TIO</strong>comprises interest rate risk due to fluctuations in market interest rates, and pricerisk due to fluctuations in market prices. The objective of market risk managementis to manage and control market risk exposures within acceptable parameters,whilst optimising the return.(i) Interest rate risk<strong>TIO</strong>’s exposure to interest rate risk arises predominantly when a change in thevalue of the liabilities due to a change in interest rates, does not lead to an exactlyoffsetting change in the value of the assets. There is no interest rate risk associatedwith the portion of the home loans that are securitised.The Board has approved the use of interest rate swaps, to reduce exposure tounmatched maturity patterns and for hedging purposes.<strong>TIO</strong> has both internally and externally managed portfolios which are exposed tointerest rate risk. For internally or externally managed portfolios management mayuse derivatives to manage interest rate risk, but not to leverage or gear the asset.<strong>TIO</strong> <strong>Annual</strong> <strong>Report</strong> 2010/<strong>2011</strong> 101
Territory Insurance OfficeNotes to the Financial Statements30 June <strong>2011</strong>Interest rate swap contractsUnder interest rate swap contracts, <strong>TIO</strong> agrees to exchange the difference betweenfixed and floating rate interest amounts calculated on agreed notional principalamounts. Such contracts enable <strong>TIO</strong> to mitigate the risk of changing interest rateson the cash flow exposures on the deposit liabilities held to an interest ratesensitivity of less than 5% of Banking capital.<strong>TIO</strong> has no banking deposit related swaps as at 30 June <strong>2011</strong>. The interest rateswaps settle on a predetermined basis. <strong>TIO</strong> will settle the difference between thefixed and floating interest rate on a net basis.The following table details the notional principal amounts and remaining terms ofinterest rate swap contracts outstanding as at 30 June <strong>2011</strong>.Cash flow hedgesAverage contractedfixed interest rateNotional PrincipalAmountFair Value<strong>2011</strong> 2010 <strong>2011</strong> 2010 <strong>2011</strong> 2010% % $’000 $’000 $’000 $’000Banking 1Less than 1 year - 6.26% - 19,000 - (70)1 to 2 years - 3.54% - 18,000 - 922 to 5 years - 5.89% - 11,250 - (124)Greater than 5 years - - - - - -- 5.16% - 48,250 - (102)Insurance2 to 5 years 5.67% 5.57% 5,900 7,500 64 1241. Banking had no outstanding cash flow hedges as at 30 June <strong>2011</strong>The interest rate swaps and the interest payments on the deposits occursimultaneously and the amount deferred in equity is recognised in profit or lossover the period that the floating interest payments on deposits impact profit or loss.The notional value and variable rate resets of the swaps are matched to existingdeposits and are therefore considered highly effective. The swaps are valued at fairvalue and all gains and losses attributable to the hedged risk are taken directly toequity and re-classified into profit and loss section of the Statement ofComprehensive Income when the interest income or expense is recognised.Cash flow hedge ineffectiveness recognised immediately in profit and loss section ofthe Statement of Comprehensive Income was a loss of $0.2 million (2010: gain of$0.47 million).<strong>TIO</strong> <strong>Annual</strong> <strong>Report</strong> 2010/<strong>2011</strong> 102
Territory Insurance OfficeNotes to the Financial Statements30 June <strong>2011</strong>Interest rate risk tablesThe following table sets out <strong>TIO</strong>’s exposure to interest rate risk showing thecarrying value of financial instruments and the weighted average effective interestrates, when applicable. The banding is based upon the earlier of the contractualrepricing or maturity dates.The interest rate risk table does not disclose financial assets and financial liabilitiesthat are non-interest bearing.<strong>TIO</strong>Fixed orfloating1 yearor less> 1yearand 2yearsand 3yearsand 4yearsand
Territory Insurance OfficeNotes to the Financial Statements30 June <strong>2011</strong><strong>TIO</strong>Fixed orfloating1 yearor less> 1yearand 2yearsand 3yearsand 4yearsand
<strong>TIO</strong> –Insurance andBankingFixed orfloating1 yearor less> 1yearand 2yearsand 3yearsand 4yearsand
<strong>TIO</strong> –Insurance andBankingFixed orfloating1 yearor less> 1yearand 2yearsand 3yearsand 4yearsand
Territory Insurance OfficeNotes to the Financial Statements30 June <strong>2011</strong>MAC FundFixed orfloating1 yearor less> 1yearand 2yearsand 3yearsand 4yearsand 1yearand 2yearsand 3yearsand 4yearsand
Interest Rate Risk Sensitivity AnalysisTerritory Insurance OfficeNotes to the Financial Statements30 June <strong>2011</strong>The following table demonstrates <strong>TIO</strong>’s sensitivity to movement in interest rates inrelation to the value of interest bearing financial assets and liabilities.<strong>TIO</strong>Change ininterest rate<strong>2011</strong> 2010Impact Impact Impact Impacton profit on Equity on profit on Equityafter taxafter tax$’000 $’000 $’000 $’000Interest bearing financial assets andliabilitiesInterest bearing financial assets andliabilities+100 basispoints (12,937) (12,937) (10,017) (9,837)-100 basispoints 14,241 14,241 10,971 10,788<strong>TIO</strong> - Insurance and BankingInterest bearing financial assets andliabilitiesInterest bearing financial assets andliabilities+100 basispoints (1,816) (1,816) (1,546) (1,366)-100 basispoints 1,929 1,929 1,654 1,471MAC FundInterest bearing financial assets andliabilitiesInterest bearing financial assets andliabilities+100 basispoints (11,121) (11,121) (8,471) (8,471)-100 basispoints 12,312 12,312 9,317 9,317The effect of interest rate movements on <strong>TIO</strong>’s provision for outstanding claims isincluded in note 3.(ii) Currency Risk<strong>TIO</strong> does not have any exposure to currency risk, as there are no sales, purchases,liabilities or assets denominated in a currency other than the Australian dollar.(ii) Price Risk<strong>TIO</strong> is exposed to price risk through the holding of units in unlisted unit trusts.Price risk arises due to the changes in the market value of the units as advised byrespective fund managers.Price risk is managed through the use of strictly monitored allocation limits for unitsheld in each class of managed fund. <strong>TIO</strong> invests in a diverse range of managedfunds thereby limiting the impact of any one underlying variable affecting unitprices.Returns achieved by appointed fund managers are continuously assessed by theBoard in relation to their stated objectives and the objectives of each business unitand are compared to returns earned by a suitable peer group of other professionalfund managers.<strong>TIO</strong> <strong>Annual</strong> <strong>Report</strong> 2010/<strong>2011</strong> 108
Territory Insurance OfficeNotes to the Financial Statements30 June <strong>2011</strong>Price Risk Sensitivity AnalysisThe analysis below demonstrates the impact of a movement in the prices of unitsheld in unlisted unit trusts. It is assumed that any relevant price change occurs asat the reporting date.<strong>TIO</strong>Change inunit price<strong>2011</strong> 2010Impact Impact Impact Impacton profit on Equity on profit on Equityafter taxafter tax$’000 $’000 $’000 $’000UpsideAustralian equities +20% 12,169 12,169 9,289 9,289International equities +20% 17,564 17,564 14,126 14,126Global listed properties +20% 3,840 3,840 2,844 2,844Cash +2% - - - -Australian fixed interest +2% 1,029 1,029 1,300 1,300International fixed interest +2% - - - -Australian inflation linked +2% 1,385 1,385 1,291 1,291International inflation linked +2% - - - -Total 35,987 35,897 28,850 28,850DownsideAustralian equities -20% (12,169) (12,169) (9,289) (9,289)International equities -20% (17,564) (17,564) (14,126) (14,126)Global listed properties -20% (3,840) (3,840) (2,844) (2,844)Cash -2% - - - -Australian fixed interest -2% (1,029) (1,029) (1,300) (1,300)International fixed interest -2% - - - -Australian inflation linked -2% (1,385) (1,385) (1,291) (1,291)International inflation linked -2% - - - -Total (35,987) (35,987) (28,850) (28,850)<strong>TIO</strong> – Insurance andBankingChange inunit price<strong>2011</strong> 2010Impact Impact Impact Impacton profit on Equity on profit on Equityafter taxafter tax$’000 $’000 $’000 $’000UpsideAustralian equities +20% 1,739 1,739 1,541 1,541International equities +20% 2,915 2,915 2,447 2,447Global listed properties +20% 490 490 363 363Cash +2% - - - -Australian fixed interest +2% 598 598 535 535International fixed interest +2% - - - -Australian inflation linked +2% - - - -International inflation linked +2% - - - -Total 5,742 5,742 4,886 4,886<strong>TIO</strong> <strong>Annual</strong> <strong>Report</strong> 2010/<strong>2011</strong> 109
Territory Insurance OfficeNotes to the Financial Statements30 June <strong>2011</strong><strong>TIO</strong> – Insurance andBankingChange inunit price<strong>2011</strong> 2010Impact Impact Impact Impacton profit on Equity on profit on Equityafter taxafter tax$’000 $’000 $’000 $’000DownsideAustralian equities -20% (1,739) (1,739) (1,541) (1,541)International equities -20% (2,915) (2,915) (2,447) (2,447)Global listed properties -20% (490) (490) (363) (363)Cash -2% - - - -Australian fixed interest -2% (598) (598) (535) (535)International fixed interest -2% - - - -Australian inflation linked -2% - - - -International inflation linked -2% - - - -Total (5,742) (5,742) (4,886) (4,886)MAC FundChange inunit priceImpacton profitafter tax<strong>2011</strong> 2010Impacton EquityImpacton profitafter taxImpacton Equity$’000 $’000 $’000 $’000UpsideAustralian equities +20% 10,430 10,430 7,748 7,748International equities +20% 14,649 14,649 11,679 11,679Global listed properties +20% 3,350 3,350 2,481 2,481Cash +2% - - - -Australian fixed interest +2% 431 431 765 765International fixed interest +2% - - - -Australian inflation linked +2% 1,385 1,385 1,291 1,291International inflation linked +2% - - - -Total 30,245 30,245 23,964 23,964DownsideAustralian equities -20% (10,430) (10,430) (7,748) (7,748)International equities -20% (14,649) (14,649) (11,679) (11,679)Global listed properties -20% (3,350) (3,350) (2,481) (2,481)Cash -2% - - - -Australian fixed interest -2% (431) (431) (765) (765)International fixed interest -2% - - - -Australian inflation linked -2% (1,385) (1,385) (1,291) (1,291)International inflation linked -2% - - - -Total (30,245) (30,245) (23,964) (23,964)b) Credit riskCredit risk represents the loss that would be recognised if counterparties failed toperform as contracted.Trade and other receivablesTrade receivable balances are monitored on an ongoing basis to ensure that <strong>TIO</strong>’sexposure to bad debts is not significant. A provision for impairment is recognisedwhen there is objective evidence that the receivable is impaired. Other receivablebalances do not contained impaired assets and are not past due, as they areexpected to be received when due.<strong>TIO</strong> <strong>Annual</strong> <strong>Report</strong> 2010/<strong>2011</strong> 110
Territory Insurance OfficeNotes to the Financial Statements30 June <strong>2011</strong>Interest bearing InvestmentsThe credit risk associated with interest bearing investments is managed by <strong>TIO</strong> asfollows:• The setting and review of credit limits as they relate to recognised externalcredit assessment institution’s ratings.• The setting and review of credit limits as it relates to exposures to individualentities.• The monitoring of limit usage for both the credit ratings and the individualentities.<strong>TIO</strong> has a maximum exposure equal to the carrying amount of each financial asset,including derivatives, on the statement of financial position.Units held in unlisted unit trustsFund managers are selected pursuant to a strategic asset allocation approved bythe Board. Fund managers manage applicable credit risk in accordance with theirproduct disclosure statements. Their approach to credit risk is one of the factors inthe selection process and their compliance with their product disclosure statementsis confirmed annually.Loans and advancesThe credit risk associated with our retail financial loan assets including securitisedloans are managed by the Banking operations as follows:• Clearly defined credit policies.• The established credit policies set out specific requirements for different loantypes based on the purpose for which they are made and includes an assessmentof a counter party’s repayment capacity and security (where applicable).• The established policies specify the acceptable terms and conditions for all loantypes.• The Credit Policy incorporates Delegated Lending Authorities (DLA) according todifferent classes of security and the lending officer’s experience.• The regular monitoring of compliance with the credit risk policy.The Banking operations manage all loan arrears on a daily basis. The nature ofcredit risk varies between business and retail loans and is managed accordingly.With the securitisation program in place over some home loans, <strong>TIO</strong> has taken outinsurance contracts on every loan that has been securitised to cover the risk ofborrowers defaulting on their loan repayments. Although credit risk associated withthese loans is insured with a third party, there is the residual risk that <strong>TIO</strong> may notbe eligible in some exceptional cases to seek recovery under the policy.At the reporting date there were no significant concentrations of credit risk.The following tables provide information regarding the aggregate credit riskexposure of <strong>TIO</strong> as at 30 June in respect of the major classes of financial assets,excluding units in unlisted unit trusts, loans and receivables. The analysis classifiesthe assets according to recognised counterparty credit ratings.<strong>TIO</strong> <strong>Annual</strong> <strong>Report</strong> 2010/<strong>2011</strong> 111
Territory Insurance OfficeNotes to the Financial Statements30 June <strong>2011</strong>Credit RatingsAAA or AA or A or A2 Unrated Total<strong>TIO</strong>A1+ A130 June <strong>2011</strong> $’000 $’000 $’000 $’000 $’000Cash at bank and on hand 25,628 - - 915 26,543Short Term Securities and Floating rate notes 58,548 26,900 25,424 3,266 114,138Other instruments 83,498 881 - 663 85,042Bonds 105,945 - - - 105,945Derivative financial instruments 64 - - - 64Total 273,683 27,781 25,424 4,844 331,73230 June 2010Cash at bank and on hand 29,713 - - 502 30,215Short Term Securities and Floating rate notes 87,092 32,809 22,951 3,266 146,118Other instruments 78,892 - - 757 76,649Bonds 52,264 7,241 - - 59,505Derivative financial instruments 124 - - - 124Total 248,085 40,050 22,951 4,525 315,611<strong>TIO</strong> – Insurance andBankingCredit RatingsAAA or AA or A or A2 Unrated TotalA1+ A130 June <strong>2011</strong> $’000 $’000 $’000 $’000 $’000Cash at bank and on hand 20,036 - - 915 20,951Short Term Securities and Floating rate notes 51,650 21,925 22,452 3,266 99,293Other instruments 45,869 881 - 663 47,413Bonds - - - - -Derivative financial instruments 64 - - - 64Total 117,619 22,806 22,452 4,844 167,72130 June 2010Cash at bank and on hand 27,353 - - 502 27,855Short Term Securities and Floating rate notes 62,747 28,842 12,051 3,266 106,906Other instruments 47,852 - - 626 48,478Bonds - - - - -Derivative financial instruments 124 - - - 124Total 138,076 28,842 12,051 4,394 183,363Credit RatingsAAA or AA or A or A2 Unrated TotalMAC FundA1+ A130 June <strong>2011</strong> $’000 $’000 $’000 $’000 $’000Cash at bank and on hand 5,592 - - - 5,592Short Term Securities and Floating rate notes 6,898 4,975 2,972 - 14,845Other instruments 37,629 - - - 37,629Bonds 105,945 - - - 105,945Derivative financial instruments - - - - -Total 156,064 4,975 2,972 - 164,01130 June 2010Cash at bank and on hand 2,360 - - - 2,360Short Term Securities and Floating rate notes 24,345 3,967 10,900 - 39,212Other instruments 31,040 - - 131 31,171Bonds 52,264 7,241 - - 59,505Derivative financial instruments - - - - -Total 110,009 11,208 10,900 131 132,248<strong>TIO</strong> <strong>Annual</strong> <strong>Report</strong> 2010/<strong>2011</strong> 112
Territory Insurance OfficeNotes to the Financial Statements30 June <strong>2011</strong>The following table provides further information regarding the carrying balance of<strong>TIO</strong>’s financial assets that have been impaired and the ageing of those that are pastdue but not impaired at the balance date. Information relating to the ageing ofreinsurance financial assets on paid claims is disclosed in note 4 (g).<strong>TIO</strong>Past due but not impaired30 June <strong>2011</strong> Neither pastdue norimpaired0 to 3months3 to 6monthsGreaterthan 6monthsImpairedInsurance receivables -premiums 24,081 22,435 1,331 (105) 179 47,921Non-insurance receivables - 3,906 - - - 3,906Investment receivables 1,915 - - - - 1,915Loans and advances 502,634 22,770 453 39 526 526,422Total 528,630 49,111 1,784 (66) 705 580,16430 June 2010Insurance receivables -premiums 21,819 24,613 663 481 157 47,733Non-insurance receivables - 3,183 - - - 3,183Investment receivables 1,659 - - - - 1,659Loans and advances 539,710 24,028 338 - 918 564,994Total 563,188 51,824 1,001 481 1,075 617,569Total<strong>TIO</strong> – Insuranceand Banking30 June <strong>2011</strong> Neither pastdue norimpairedPast due but not impaired0 to 3months3 to 6monthsGreaterthan 6monthsImpairedInsurance receivables -premiums 24,080 21,295 1,334 (105) 179 46,783Non-insurance receivables - 3,906 - - - 3,906Investment receivables 532 - - - - 532Loans and advances 502,634 22,770 453 39 526 526,422Total 527,246 47,971 1,787 (66) 705 577,64330 June 2010Insurance receivables -premiums 21,819 23,528 663 481 157 46,648Non-insurance receivables - 3,165 - - - 3,165Investment receivables 830 - - - - 830Loans and advances 539,710 24,028 338 - 918 564,994Total 562,359 50,721 1,001 481 1,075 615,637TotalMAC Fund30 June <strong>2011</strong> Neither pastdue norimpairedPast due but not impaired0 to 3months3 to 6monthsGreaterthan 6monthsImpairedInsurance receivables -premiums - 1,141 (3) - - 1,138Non-insurance receivables - 1,299 - - - 1,299Investment receivables 1,383 - - - - 1,383Loans and advances - - - - - -Total 1,383 2,440 (3) - - 3,82030 June 2010Insurance receivables -premiums - 1,086 - - - 1,086Non-insurance receivables - 1,045 - - - 1,045Investment receivables 828 - - - - 828Loans and advances - - - - - -Total 828 2,131 - - - 2,959Total<strong>TIO</strong> <strong>Annual</strong> <strong>Report</strong> 2010/<strong>2011</strong> 113
Territory Insurance OfficeNotes to the Financial Statements30 June <strong>2011</strong>(c) Liquidity riskLiquidity is the ability to access funds at short notice via internal or external sourcesto the organisation. Liquidity risk is the risk that <strong>TIO</strong> will be unable to meet itsobligations in an orderly manner as and when they fall due. This includes the riskthat <strong>TIO</strong> may not be able to borrow funds when required, or at an acceptable cost.Liquidity risk arises due to unanticipated obligations arising. This may occur whenanticipated receipts do not eventuate, or when short term sources of funds arewithdrawn, or where <strong>TIO</strong> is exposed to one particular market sector.The three main elements of managing Liquidity risk are:Day-to-day cash management: Involves the use of working cash and investmentbalances. The key tool used to manage cash balances involves the use of cash flowforecasts.Short Term Liquidity management: Involves the use of both internal and externaltools and facilities. <strong>TIO</strong> utilises tools including cash flow forecasts and investmentmaturity profiles to ensure liquidity does not fall below prudential limits. Theexternal facilities include committed and uncommitted stand-by lines for plannedand emergency funding requirements.Long Term Liquidity management: Involves the use of budgets and business plansto protect against a liquidity problem in the future. <strong>TIO</strong> maintain close relationshipswith bankers and financial intermediaries to ensure the availability of committedand uncommitted funds from a number of sources.The following table summarises the maturity profile of <strong>TIO</strong>’s liabilities. This is basedon contractual undiscounted repayment obligations, which includes estimatedinterest repayments. The maturity profiles of Insurance contract liabilities aredetermined on the basis of discounted estimated timing of net cash outflows andare disclosed in note 19 (e). Repayments that are subject to notice are treated asif notice were to be given immediately.Maturity profiles of undiscounted financial liabilities.<strong>TIO</strong>1 year orless> 1 year and< 5 years > 5 years No term Total30 June <strong>2011</strong> $’000 $’000 $’000 $’000 $’000Deposits 369,204 39,662 741 102,423 512,030Securitisation liabilities 3,570 14,151 62,264 - 79,985Subordinated loans - - - - -Trade and other payables 29,085 - - - 29,085Interest rate swaps 44 97 - - 141Total undiscountedfinancial liabilities 401,903 53,910 63,005 102,423 621,24130 June 2010Deposits 430,255 1 - 116,983 547,239Securitisation liabilities 4,444 17,702 80,924 - 103,070Subordinated loans - - - - -Trade and other payables 39,054 - - - 39,054Interest rate swaps (103) 6 - - (97)Total undiscountedfinancial liabilities 473,650 17,709 80,924 116,983 689,266<strong>TIO</strong> <strong>Annual</strong> <strong>Report</strong> 2010/<strong>2011</strong> 114
Territory Insurance OfficeNotes to the Financial Statements30 June <strong>2011</strong><strong>TIO</strong> – Insuranceand Banking> 1 year and1 year or less < 5 years > 5 years No term Total30 June <strong>2011</strong> $’000 $’000 $’000 $’000 $’000Deposits 369,204 39,662 741 102,423 512,030Securitisation liabilities 3,570 14,151 62,264 - 79,985Subordinated loans - - - - -Trade and other payables 27,763 - - - 27,763Related party payable - - - - -Interest rate swaps 44 97 - - 141Total undiscountedfinancial liabilities 400,581 53,910 63,005 102,423 619,91930 June 2010Deposits 430,255 1 - 116,983 547,239Securitisation liabilities 4,444 17,702 80,924 - 103,070Subordinated loans - - - - -Trade and other payables 37,568 - - - 37,568Related party payable - - - - -Interest rate swaps (103) 6 - - (97)Total undiscountedfinancial liabilities 472,164 17,709 80,924 116,983 687,780MAC Fund> 1 year and1 year or less < 5 years > 5 years No term Total30 June <strong>2011</strong> $’000 $’000 $’000 $’000 $’000Trade and other payables 2,622 - - - 2,622Total undiscountedfinancial liabilities 2,622 - - - 2,62230 June 2010Trade and other payables 2,512 - - - 2,512Total undiscountedfinancial liabilities 2,512 - - - 2,512<strong>TIO</strong> <strong>Annual</strong> <strong>Report</strong> 2010/<strong>2011</strong> 115
Territory Insurance OfficeNotes to the Financial Statements30 June <strong>2011</strong>d) Derivative financial instruments<strong>TIO</strong> uses derivative financial instruments to hedge financial risk from movements ininterest rates. All such transactions are carried out within the parameters set bythe TP.Derivative financial instruments are carried at fair value and recorded in theStatement of financial position as assets and liabilities. Changes in values ofderivative financial instruments, other than interest rate swaps designated as cashflow hedges, are recognised in the profit and loss section of the statement ofcomprehensive income. The accounting treatment of interest rate swapsdesignated as cash flow hedges is described in note 33 a (i).At year end <strong>TIO</strong> held derivative exposures to manage exposure on the investmentsheld for trading portfolio, and deposit portfolio, of Interest Rate Swaps with a netnotional value of $5.9 million (2010: $40.8 million) and a fair value of $0.06 million(2010: $0.02 million).e) Capital Management<strong>TIO</strong> manages its capital requirements by assessing capital levels on a regular basis.The capital management objectives have been determined to protect policy holders,depositors and creditors from unexpected losses, and to avoid premium volatility forthe MAC scheme.The capital policy has been designed to:• Ensure compliance with the <strong>TIO</strong> Act, <strong>TIO</strong> Regulations and prudential standards ofthe regulator (Northern Territory Government),• Provide policies that will be consistent with an APRA regulated organisation.Banking measures a capital adequacy ratio in accordance with APRA prudentialstandard APS 110, and has at all times exceeded the minimum regulatory capitaladequacy ratio of 10% for the current financial year.Insurance measures a minimum capital requirement (MCR) ratio in accordance withAPRA prudential standard GPS 110, and has at all times exceeded the minimumregulatory MCR ratio of 120% for the current financial year.The adequacy of the MAC fund’s capital is measured as a solvency ratio of retainedearnings to net outstanding claims. Although there is no minimum regulatorycapital ratio to which the MAC fund is required to comply, the minimum target setby the Northern Territory Government has been exceeded at all times during thecurrent financial year.<strong>TIO</strong> <strong>Annual</strong> <strong>Report</strong> 2010/<strong>2011</strong> 116
Territory Insurance OfficeNotes to the Financial Statements30 June <strong>2011</strong>The following table provides information about <strong>TIO</strong>’s capital resources:<strong>2011</strong> 2010<strong>TIO</strong><strong>TIO</strong>Insurance& BankingMACFund <strong>TIO</strong><strong>TIO</strong>Insurance& Banking MAC Fund$’000 $’000 $’000 $’000 $’000 $’000Contributed Equity (note 27) 39,340 39,340 - 39,340 39,340 -Asset revaluation reserve 16,336 3,929 2,088 15,049 3,684 1,046Retained earnings 215,868 65,197 160,990 163,881 57,477 116,723Hedging Reserves - - - (21) (21) 0Total capital resources 271,544 108,466 163,078 218,249 100,480 117,769Insurance and BankingThe Board requires <strong>TIO</strong> to maintain the minimum levels as determined by theprudential standards as well as a capital requirement for each business unit.Although <strong>TIO</strong> Insurance and Banking divisions are not regulated by APRA, theNorthern Territory Government has imposed compliance requirements in line withAPRA regulations.MAC FundThe Board requires MAC to maintain the minimum levels of capital taking intoaccount regulation 19 (2) (b) of the Motor Vehicles Regulations. These regulationsset a minimum solvency level which the MAC Scheme must comply with.f) Fair valuesThe fair values of listed held for trading financial assets have been determinedusing market values.The fair values of derivatives and subordinated loans have been calculated bydiscounting the expected future cash flows at applicable interest rates. The fairvalues of other financial assets have been calculated using the market interestrates.The carrying amount of receivables, cash at bank, insurance recoveries andcreditors approximate their fair value due to their short term nature. The carryingamount of loans and advances and deposits are not materially different from theirfair values.<strong>TIO</strong> <strong>Annual</strong> <strong>Report</strong> 2010/<strong>2011</strong> 117
Territory Insurance OfficeNotes to the Financial Statements30 June <strong>2011</strong>The following table provides an analysis of financial instruments that are measuredat fair value, grouped into levels 1 to 3 based on the degree to which the fair valueis observable.Level 1 – the fair value is calculated using quoted prices in active markets.Level 2 – the fair value is estimated using inputs other than quoted prices includedin Level 1 that are observable for the asset or liability, either directly (as prices) orindirectly (derived from prices).Level 3 – the fair value is estimated using inputs for the asset or liability that arenot based on observable market data.There are no transfers between levels during <strong>2011</strong>.<strong>2011</strong>$’000 $’000 $’000 $’000<strong>TIO</strong>Level 1 Level 2 Level 3 TotalFinancial AssetsDerivative instrumentsInterest rate swaps - 64 - 64Non-derivative instrumentsShort term deposits - 106,485 - 106,485Floating rate notes 7,653 - - 7,653Other floating rate investments - 85,042 - 85,042Bonds 105,945 - - 105,945Units in unlisted trusts 312,177 - - 312,177Total 426,775 191,591 - 617,366Financial LiabilitiesDerivative instrumentsInterest rate swaps - - - -Total - - - -<strong>TIO</strong> <strong>Annual</strong> <strong>Report</strong> 2010/<strong>2011</strong> 118
Territory Insurance OfficeNotes to the Financial Statements30 June <strong>2011</strong>2010$’000 $’000 $’000 $’000<strong>TIO</strong>Level 1 Level 2 Level 3 TotalFinancial AssetsDerivative instrumentsInterest rate swaps - 124 - 124Non-derivative instrumentsShort term deposits - 135,813 - 135,813Floating rate notes 10,305 - - 10,305Other floating rate investments - 79,649 - 79,649Bonds 59,505 - - 59,505Units in unlisted trusts 281,620 - - 281,620Total 351,430 215,586 - 567,016Financial LiabilitiesDerivative instrumentsInterest rate swaps - (102) - (102)Total - (102) - (102)<strong>TIO</strong> – Insurance &Banking<strong>2011</strong>$’000 $’000 $’000 $’000Level 1 Level 2 Level 3 TotalFinancial AssetsDerivative instrumentsInterest rate swaps - 64 - 64Non-derivative instrumentsShort term deposits - 93,538 - 93,538Floating rate notes 5,755 - - 5,755Other floating rate investments - 47,413 - 47,413Bonds - - - -Units in unlisted trusts 79,412 - - 79,412Total 85,167 141,015 - 226,182Financial LiabilitiesDerivative instrumentsInterest rate swaps - - - -Total - - - -<strong>TIO</strong> <strong>Annual</strong> <strong>Report</strong> 2010/<strong>2011</strong> 119
Territory Insurance OfficeNotes to the Financial Statements30 June <strong>2011</strong><strong>TIO</strong> – Insurance &Banking2010$’000 $’000 $’000 $’000Level 1 Level 2 Level 3 TotalFinancial AssetsDerivative instrumentsInterest rate swaps - 124 - 124Non-derivative instrumentsShort term deposits - 98,954 - 98,954Floating rate notes 7,952 - - 7,952Other floating rate investments - 48,478 - 48,478Bonds - - - -Units in unlisted trusts 69,295 - - 69,295Total 77,247 147,555 - 224,802Financial LiabilitiesDerivative instrumentsInterest rate swaps - (102) - (102)Total - (102) - (102)<strong>2011</strong>$’000 $’000 $’000 $’000MAC FundLevel 1 Level 2 Level 3 TotalFinancial AssetsDerivative instrumentsInterest rate swaps - - - -Non-derivative instrumentsShort term deposits - 12,947 - 12,947Floating rate notes 1,898 - - 1,898Other floating rate investments - 37,629 - 37,629Bonds 105,945 - - 105,945Units in unlisted trusts 232,765 - - 232,765Total 340,608 50,576 - 391,184Financial LiabilitiesDerivative instrumentsInterest rate swaps - - - -Total - - - -<strong>TIO</strong> <strong>Annual</strong> <strong>Report</strong> 2010/<strong>2011</strong> 120
Territory Insurance OfficeNotes to the Financial Statements30 June <strong>2011</strong>2010$’000 $’000 $’000 $’000MAC FundLevel 1 Level 2 Level 3 TotalFinancial AssetsDerivative instrumentsInterest rate swaps - - - -Non-derivative instrumentsShort term deposits - 36,859 - 36,859Floating rate notes 2,353 - - 2,353Other floating rate investments - 31,171 - 31,171Bonds 59,505 - - 59,505Units in unlisted trusts 212,325 - - 212,325Total 274,183 68,030 - 342,213Financial LiabilitiesDerivative instrumentsInterest rate swaps - - - -Total - - - -The fair values of financial assets and liabilities are determined as follows:• The fair values of financial assets and liabilities with standard terms andconditions and traded on active markets are determined with reference to quotedmarket prices (includes, floating rate notes, bonds and units in unlisted trusts).• The fair values of other financial assets and liabilities are determined using pricesfrom observable current market data and other relevant models used by marketparticipants (includes short term deposits, other floating rate investments andinterest rate swaps).• Financial instruments that do not have an active market are based on valuationtechniques using market data that is not observable.<strong>TIO</strong> <strong>Annual</strong> <strong>Report</strong> 2010/<strong>2011</strong> 121
34. Commitments for expenditure(a) Capital commitmentsCommitments for miscellaneous property,plant and equipment contracted for atreporting date but not recognised asliabilities, payable:Territory Insurance OfficeNotes to the Financial Statements30 June <strong>2011</strong><strong>2011</strong> 2010<strong>TIO</strong><strong>TIO</strong>Insurance &BankingMACFund <strong>TIO</strong><strong>TIO</strong>Insurance &BankingMACFund$’000 $’000 $’000 $’000 $’000 $’000Within one year 198 198 - 46 46 -Later than one year but not later thanfive years - - - - - -198 198 - 46 46 -(b) Non-cancellable operating leaseswhere <strong>TIO</strong>/ MAC Fund is a lesseeFuture minimum lease payments for rentpayable:Within one year 591 591 - 610 610 -Later than one year but not later thanfive years 443 443 - 840 840 -Later than 5 years - - - - - -1,034 1,034 - 1,450 1,450 -(c) Non-cancellable operating leaseswhere <strong>TIO</strong>/ MAC Fund is a lessorFuture minimum lease payments for rentreceivable in relation to direct propertyheld by <strong>TIO</strong>:Within one year 2,607 652 1,955 1,620 405 1,215Later than one year but not later thanfive years 5,685 1,421 4,264 3,085 771 2,314Later than five years 1,283 321 962 1,804 451 1,3539,575 2,394 7,181 6,509 1,627 4,882Certain properties, where <strong>TIO</strong> is a lessee or a lessor, are leased under non-cancellableoperating leases. Most leases are subject to annual reviews with increases subject to aset percentage or based upon either movement in consumer price indices or marketcriteria. Where appropriate, a right of renewal has been incorporated in the leaseagreements. There are no options to purchase the relevant assets on expiry of the lease.<strong>TIO</strong> <strong>Annual</strong> <strong>Report</strong> 2010/<strong>2011</strong> 122
35. Events subsequent to balance dateThere are no events subsequent to balance date.Territory Insurance OfficeNotes to the Financial Statements30 June <strong>2011</strong>36. Contingent liabilities and contingent assetsa) Contingent liabilities<strong>TIO</strong> Insurance & Banking:The nature of the insurance business is such that in the normal course of operation,rejected claims may be the subject of legal challenges. <strong>TIO</strong> will defend these vigorouslyhowever the outcome and quantum of any liabilities is contingent upon the court’sdecisions.MAC Fund:The MAC Fund has legal matters in progress which arise in the normal course ofbusiness. <strong>TIO</strong>, on behalf of the MAC Fund, defends such matters; however the outcomeand quantum of any liabilities are contingent upon the Courts’ decisions.b) Contingent assets<strong>TIO</strong> Insurance & Banking:<strong>TIO</strong> has no contingent assets.MAC Fund:The MAC Fund has no contingent assets.<strong>TIO</strong> <strong>Annual</strong> <strong>Report</strong> 2010/<strong>2011</strong> 123
Appendix 1 of the <strong>Annual</strong> <strong>Report</strong>Territory Insurance OfficeAppendicesRegulatory CapitalUnder the Territory Insurance Act, <strong>TIO</strong> is regulated for prudential purposes by the NorthernTerritory Government through Treasurer Determinations that state that from 1 January2009, <strong>TIO</strong> businesses (Insurance, Banking and the MAC Fund) must separately comply withall APRA prudential standards unless any standard is specifically exempted.The regulatory capital position of <strong>TIO</strong> is as follows:MAC FundThe MAC fund is exempted from the APRA prudential standards GPS110 to GPS 116.The solvency of the MAC Fund is measured as ratio of Retained Earnings to Net OutstandingClaims.As at 30 June <strong>2011</strong>, the Solvency ratio was 67.6%.BankingThe supervisory capital adequacy ratio of Banking under APRA prudential standard APS 110as at 30 June <strong>2011</strong> was estimated at 12.9% which exceeds the minimum ratio of 10%.InsuranceThe supervisory capital adequacy position of Insurance as measured under APRA prudentialstandard GPS 110 as at 30 June <strong>2011</strong> is estimated as follows:<strong>2011</strong>Statutory capital $’000Tier 1 capitalFundamental tier 1 capitalContributed equity 39,340Regulatory retained earnings 36,132Deductions from tier 1 capitalIntangible assets (1,032)Net deferred tax assets -Total Tier 1 Capital 74,440Tier 2 capitalUpper tier 2 capitalAsset revaluation reserve 2,524Lower tier 2 capitalSubordinated term loan -Total Tier 2 Capital 2,524Total Statutory Capital 76,964<strong>2011</strong>Minimum capital requirement (MCR) $’000Insurance risk capital charge 20,635Investment risk capital charge 17,608Catastrophe concentration risk capital charge 4,000Total MCR 42,243MCR coverage ratio 182.2%<strong>TIO</strong> <strong>Annual</strong> <strong>Report</strong> 2010/<strong>2011</strong> 125
Contact UsAlice Springs12 Gregory TerraceDarwinMitchell CentreMitchell StreetKatherine42 Katherine TerracePalmerstonPalmerston Shopping Centre10 Temple TerraceClaims Centre24 Mataram StreetWinnellieHead Office24 Mitchell StreetDarwinPostal AddressGPO Box 770Darwin NT 0801Call 1300 301 833tiofi.com.auABN 72 532 995 678<strong>TIO</strong> is Government guaranteed and not regulated by APRA