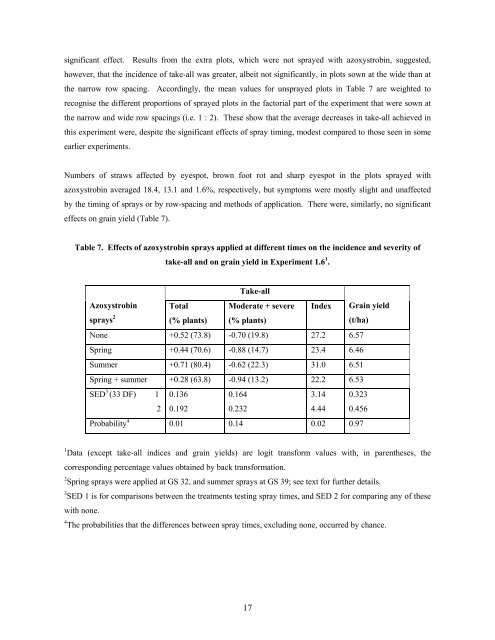
significant effect. Results from the extra plots, which were not sprayed with azoxystrobin, suggested,however, that the incidence of take-all was greater, albeit not significantly, in plots sown at the wide than atthe narrow row spacing. Accordingly, the mean values for unsprayed plots in Table 7 are weighted torecognise the different proportions of sprayed plots in the factorial part of the experiment that were sown atthe narrow and wide row spacings (i.e. 1 : 2). These show that the average decreases in take-all achieved inthis experiment were, despite the significant effects of spray timing, modest compared to those seen in someearlier experiments.Numbers of straws affected by eyespot, brown foot rot and sharp eyespot in the plots sprayed withazoxystrobin averaged 18.4, 13.1 and 1.6%, respectively, but symptoms were mostly slight and unaffectedby the timing of sprays or by row-spacing and methods of application. There were, similarly, no significanteffects on grain yield (Table 7).Table 7. Effects of azoxystrobin sprays applied at different times on the incidence and severity oftake-all and on grain yield in Experiment 1.6 1 .Take-allAzoxystrobinsprays 2Total(% plants)Moderate + severe(% plants)Index Grain yield(t/ha)<strong>No</strong>ne +0.52 (73.8) -0.70 (19.8) 27.2 6.57Spring +0.44 (70.6) -0.88 (14.7) 23.4 6.46Summer +0.71 (80.4) -0.62 (22.3) 31.0 6.51Spring + summer +0.28 (63.8) -0.94 (13.2) 22.2 6.53SED 3 (33 DF) 120.1360.1920.1640.2323.144.440.3230.456Probability 4 0.01 0.14 0.02 0.971 Data (except take-all indices and grain yields) are logit transform values with, in parentheses, thecorresponding percentage values obtained by back transformation.2 Spring sprays were applied at GS 32, and summer sprays at GS 39; see text for further details.3 SED 1 is for comparisons between the treatments testing spray times, and SED 2 for comparing any of thesewith none.4 The probabilities that the differences between spray times, excluding none, occurred by chance.17
EXPERIMENTALPART 2: POT EXPERIMENTSIntroductionIn this part of the report, three pot experiments are described that sought to explore in more detail the effectsof azoxystrobin, and related compounds, on take-all in wheat. The first of these (Experiment 2.1) tested thesame fungicides that were tested in the field in Experiment 1.5. The other two pot experiments tested thetwo fungicides for which there was most evidence of significant activity (azoxystrobin and <strong>HGCA</strong> Z). InExperiments 2.1 and 2.2, the fungicides were applied to the soil but placed below the seed so that theireffects on take-all were not wholly determined by possible differences in their mobility through soil as aconsequence of their different physico-chemical properties. In Experiment 2.3, the fungicides were appliedto the surface of the soil or to the foliage.Materials and MethodsExperiment 2.1In this experiment, the effects on take-all of azoxystrobin, kresoxim-methyl, picoxystrobin, pyraclostrobin,trifloxystrobin and the experimental compound designated <strong>HGCA</strong> Z were tested on wheat seedlings grownin a controlled environment. Each fungicide was tested at two rates that corresponded on an area basis to250 and 500 g ai/ha except that, due to an error, kresoxim-methyl was only tested at 250 g ai/ha. Thesetreatments were compared with another in which no fungicide was applied.Clay loam soil, naturally infested with take-all, was collected from a field on the Rothamsted ExperimentalFarm, crumbled to an even texture, and large stones removed. The soil (200 cm 3 /pot) was then placed in 11cm tall white plastic pots (drinking cups; obtained from Mono Containers Ltd., ref. PV11) previously drilledwith four 3 mm diameter drainage holes and each containing 50 cm 3 of course sand. Appropriate stocksolutions of each of the fungicides were prepared, using the formulated materials, and applied to the surfaceof the soil at 5 or 10ml/pot, to achieve the two rates of application of active ingredient. Another 50 cm 3 ofsoil was then added to each pot before sowing germinated seeds of wheat (cv. Hereward) at 8 per pot. Theseeds were covered with a layer of Lee Moor elutriated sand (Cornish grit). There were six replicate pots ofeach of the fungicide treatments, arranged in six fully randomised blocks, and two untreated pots/block.After sowing, the pots were transferred to a controlled environment room set to run with a 16 h day, and15/10 o C day/night temperatures. Pots were stood in plastic saucers, and the soil watered from above. Fiveweeks after sowing, the root ball was knocked out of the pots, and the roots trimmed at the lower soil/sandinterface. Roots were washed free of soil and examined under water in a white dish for take-all lesions.18


