Masao Sako (Penn)
Masao Sako (Penn)
Masao Sako (Penn)

You also want an ePaper? Increase the reach of your titles
YUMPU automatically turns print PDFs into web optimized ePapers that Google loves.
Supernovae with DESpec<strong>Masao</strong> <strong>Sako</strong> (<strong>Penn</strong>)DESpec RAS - March 7, 20111
DES SN SurveySurvey Strategy I: StrategyFields to overlap withexisting and near-future deepimaging (e.g., CDF-S, SNLS,VIDEO) and spectroscopicsurveys (DEEP2, VIPERS,VVDS, Supernova WiggleZ, Fields GAMA I/II).RA DecCDF South 52.5 -27.5 deepStripe 82 55.0 0.0 deepElias S1 0.5 -43.5 wideXMM-LSS 34.5 -5.5 wideSNLS/VIRM 36.75 -4.5 wide- 1650 hexes cover the survey area = a tiling- 2 tilings/year/bandpass- 1st year has all filters, later years drop filters10 DES fieldsVisit once every ~4 days.2 deep + 8 shallow (30 deg 2 )and increase exposure timesdeep: 6600 sec per visit (griz)shallow: 800 sec per visit (griz)- exposure time in 1st year: 80 seconds- 5 SN fields- a SN field visit has- z: 10 exposures- i: 6 exposures- r: 4 exposures- g: 2 exposuresgood z-band efficiency (~4x higher thanCFHT/MegaCam) and target high-z SN Ia→- 3 deep fields, 2 shallow fieldsgood rest-frame - deep: g-band 300 sec light exposures curves ofz~1 SN Ia. - shallow: 100 sec exposures 22
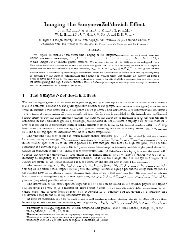
SN Rates and NumbersNo. 1, 2004HIGH-REDSHIFT SUPERNOVA RATES 195dust extinction have a strong redshift-dependent effect on thederived rates. Assuming a higher extinction results in a steeperincrease with redshift of the estimated rates, as can be seenin Figure 1 by comparing the corrected and uncorrected data‣ ~0.5points.SN Ia explosions persecond in all-sky out to z~1.In summary, there are a number of possible sources forsystematic errors in our estimates; however, most errors arerelatively small, not exceeding the statistical errors. For theSNR, we estimate that the summed systematic errors shouldsmaller than the statistical, while the systematic errors maybefrom of thepeak.same order as the statistical when it comes to theSFR derived from the SNR. Since we have shown that systematicerrors are unlikely to dominate over the statistical andthat they are mostly independent of redshift, we are confidentthat the increase in SN and star formation rates that we observeare true features. The main concern is the amount of dust‣ 10 SN Ia/deg 2 within ±5 days‣ 200 SN Ia/deg 2 in 6 months‣ ~2 - 4 CC SN for every SN Iaextinction. The effects of changes in the dust extinction arefurther discussed in x 6. When we derive the SFR from theSNR, we also note that the direction of the errors is mainly toincrease the observed rates; e.g., this is the case if the lowerlimit for CC progenitor mass is larger than 8 M ,iftheIMFischanged to become less top heavy, or if the amount of dust‣ dimmer by ~2 magextinction is underestimated. No. 1, 2004We finally note that the quoted systematic 5.3. White Dwarf errors Explosion in Table Efficiency 2are sums of the 19%–25% uncertainty derived above and theuncertainty due to possible misclassification. These errors are‣ Magnitude-limited surveygives therefore a non-Gaussian. CC/Ia SN ratio of~0.3 - 0.5.Fitting the predicted model distributions of SNe Ia to theobserved sample includes determining the normalization inequation (4). This number tells us how many Type Ia SNeexplode per unit formed stellar mass. Previously in this investigation,we have made no assumptions about the massrange of Type Ia progenitor stars. If we make an assumptionconstraining the progenitor mass range, we can calculate the5.2. Type Ia Supernovva Ratesfraction of stars in this mass range that subsequently explode asSNe Ia, which we here call the efficiency ,viatherelationshipEven though the physics behind Type Ia RSNe 8 Mhave been3 Mextensively investigated using both observations ¼ (M )dMR 125 Mand theoreticalsimulations, there is still a lack of understanding of the0:1 M M (M )dM : ð5ÞHIGH-REDSHIFT SUPERNOVA RATES 197Fig. 2.—Type Ia SNRs from GOODS at hzi ¼ 0:40, 0.80, 1.20, and 1.60are shown as filled circles. Also plotted are rates at z 0:01 from Cappellaroet al. (1999; filled square), at z 0:1 from Hardin et al.Dahlen(2000; openet star),al.atz 0:11 from Strolger (2003; filled star), at z 0:11 from Reiss (2000; open(2004)triangle), at z 0:38 from Pain et al. (1996; open square), at z 0:46 fromTonry et al. (2003; open circle), and at z 0:55 from Pain et al. (2002; filledtriangle). Vertical error bars on the GOODS rates represent statistical errors,while horizontal error bars represent bin size. See text for discussion onsystematic errors. The figure also shows predicted Ia rates based on threedifferent models for the delay time distribution of SN Ia progenitors.
SN Search StrategySimulate with fixed A V=0 and ! = "0.1‣ 6-month 0.1 search and follow-upcampaignsFitted SALT2 color errorfitted SALT2 color error0.150.0500.150.10.0500.150.10.0500.150.10.05N shallow=3DES-deepN shallow=9DES-deepSDSSDES-deepSNLSDES-deep0.150.10.0500.150.1()*+),-)./)0)!"$)1)2340.0500.150.10.050'!!&!!%!!N shallow=6DES-deep22 magN shallow=18DES-deep,5,,..PS1DES-deep23 mag,-6,)7)8,,8-9825 mag58,),-!! !"# $0 0.2 0.4 0.6 0.811redshift‣ Will discover ~6000 SN Ia at0.1 < z < 1.0.00 0.2 0.4 0.6 0.8 1redshiftRedshift‣ ~3800 SN Ia with “good” lightcurves4
Host Galaxy Follow Up‣ Spectroscopy of SNcandidate host galaxies‣ 10000+ targets from DES SN‣ DES main survey - will the lightcurves be useful?‣ host redshifts, SFR, gas-phasemetallicity (S/N~10).No. 1, 2005SNe Ia HOST GALAXIESGallagheret al.(2005)‣ stellar population age, metallicities(S/N~50).‣ reduce Hubble scatter.‣ 5 - 10% contamination from non-Ia.‣ cannot identify spectroscopicallypeculiar types.Fig. 7.—Decline rate vs. host galaxy absolute magnitude. The distributionFig. 8.—Absolute magnithost galaxy samples. The hisstatistically brighter than ththeoretical SNe Ia distributio666 HOWELL ET AL.stretch1.3shows an absence of dimmer SNe Ia in the low-luminosity host galaxy regime.Therefore, H00 argued t1.2Type Ia supernovae delay time, or the time between progenitor cline rate and absolute 1.0 mformation and the SN event. Our simple model is in good agreementwith an average Type Ia supernova delay time of around absolute B magnitude ofrelation between decline1.13Gyr.Although Figure 7 doesNext, we set out to determine the expected effects that the H00, the plot does 0.8 showprogenitor age has on Type Ia supernova decline rate by first ap-a linear fit to the plot of core mass versus main-lection effect brought aaxies, Howell likely due to et a co1.0proximatingsequence mass from Dominguez et al. (1999) and converting our galaxies. al. (2009) Such an effectprimary masses into WD masses. Umeda et al. (1999) postulated from low-luminosity0.6ga0.9that the M 56 Ni,andconsequentlythebrightnessoftheSNIa,increasesas the C/O ratio of the progenitor increases. Based on according to Figure 1, fin the low-luminosity gthe postulate, they developed a model describing this dependency.Although the model should be treated with caution, given axies. Therefore, we seeelliptical galaxies, 0.4 whic0.8that it is based on an unproven postulate, we use it in our toy be hosted by large, brigh0.7model merely to provide a rough understanding on the effects of effects contributes to theage on the decline rates of SNe Ia. Therefore, using these 56 Ni Figure 8 shows 0.27 8 9 10 11 12the hiyields and the M 56 Ni to mLog 15 (B) (Host relationsdescribedinx Mass)3.2.1, galaxy distributions. Th 7.Ni Mass
SN Ia Host Galaxy Brightness
SDSS-II SN Ia (Lampeitl et al. 2010)Low-z SN Ia (Kelly et al. 2010)Y ET AL. Vol. 715(b)Fig. 3.— The Hubble residuals as a function of redshift. The open blue squares denote SNe Ia ingalaxies, while the solid red circles are SNe Ia in passive galaxies. The dashed line is the refermagnitude fit to the whole sample regardless of host galaxy type. We find SNe Ia in passiveare ≃ 0.1 magnitudes brighter than in star–forming hosts even after light curve fitting.Table 2Best fit values for M,α, β as a function of host galaxy typenel (a) plots the asinh magnitude i ′ surface brightness in a 0.2 kpc aperture at the SNated by the dashed horizontal line. The surface brightness distribution of SN locationscorrelation between Hubble residual and host mass exists for these SNe that occur inalso seen in SNLS & low-zlikely to be responsible for the observed trends in Hubble residuals with host galaxyable 12e Information Criteria(Sullivan et al. 2010)... 0 0 0 0/s/x 1 −3.7 −1.0 −4.6 −2.0/s/x 1 −10.3 −6.3 −9.8 −7.4/s/x 1 −9.9 −5.8 −5.8 −7.7Host Galaxies Restricted a M α β χ 2 No. of SNepassive no −30.19 ± 0.03 0.16 ± 0.02 2.42 ± 0.16 34.46 40yes −30.23 ± 0.05 0.18 ± 0.03 2.50 ± 0.41 12.60 27star-forming no −30.10 ± 0.01 0.12 ± 0.01 3.09 ± 0.10 143.63 122yes −30.11 ± 0.02 0.16 ± 0.02 3.22 ± 0.20 94.55 89a Restricted range in allowed c and x 1 as shown in Figure 2.SN vs Host Propertiesin β varies between the full and restricted samples,ht Curve MLCS17 MLCS31 SALT SALT2which is not too surprising, as excluding the out-above three, while for passive galaxies we find valuesFig.below 6.— three. The residuals The significance around the of this best-fit difference Hubble diagram (M,α, as a β) function SF = (-30.10, of host 0.12, galaxy 3.09). stellarfit parameters for star-forming gallated from PÉGASE2). The (red) solid circles are for passive Comparing host galaxies, the top while andthe bottom (blue) lare star-forming hosts. The inclined dot–dot–dashed line els is the in Figure best–fit4, toitthese is clear data, we see while thatliers line inisthe thecolor fiducial range 3–parameter will clearly SALT2 increase fitted the model (Eqn.(M) 1) without of the best-fitted regard to the relationship host galaxyistatistical or type. error on the slope of the color law seen tween the two and clearly wrong iin Table 2. The mean slope (β) is similar for both panels (i.e., using the star-forming b
SDSS-II SN Survey z
Possible Ancillary Program‣ Spectroscopy of active SN‣ serendipitous - e.g., Krughoff et al.(2010) found 52 SN Ia in ~350,000SDSS galaxy spectra (1/6000).‣ ~1500 SN Ia near peak in 10Mgalaxy spectra (more due to largerfiber fraction).‣ target - need imaging survey (e.g.,DES+, LSST).‣ ~30+ SN Ia candidates near peakin every 3 deg 2 .4nent fits the broad and narrow emission which decreasesthe number of false positives by an order of magnitude.Fig. 3.— Comparison of the fits with only galaxy eigen spectra(blue line) and eigen spectra with a supernova template(red line) for a spectrum with significant supernova contribution(SDSS J083909.65+072431.6). The original spectrum is shown inblack. The residual supernova signal from the top pane (Observed-(Galaxy + QSO)). Note that the flux contribution from the supernovais greater than 50% that of the galaxy. The residual is shownin black with the best fit supernova template in red.(SN(GAa soandsuperespconscalcgoriclasWtheousbutiSN –densthescorrsourPrbeeningbilitandchooP (SthrebronthreInsupe
Summary‣ DESpec can:‣ measure SN host galaxy spectra of 30%+ of DES SN.‣ provide redshifts, star-formation rates, gas-phasemetallicities and possibly age and metallicities ofstellar population.‣ majority of SN galaxies too faint for 4m spectroscopy‣ (look at numbers in Main Survey)‣ perform follow-up spectroscopy of ongoing SN surveys(use ~1% of fibers).