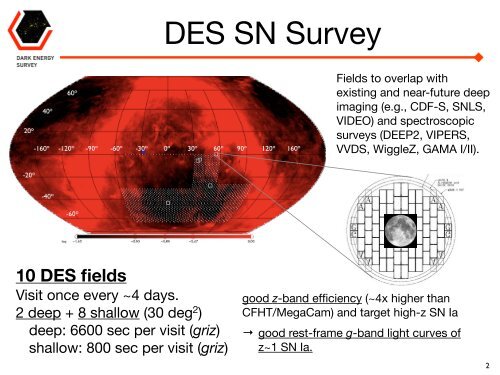
DES SN SurveySurvey Strategy I: StrategyFields to overlap withexisting and near-future deepimaging (e.g., CDF-S, SNLS,VIDEO) and spectroscopicsurveys (DEEP2, VIPERS,VVDS, Supernova WiggleZ, Fields GAMA I/II).RA DecCDF South 52.5 -27.5 deepStripe 82 55.0 0.0 deepElias S1 0.5 -43.5 wideXMM-LSS 34.5 -5.5 wideSNLS/VIRM 36.75 -4.5 wide- 1650 hexes cover the survey area = a tiling- 2 tilings/year/bandpass- 1st year has all filters, later years drop filters10 DES fieldsVisit once every ~4 days.2 deep + 8 shallow (30 deg 2 )and increase exposure timesdeep: 6600 sec per visit (griz)shallow: 800 sec per visit (griz)- exposure time in 1st year: 80 seconds- 5 SN fields- a SN field visit has- z: 10 exposures- i: 6 exposures- r: 4 exposures- g: 2 exposuresgood z-band efficiency (~4x higher thanCFHT/MegaCam) and target high-z SN Ia→- 3 deep fields, 2 shallow fieldsgood rest-frame - deep: g-band 300 sec light exposures curves ofz~1 SN Ia. - shallow: 100 sec exposures 22
SN Rates and NumbersNo. 1, 2004HIGH-REDSHIFT SUPERNOVA RATES 195dust extinction have a strong redshift-dependent effect on thederived rates. Assuming a higher extinction results in a steeperincrease with redshift of the estimated rates, as can be seenin Figure 1 by comparing the corrected and uncorrected data‣ ~0.5points.SN Ia explosions persecond in all-sky out to z~1.In summary, there are a number of possible sources forsystematic errors in our estimates; however, most errors arerelatively small, not exceeding the statistical errors. For theSNR, we estimate that the summed systematic errors shouldsmaller than the statistical, while the systematic errors maybefrom of thepeak.same order as the statistical when it comes to theSFR derived from the SNR. Since we have shown that systematicerrors are unlikely to dominate over the statistical andthat they are mostly independent of redshift, we are confidentthat the increase in SN and star formation rates that we observeare true features. The main concern is the amount of dust‣ 10 SN Ia/deg 2 within ±5 days‣ 200 SN Ia/deg 2 in 6 months‣ ~2 - 4 CC SN for every SN Iaextinction. The effects of changes in the dust extinction arefurther discussed in x 6. When we derive the SFR from theSNR, we also note that the direction of the errors is mainly toincrease the observed rates; e.g., this is the case if the lowerlimit for CC progenitor mass is larger than 8 M ,iftheIMFischanged to become less top heavy, or if the amount of dust‣ dimmer by ~2 magextinction is underestimated. No. 1, 2004We finally note that the quoted systematic 5.3. White Dwarf errors Explosion in Table Efficiency 2are sums of the 19%–25% uncertainty derived above and theuncertainty due to possible misclassification. These errors are‣ Magnitude-limited surveygives therefore a non-Gaussian. CC/Ia SN ratio of~0.3 - 0.5.Fitting the predicted model distributions of SNe Ia to theobserved sample includes determining the normalization inequation (4). This number tells us how many Type Ia SNeexplode per unit formed stellar mass. Previously in this investigation,we have made no assumptions about the massrange of Type Ia progenitor stars. If we make an assumptionconstraining the progenitor mass range, we can calculate the5.2. Type Ia Supernovva Ratesfraction of stars in this mass range that subsequently explode asSNe Ia, which we here call the efficiency ,viatherelationshipEven though the physics behind Type Ia RSNe 8 Mhave been3 Mextensively investigated using both observations ¼ (M )dMR 125 Mand theoreticalsimulations, there is still a lack of understanding of the0:1 M M (M )dM : ð5ÞHIGH-REDSHIFT SUPERNOVA RATES 197Fig. 2.—Type Ia SNRs from GOODS at hzi ¼ 0:40, 0.80, 1.20, and 1.60are shown as filled circles. Also plotted are rates at z 0:01 from Cappellaroet al. (1999; filled square), at z 0:1 from Hardin et al.Dahlen(2000; openet star),al.atz 0:11 from Strolger (2003; filled star), at z 0:11 from Reiss (2000; open(2004)triangle), at z 0:38 from Pain et al. (1996; open square), at z 0:46 fromTonry et al. (2003; open circle), and at z 0:55 from Pain et al. (2002; filledtriangle). Vertical error bars on the GOODS rates represent statistical errors,while horizontal error bars represent bin size. See text for discussion onsystematic errors. The figure also shows predicted Ia rates based on threedifferent models for the delay time distribution of SN Ia progenitors.