Masao Sako (Penn)
Masao Sako (Penn)
Masao Sako (Penn)

You also want an ePaper? Increase the reach of your titles
YUMPU automatically turns print PDFs into web optimized ePapers that Google loves.
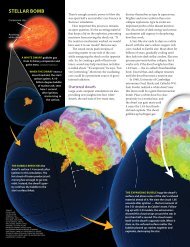
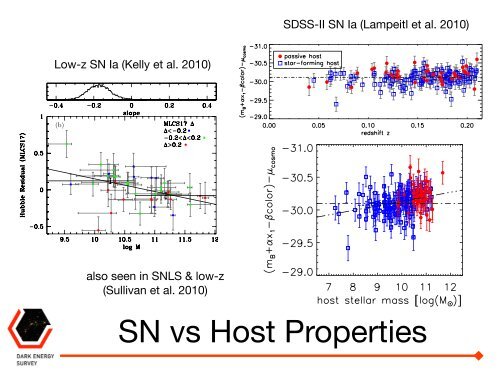
SDSS-II SN Ia (Lampeitl et al. 2010)Low-z SN Ia (Kelly et al. 2010)Y ET AL. Vol. 715(b)Fig. 3.— The Hubble residuals as a function of redshift. The open blue squares denote SNe Ia ingalaxies, while the solid red circles are SNe Ia in passive galaxies. The dashed line is the refermagnitude fit to the whole sample regardless of host galaxy type. We find SNe Ia in passiveare ≃ 0.1 magnitudes brighter than in star–forming hosts even after light curve fitting.Table 2Best fit values for M,α, β as a function of host galaxy typenel (a) plots the asinh magnitude i ′ surface brightness in a 0.2 kpc aperture at the SNated by the dashed horizontal line. The surface brightness distribution of SN locationscorrelation between Hubble residual and host mass exists for these SNe that occur inalso seen in SNLS & low-zlikely to be responsible for the observed trends in Hubble residuals with host galaxyable 12e Information Criteria(Sullivan et al. 2010)... 0 0 0 0/s/x 1 −3.7 −1.0 −4.6 −2.0/s/x 1 −10.3 −6.3 −9.8 −7.4/s/x 1 −9.9 −5.8 −5.8 −7.7Host Galaxies Restricted a M α β χ 2 No. of SNepassive no −30.19 ± 0.03 0.16 ± 0.02 2.42 ± 0.16 34.46 40yes −30.23 ± 0.05 0.18 ± 0.03 2.50 ± 0.41 12.60 27star-forming no −30.10 ± 0.01 0.12 ± 0.01 3.09 ± 0.10 143.63 122yes −30.11 ± 0.02 0.16 ± 0.02 3.22 ± 0.20 94.55 89a Restricted range in allowed c and x 1 as shown in Figure 2.SN vs Host Propertiesin β varies between the full and restricted samples,ht Curve MLCS17 MLCS31 SALT SALT2which is not too surprising, as excluding the out-above three, while for passive galaxies we find valuesFig.below 6.— three. The residuals The significance around the of this best-fit difference Hubble diagram (M,α, as a β) function SF = (-30.10, of host 0.12, galaxy 3.09). stellarfit parameters for star-forming gallated from PÉGASE2). The (red) solid circles are for passive Comparing host galaxies, the top while andthe bottom (blue) lare star-forming hosts. The inclined dot–dot–dashed line els is the in Figure best–fit4, toitthese is clear data, we see while thatliers line inisthe thecolor fiducial range 3–parameter will clearly SALT2 increase fitted the model (Eqn.(M) 1) without of the best-fitted regard to the relationship host galaxyistatistical or type. error on the slope of the color law seen tween the two and clearly wrong iin Table 2. The mean slope (β) is similar for both panels (i.e., using the star-forming b