- Page 2 and 3:
Data CompressionThird Edition
- Page 5 and 6:
David SalomonData CompressionThe Co
- Page 7 and 8:
To the many readers, whose question
- Page 9 and 10:
viiiPreface to the Third Editionthe
- Page 11 and 12:
xPreface to the Third Editionhttp:/
- Page 13 and 14:
xiiPreface to the Second EditionThe
- Page 15 and 16:
xivPreface to the Second Editionema
- Page 17 and 18:
xviAcknowledgmentsPreface to the Fi
- Page 19 and 20:
xviiiContents3 Dictionary Methods 1
- Page 21 and 22:
xxContents6 Video Compression 6376.
- Page 23 and 24:
2 Introductionstream) that has a sm
- Page 25 and 26:
4 Introductionalready compressed an
- Page 27 and 28:
6 IntroductionChar. Freq. Prob. Cha
- Page 29 and 30:
8 IntroductionThe Gold BugHere, the
- Page 31 and 32:
10 Introductiondecoder, which is no
- Page 33 and 34:
12 IntroductionName Size Descriptio
- Page 35 and 36:
14 Introductionhttp://www.hn.is.uec
- Page 37 and 38:
16 1. Basic TechniquesA B C D E•
- Page 39 and 40:
18 1. Basic TechniquesBits Bit posi
- Page 41 and 42:
20 1. Basic Techniquesaaaardvark 1a
- Page 43 and 44:
22 1. Basic TechniquesChar. count C
- Page 45 and 46:
24 1. Basic TechniquesThere are thr
- Page 47 and 48:
26 1. Basic Techniquesrow by row, l
- Page 49 and 50:
28 1. Basic Techniquesby examining
- Page 51 and 52:
30 1. Basic Techniques1.4.2 Conditi
- Page 53 and 54:
32 1. Basic Techniquesconsider the
- Page 55 and 56:
34 1. Basic Techniques⋄ Exercise
- Page 57 and 58:
36 1. Basic Techniquescontain codes
- Page 59 and 60:
38 1. Basic Techniquesthe␣boy␣o
- Page 61 and 62:
40 1. Basic Techniques16 units dist
- Page 63 and 64:
This page intentionally left blank
- Page 65 and 66:
44 2. Statistical Methodsso that la
- Page 67 and 68:
46 2. Statistical Methods(Actually,
- Page 69 and 70:
48 2. Statistical MethodsYou have t
- Page 71 and 72:
50 2. Statistical Methods2.2 Variab
- Page 73 and 74:
52 2. Statistical MethodsIt is also
- Page 75 and 76:
54 2. Statistical Methodsn Unary B(
- Page 77 and 78:
56 2. Statistical MethodsNumber Bas
- Page 79 and 80:
58 2. Statistical MethodsAs n grows
- Page 81 and 82:
60 2. Statistical Methods12 values
- Page 83 and 84:
62 2. Statistical Methodsm ≥ 1log
- Page 85 and 86:
64 2. Statistical Methodsunary code
- Page 87 and 88:
66 2. Statistical Methodsgreater th
- Page 89 and 90:
68 2. Statistical MethodsProb. Step
- Page 91 and 92:
70 2. Statistical Methods230303018
- Page 93 and 94:
72 2. Statistical Methods000 E .130
- Page 95 and 96:
74 2. Statistical Methods123410102.
- Page 97 and 98:
76 2. Statistical MethodsAnswer 1.
- Page 99 and 100:
78 2. Statistical Methods1.0.551.0.
- Page 101 and 102:
80 2. Statistical Methodscodes, whi
- Page 103 and 104:
82 2. Statistical Methodsmay have t
- Page 105 and 106:
84 2. Statistical Methods2.9 Adapti
- Page 107 and 108:
86 2. Statistical MethodsTherefore,
- Page 109 and 110:
88 2. Statistical MethodsA simple e
- Page 111 and 112:
90 2. Statistical Methods2.9.6 Vitt
- Page 113 and 114:
92 2. Statistical Methodsthe algori
- Page 115 and 116:
94 2. Statistical Methods0000000000
- Page 117 and 118:
96 2. Statistical Methodscounts) is
- Page 119 and 120:
98 2. Statistical Methods1904. The
- Page 121 and 122:
100 2. Statistical MethodsScan Pels
- Page 123 and 124:
102 2. Statistical Methods(a)White
- Page 125 and 126:
104 2. Statistical Methodsline [(b
- Page 127 and 128:
106 2. Statistical Methodsencoder a
- Page 129 and 130:
108 2. Statistical MethodsReference
- Page 131 and 132:
110 2. Statistical MethodsA theory
- Page 133 and 134:
112 2. Statistical MethodsX. Table
- Page 135 and 136:
114 2. Statistical MethodsChar. Cod
- Page 137 and 138:
116 2. Statistical Methods1 2 3 4 5
- Page 139 and 140:
118 2. Statistical Methods1 2 3 4 5
- Page 141 and 142:
120 2. Statistical Methodstherefore
- Page 143 and 144:
122 2. Statistical Methodsa 8 a 2 a
- Page 145 and 146:
124 2. Statistical Methods2.16 The
- Page 147 and 148:
126 2. Statistical MethodsSymbol C
- Page 149 and 150:
128 2. Statistical MethodsRenormali
- Page 151 and 152:
130 2. Statistical MethodsStep 1: C
- Page 153 and 154:
132 2. Statistical MethodsQe Hex Ne
- Page 155 and 156:
134 2. Statistical Methods2.18 PPMT
- Page 157 and 158:
136 2. Statistical MethodsA Quotati
- Page 159 and 160:
138 2. Statistical Methods2.18.1 PP
- Page 161 and 162:
140 2. Statistical Methodsin the pr
- Page 163 and 164:
142 2. Statistical Methodsprobabili
- Page 165 and 166:
144 2. Statistical Methodsnot get i
- Page 167 and 168:
146 2. Statistical Methodsz,1 x,1 z
- Page 169 and 170:
148 2. Statistical Methodsa,2 i,1 n
- Page 171 and 172:
150 2. Statistical Methods987Bits p
- Page 173 and 174:
152 2. Statistical Methodsinterval
- Page 175 and 176:
154 2. Statistical Methodssparse, c
- Page 177 and 178:
156 2. Statistical Methods2.19 Cont
- Page 179 and 180:
158 2. Statistical MethodsExample:
- Page 181 and 182:
160 2. Statistical Methodsare the s
- Page 183 and 184:
162 2. Statistical Methods(5,3)P e
- Page 185 and 186:
This page intentionally left blank
- Page 187 and 188:
166 3. Dictionary MethodsExample: A
- Page 189 and 190:
168 3. Dictionary MethodsString Pro
- Page 191 and 192:
170 3. Dictionary MethodsThe encode
- Page 193 and 194:
172 3. Dictionary Methodssophistica
- Page 195 and 196:
174 3. Dictionary MethodsNotice the
- Page 197 and 198:
176 3. Dictionary Methodswould be m
- Page 199 and 200:
178 3. Dictionary Methods3.6 QIC-12
- Page 201 and 202:
180 3. Dictionary MethodsTable 3.8
- Page 203 and 204:
182 3. Dictionary Methodsbetween th
- Page 205 and 206:
184 3. Dictionary MethodsCOPY also
- Page 207 and 208:
186 3. Dictionary Methodsconcatenat
- Page 209 and 210:
188 3. Dictionary Methodsnew data t
- Page 211 and 212:
190 3. Dictionary Methods1. A liter
- Page 213 and 214:
192 3. Dictionary MethodsThe leftmo
- Page 215 and 216:
194 3. Dictionary MethodsTests done
- Page 217 and 218:
196 3. Dictionary MethodsI is in th
- Page 219 and 220:
198 3. Dictionary Methods0 NULL 110
- Page 221 and 222:
200 3. Dictionary Methodseach node
- Page 223 and 224:
202 3. Dictionary Methodsdictionary
- Page 225 and 226:
204 3. Dictionary MethodsOnce the r
- Page 227 and 228:
206 3. Dictionary Methods3.14 LZMWT
- Page 229 and 230:
208 3. Dictionary Methodsrealize th
- Page 231 and 232:
210 3. Dictionary MethodsRepeatInpu
- Page 233 and 234:
212 3. Dictionary MethodsIndex Tabl
- Page 235 and 236:
214 3. Dictionary Methods0 170 17HH
- Page 237 and 238:
216 3. Dictionary Methodsused to pr
- Page 239 and 240:
218 3. Dictionary Methodsso H is a
- Page 241 and 242:
220 3. Dictionary MethodsOnce in th
- Page 243 and 244:
222 3. Dictionary Methodsmethod of
- Page 245 and 246:
224 3. Dictionary MethodsLHArc, fro
- Page 247 and 248:
226 3. Dictionary Methodsliteral/le
- Page 249 and 250:
228 3. Dictionary MethodsExtra Extr
- Page 251 and 252:
230 3. Dictionary Methods2. When se
- Page 253 and 254:
232 3. Dictionary Methodstends to h
- Page 255 and 256:
234 3. Dictionary Methods3.23.3 The
- Page 257 and 258:
236 3. Dictionary Methodsdesigned b
- Page 259 and 260:
238 3. Dictionary Methods1 6 4 6 2
- Page 261 and 262:
240 3. Dictionary Methodsfunction P
- Page 263 and 264:
242 3. Dictionary Methodscompressor
- Page 265 and 266:
244 3. Dictionary MethodsExamples:
- Page 267 and 268:
246 3. Dictionary Methods3.28 Summa
- Page 269 and 270:
248 3. Dictionary Methodswhere in t
- Page 271 and 272:
250 3. Dictionary Methodsthese prob
- Page 273 and 274:
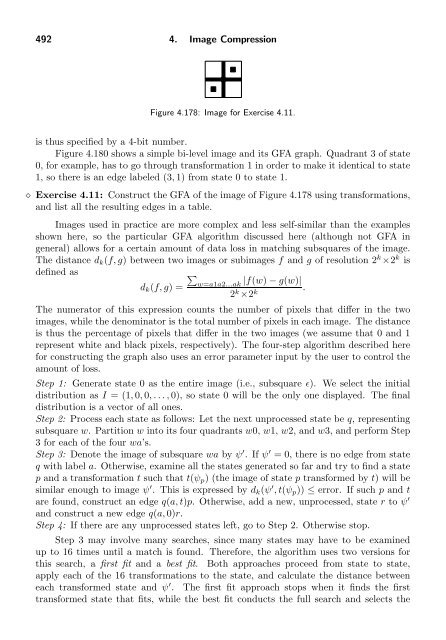
252 4. Image Compression1. A bi-lev
- Page 275 and 276:
254 4. Image CompressionHow should
- Page 277 and 278:
256 4. Image Compression(a)(b)Figur
- Page 279 and 280:
258 4. Image Compression55101015152
- Page 281 and 282:
260 4. Image CompressionThis approa
- Page 283 and 284:
262 4. Image CompressionA good exam
- Page 285 and 286:
264 4. Image Compression43210 Gray
- Page 287 and 288:
266 4. Image Compression(2)(1)Binar
- Page 289 and 290:
268 4. Image Compression(8)(7)(6)Bi
- Page 291 and 292:
270 4. Image Compression(a)(b)Figur
- Page 293 and 294:
272 4. Image CompressionTypical PSN
- Page 295 and 296:
274 4. Image Compression4.3.2 Quant
- Page 297 and 298:
276 4. Image Compression25512800128
- Page 299 and 300:
278 4. Image CompressionExample. Gi
- Page 301 and 302:
280 4. Image Compression(or transfo
- Page 303 and 304:
282 4. Image Compression4.5.1 Two-D
- Page 305 and 306:
284 4. Image Compressioneach image
- Page 307 and 308:
286 4. Image CompressionBefore we d
- Page 309 and 310:
288 4. Image Compressioncausing the
- Page 311 and 312:
290 4. Image Compression4.6.1 Intro
- Page 313 and 314:
292 4. Image Compressionless import
- Page 315 and 316:
294 4. Image Compression4. Each vec
- Page 317 and 318:
296 4. Image Compression00 10 20 30
- Page 319 and 320:
298 4. Image Compression% 8x8 corre
- Page 321 and 322:
300 4. Image Compressionindicate th
- Page 323 and 324:
302 4. Image Compression21.510.510.
- Page 325 and 326:
304 4. Image CompressionFigure 4.43
- Page 327 and 328:
306 4. Image Compression10011101110
- Page 329 and 330:
308 4. Image CompressionEach of mat
- Page 331 and 332:
310 4. Image Compressionk scale DCT
- Page 333 and 334:
312 4. Image Compression1. Regardle
- Page 335 and 336:
314 4. Image Compression⎡⎤1 0 0
- Page 337 and 338:
316 4. Image Compressionfour DCT co
- Page 339 and 340:
318 4. Image Compression4.6.9 Vecto
- Page 341 and 342:
320 4. Image Compressionthe importa
- Page 343 and 344:
322 4. Image Compressionsin θ =
- Page 345 and 346:
324 4. Image CompressionN=8;m=[1:N]
- Page 347 and 348:
326 4. Image CompressionFigure 4.57
- Page 349 and 350:
328 4. Image CompressionFigure 4.61
- Page 351 and 352:
330 4. Image Compressionworks on ea
- Page 353 and 354:
332 4. Image Compression1024=8×128
- Page 355 and 356:
334 4. Image CompressionY = (77/256
- Page 357 and 358:
336 4. Image Compression16 11 10 16
- Page 359 and 360:
338 4. Image Compression11111111111
- Page 361 and 362:
340 4. Image CompressionZ0123456789
- Page 363 and 364:
342 4. Image Compression4.8.5 Lossl
- Page 365 and 366:
344 4. Image CompressionValue Name
- Page 367 and 368:
346 4. Image Compression4.9 JPEG-LS
- Page 369 and 370:
348 4. Image Compressionif(Rc>=max(
- Page 371 and 372:
350 4. Image CompressionPrediction
- Page 373 and 374:
352 4. Image Compressionbits of 1,
- Page 375 and 376:
354 4. Image CompressionFigure 4.83
- Page 377 and 378:
356 4. Image Compressionnumbers and
- Page 379 and 380:
358 4. Image CompressionThe decoder
- Page 381 and 382:
360 4. Image CompressionS(a)1 1 11
- Page 383 and 384:
362 4. Image Compressionthe values
- Page 385 and 386:
364 4. Image CompressionM x ,M y ·
- Page 387 and 388:
366 4. Image CompressionAdeBf-11-32
- Page 389 and 390:
368 4. Image Compressionlow-resolut
- Page 391 and 392:
370 4. Image Compression2. Special
- Page 393 and 394:
372 4. Image Compression1. Text reg
- Page 395 and 396:
374 4. Image CompressionName Type S
- Page 397 and 398:
376 4. Image Compressionit sets USE
- Page 399 and 400:
378 4. Image Compressionsine of θ,
- Page 401 and 402:
380 4. Image Compressionreads segme
- Page 403 and 404:
382 4. Image Compressionthey consti
- Page 405 and 406:
384 4. Image CompressionStep 0: Sel
- Page 407 and 408:
386 4. Image Compression24022020018
- Page 409 and 410:
388 4. Image Compression24022020018
- Page 411 and 412:
390 4. Image Compression255(0x...,1
- Page 413 and 414:
392 4. Image CompressionThe remaind
- Page 415 and 416:
394 4. Image Compressionthis third
- Page 417 and 418:
396 4. Image Compressionleftmost pi
- Page 419 and 420:
398 4. Image Compressionk : 2 3 4 5
- Page 421 and 422:
400 4. Image Compressionthe block.
- Page 423 and 424:
402 4. Image Compression15Compressi
- Page 425 and 426:
404 4. Image Compressionthe first t
- Page 427 and 428:
406 4. Image CompressionSince 10011
- Page 429 and 430:
408 4. Image Compressionas 2 or 3).
- Page 431 and 432:
410 4. Image CompressionPixel Regio
- Page 433 and 434:
412 4. Image CompressionFigure 4.12
- Page 435 and 436:
414 4. Image CompressionThe encoder
- Page 437 and 438:
416 4. Image CompressionWhat we kno
- Page 439 and 440:
418 4. Image CompressionxV 0 2 4 6
- Page 441 and 442:
420 4. Image Compressionbe used, af
- Page 443 and 444:
422 4. Image Compressionf). This is
- Page 445 and 446:
424 4. Image Compressionα1−α0 1
- Page 447 and 448:
426 4. Image CompressionOne critica
- Page 449 and 450:
428 4. Image Compression-0.051/61/6
- Page 451 and 452:
430 4. Image CompressionThe prefix
- Page 453 and 454:
432 4. Image Compressionsin(t) : 0
- Page 455 and 456:
434 4. Image CompressionFigure 4.14
- Page 457 and 458:
436 4. Image CompressionAdaptive DP
- Page 459 and 460:
438 4. Image CompressionA copied bl
- Page 461 and 462: 440 4. Image Compressionsearch may
- Page 463 and 464: 442 4. Image Compression4. A softwa
- Page 465 and 466: 444 4. Image Compressionprediction
- Page 467 and 468: 446 4. Image Compressiondevelopers
- Page 469 and 470: 448 4. Image Compressionquantizatio
- Page 471 and 472: 450 4. Image CompressionIt’s easy
- Page 473 and 474: 452 4. Image CompressionThis is the
- Page 475 and 476: 454 4. Image Compressionv 1+v 2v 2v
- Page 477 and 478: 456 4. Image Compressionand prepare
- Page 479 and 480: 458 4. Image Compressionm2 0 cells
- Page 481 and 482: 460 4. Image Compression0,255115,25
- Page 483 and 484: 462 4. Image Compressionvalues (whi
- Page 485 and 486: 464 4. Image Compressionexample. Fi
- Page 487 and 488: 466 4. Image Compressionan operatio
- Page 489 and 490: 468 4. Image Compression00000000100
- Page 491 and 492: 470 4. Image CompressionMatrix M 5
- Page 493 and 494: 472 4. Image CompressionExample: A
- Page 495 and 496: 474 4. Image Compression(0,0), (0,1
- Page 497 and 498: 476 4. Image Compression12 3 4 5 6
- Page 499 and 500: 478 4. Image Compressiona 2-digit s
- Page 501 and 502: 480 4. Image CompressionNotice that
- Page 503 and 504: 482 4. Image CompressionThe second
- Page 505 and 506: 484 4. Image Compressiondim=256;for
- Page 507 and 508: 486 4. Image CompressionOn the othe
- Page 509 and 510: 488 4. Image Compression(size A), t
- Page 511: 490 4. Image CompressionOne result
- Page 515 and 516: 494 4. Image Compressionstate and t
- Page 517 and 518: 496 4. Image Compressionscaling. If
- Page 519 and 520: 498 4. Image CompressionThe Golden
- Page 521 and 522: 500 4. Image CompressionIn general,
- Page 523 and 524: 502 4. Image Compressiona b c d m n
- Page 525 and 526: 504 4. Image Compression(a)TT T TTT
- Page 527 and 528: 506 4. Image Compression4.35.7 IFS
- Page 529 and 530: 508 4. Image CompressionThis is don
- Page 531 and 532: 510 4. Image Compressiont:=some def
- Page 533 and 534: 512 4. Image Compressionscanned cel
- Page 535 and 536: 514 5. Wavelet MethodsFigure 5.1 sh
- Page 537 and 538: 516 5. Wavelet MethodsThe spectrum
- Page 539 and 540: 518 5. Wavelet Methodsπ−ππ/2
- Page 541 and 542: 520 5. Wavelet Methodsππ/2−2π2
- Page 543 and 544: 522 5. Wavelet Methodstoo small for
- Page 545 and 546: 524 5. Wavelet Methods5.5 The CWT a
- Page 547 and 548: 526 5. Wavelet Methodstranslation p
- Page 549 and 550: 528 5. Wavelet Methodsare almost mi
- Page 551 and 552: 530 5. Wavelet MethodsWhen looking
- Page 553 and 554: 532 5. Wavelet Methodsinterchangeab
- Page 555 and 556: 534 5. Wavelet Methodsprocedure NWT
- Page 557 and 558: 536 5. Wavelet Methodsprocedure Std
- Page 559 and 560: 538 5. Wavelet Methodshorizontal li
- Page 561 and 562: 540 5. Wavelet MethodsThe discrete
- Page 563 and 564:
542 5. Wavelet Methods255 224 192 1
- Page 565 and 566:
544 5. Wavelet Methods0020204040606
- Page 567 and 568:
546 5. Wavelet MethodsAnd just like
- Page 569 and 570:
548 5. Wavelet Methodsof the image
- Page 571 and 572:
550 5. Wavelet Methodsprocess where
- Page 573 and 574:
552 5. Wavelet Methodsand the new d
- Page 575 and 576:
554 5. Wavelet MethodsFrom the Dict
- Page 577 and 578:
556 5. Wavelet MethodsThe vector x
- Page 579 and 580:
558 5. Wavelet Methodsand rules 3-5
- Page 581 and 582:
560 5. Wavelet Methodsuse any set o
- Page 583 and 584:
562 5. Wavelet Methodsfunction wc1=
- Page 585 and 586:
564 5. Wavelet Methodsfunction dat=
- Page 587 and 588:
566 5. Wavelet Methodsfunction dat=
- Page 589 and 590:
568 5. Wavelet Methods-.10714890141
- Page 591 and 592:
570 5. Wavelet Methods0.060.040.020
- Page 593 and 594:
572 5. Wavelet Methods5.9 Multireso
- Page 595 and 596:
574 5. Wavelet Methodsfilters and c
- Page 597 and 598:
576 5. Wavelet MethodsOriginalimage
- Page 599 and 600:
578 5. Wavelet MethodsTemporary LOr
- Page 601 and 602:
580 5. Wavelet Methodsapplications.
- Page 603 and 604:
582 5. Wavelet MethodsThe update op
- Page 605 and 606:
584 5. Wavelet Methodscalculate a d
- Page 607 and 608:
586 5. Wavelet Methods−1/2d j−1
- Page 609 and 610:
588 5. Wavelet Methodsgroup of its
- Page 611 and 612:
590 5. Wavelet Methodsimplying that
- Page 613 and 614:
592 5. Wavelet Methodsexcept the fi
- Page 615 and 616:
594 5. Wavelet Methodshave small va
- Page 617 and 618:
596 5. Wavelet Methodsconstraints a
- Page 619 and 620:
598 5. Wavelet MethodsSPIHT was des
- Page 621 and 622:
600 5. Wavelet Methodsbut this is c
- Page 623 and 624:
602 5. Wavelet Methodsnumber of tes
- Page 625 and 626:
604 5. Wavelet MethodsFigure 5.60 s
- Page 627 and 628:
606 5. Wavelet MethodsThe bits S n
- Page 629 and 630:
608 5. Wavelet Methodsand TCQ (arit
- Page 631 and 632:
610 5. Wavelet Methodsa coefficient
- Page 633 and 634:
612 5. Wavelet Methods5.16.1 Exampl
- Page 635 and 636:
614 5. Wavelet MethodsDjVu routinel
- Page 637 and 638:
616 5. Wavelet Methodsground colors
- Page 639 and 640:
618 5. Wavelet Methodsfilter coeffi
- Page 641 and 642:
620 5. Wavelet MethodsThe final sta
- Page 643 and 644:
622 5. Wavelet MethodsCodeIndex or
- Page 645 and 646:
624 5. Wavelet Methodsaccess the co
- Page 647 and 648:
626 5. Wavelet Methodsstep of the J
- Page 649 and 650:
628 5. Wavelet Methods←−−−
- Page 651 and 652:
630 5. Wavelet Methodshelps in (1)
- Page 653 and 654:
632 5. Wavelet Methodsin this bitpl
- Page 655 and 656:
634 5. Wavelet MethodsLL and LH Sub
- Page 657 and 658:
This page intentionally left blank
- Page 659 and 660:
638 6. Video Compression6.1.1 The C
- Page 661 and 662:
640 6. Video Compressionof vertical
- Page 663 and 664:
642 6. Video Compression1/60 0P3438
- Page 665 and 666:
644 6. Video Compressionwhose inver
- Page 667 and 668:
646 6. Video CompressionFramePixelA
- Page 669 and 670:
648 6. Video CompressionIn addition
- Page 671 and 672:
650 6. Video Compressionencoder can
- Page 673 and 674:
652 6. Video Compressionand trees a
- Page 675 and 676:
654 6. Video CompressionSuboptimal
- Page 677 and 678:
656 6. Video Compression+6+4+20−2
- Page 679 and 680:
658 6. Video CompressionTwo-Dimensi
- Page 681 and 682:
660 6. Video Compressionsmaller blo
- Page 683 and 684:
662 6. Video Compressionand a refre
- Page 685 and 686:
664 6. Video CompressionLuminance(a
- Page 687 and 688:
666 6. Video Compressionwhere the f
- Page 689 and 690:
668 6. Video CompressionY 1 Y 2Y 1
- Page 691 and 692:
670 6. Video Compression0/1 1s (fir
- Page 693 and 694:
672 6. Video Compressioncode of (0,
- Page 695 and 696:
674 6. Video CompressionCode height
- Page 697 and 698:
676 6. Video CompressionCode pictur
- Page 699 and 700:
678 6. Video Compressioncbp cbp blo
- Page 701 and 702:
680 6. Video CompressionA P picture
- Page 703 and 704:
682 6. Video CompressionHeader para
- Page 705 and 706:
684 6. Video Compressionespecially
- Page 707 and 708:
686 6. Video CompressionDelivery. T
- Page 709 and 710:
688 6. Video CompressionAudio codin
- Page 711 and 712:
690 6. Video Compression3604352acti
- Page 713 and 714:
692 7. Audio Compression7.1 SoundTo
- Page 715 and 716:
694 7. Audio CompressionP = I · V
- Page 717 and 718:
696 7. Audio Compressionsound wave
- Page 719 and 720:
698 7. Audio Compressionbit samples
- Page 721 and 722:
700 7. Audio Compression800 KHz. Th
- Page 723 and 724:
702 7. Audio Compression7.3.1 Conve
- Page 725 and 726:
704 7. Audio Compressionand (7.2).
- Page 727 and 728:
706 7. Audio Compression12811296255
- Page 729 and 730:
708 7. Audio Compressiony outputy o
- Page 731 and 732:
710 7. Audio Compression7.5 ADPCM A
- Page 733 and 734:
712 7. Audio Compressionas a functi
- Page 735 and 736:
714 7. Audio Compressionthree bitsq
- Page 737 and 738:
716 7. Audio Compressionmost-signif
- Page 739 and 740:
718 7. Audio Compressionpitch and l
- Page 741 and 742:
720 7. Audio Compression7.7.2 Wavef
- Page 743 and 744:
722 7. Audio CompressionThe main eq
- Page 745 and 746:
724 7. Audio CompressionThe gain pa
- Page 747 and 748:
726 7. Audio CompressionA zeroth-or
- Page 749 and 750:
728 7. Audio Compressioncode, which
- Page 751 and 752:
730 7. Audio Compressionand techniq
- Page 753 and 754:
732 7. Audio Compressioncoder and d
- Page 755 and 756:
734 7. Audio Compressioni C i i C i
- Page 757 and 758:
736 7. Audio Compressionbuffer hold
- Page 759 and 760:
738 7. Audio CompressionFor layers
- Page 761 and 762:
740 7. Audio CompressionIndex scale
- Page 763 and 764:
742 7. Audio Compressionbit 4-bit n
- Page 765 and 766:
744 7. Audio CompressionFramesequen
- Page 767 and 768:
746 7. Audio Compression32 subbands
- Page 769 and 770:
748 7. Audio Compressiontwo psychoa
- Page 771 and 772:
750 7. Audio Compressiongiven bycs
- Page 773 and 774:
752 7. Audio CompressionThe largest
- Page 775 and 776:
This page intentionally left blank
- Page 777 and 778:
756 8. Other Methodsinto an image t
- Page 779 and 780:
758 8. Other Methodslexicographic o
- Page 781 and 782:
760 8. Other MethodsL A Code C A Ls
- Page 783 and 784:
762 8. Other Methods# of guesses: 1
- Page 785 and 786:
764 8. Other Methods2. It has been
- Page 787 and 788:
766 8. Other MethodsWhile text is i
- Page 789 and 790:
768 8. Other Methods...s|wiss␣mis
- Page 791 and 792:
770 8. Other Methods...your␣|swis
- Page 793 and 794:
772 8. Other Methodscontext file. T
- Page 795 and 796:
774 8. Other MethodsEquation (8.2).
- Page 797 and 798:
776 8. Other MethodsS[1 ...0] = λS
- Page 799 and 800:
778 8. Other Methodssuch a drawing
- Page 801 and 802:
780 8. Other Methodsand subtract8.5
- Page 803 and 804:
782 8. Other Methodsthat the probab
- Page 805 and 806:
784 8. Other MethodsThis section an
- Page 807 and 808:
786 8. Other Methodstoken is a pref
- Page 809 and 810:
788 8. Other Methodsinto a three-di
- Page 811 and 812:
790 8. Other MethodsThe LZW algorit
- Page 813 and 814:
792 8. Other MethodsS:=empty string
- Page 815 and 816:
794 8. Other Methodsimage, since it
- Page 817 and 818:
796 8. Other MethodsMark: A visible
- Page 819 and 820:
798 8. Other Methodsthe index is ba
- Page 821 and 822:
800 8. Other MethodsA finite-state
- Page 823 and 824:
802 8. Other MethodsThe DMC algorit
- Page 825 and 826:
804 8. Other MethodsThis suggests t
- Page 827 and 828:
806 8. Other Methods10 2 5 00 01011
- Page 829 and 830:
808 8. Other MethodsThe main princi
- Page 831 and 832:
810 8. Other Methods×ZS 1S 2×YPX
- Page 833 and 834:
812 8. Other Methodswhere it compre
- Page 835 and 836:
814 8. Other MethodsNew symbol the
- Page 837 and 838:
816 8. Other Methodsthe pair (1, 2)
- Page 839 and 840:
818 8. Other Methodsregions, each w
- Page 841 and 842:
820 8. Other Methods5. The half-edg
- Page 843 and 844:
822 8. Other MethodsH=H|C;% append
- Page 845 and 846:
824 8. Other Methodsis the number o
- Page 847 and 848:
826 8. Other MethodsC C R R R S L C
- Page 849 and 850:
828 8. Other MethodsThe Unicode Sta
- Page 851 and 852:
830 8. Other Methodsmode). The tags
- Page 853 and 854:
832 8. Other MethodsThe encoder the
- Page 855 and 856:
This page intentionally left blank
- Page 857 and 858:
836 BibliographyBanister, Brian, an
- Page 859 and 860:
838 BibliographyCormack G. V., and
- Page 861 and 862:
840 BibliographyFrank, Amalie J., J
- Page 863 and 864:
842 BibliographyNorwell, MA, 85-112
- Page 865 and 866:
844 BibliographyLangdon, Glen G. (1
- Page 867 and 868:
846 BibliographyNahin, Paul J., (19
- Page 869 and 870:
848 BibliographyRFC1950 (1996) ZLIB
- Page 871 and 872:
850 BibliographyStarck, J. L., F. M
- Page 873 and 874:
852 BibliographyWilliams, Ross N. (
- Page 875 and 876:
This page intentionally left blank
- Page 877 and 878:
856 GlossaryASCII Code. The standar
- Page 879 and 880:
858 GlossaryCircular Queue. A basic
- Page 881 and 882:
860 Glossaryfunction (which has to
- Page 883 and 884:
862 Glossarybackground is a continu
- Page 885 and 886:
864 GlossaryGolomb Code. The Golomb
- Page 887 and 888:
866 GlossaryJBIG2. A recent interna
- Page 889 and 890:
868 GlossaryLifting Scheme. A metho
- Page 891 and 892:
870 GlossaryMPEG. This acronym stan
- Page 893 and 894:
872 GlossaryQM Coder. This is the a
- Page 895 and 896:
874 GlossaryStatistical Methods. Th
- Page 897 and 898:
876 Glossaryredundancy. A typical t
- Page 899 and 900:
This page intentionally left blank
- Page 901 and 902:
880 IndexAES, see association of au
- Page 903 and 904:
882 Indexcodec, 7, 858codesASCII, 8
- Page 905 and 906:
884 Indexlists, 860queues, 172, 860
- Page 907 and 908:
886 Indexcausal, 553deriving coeffi
- Page 909 and 910:
888 IndexIMA ADPCM compression, 436
- Page 911 and 912:
890 Indexas the information functio
- Page 913 and 914:
892 Indexvertical, 244parrots (imag
- Page 915 and 916:
894 IndexReynolds, Paul, 167RGB col
- Page 917 and 918:
896 Indexterabyte, 616textcase flat
- Page 919 and 920:
898 IndexD4, 551, 558, 560D8, 558di


![Slide Kuliah PBO [1]](https://img.yumpu.com/50749096/1/190x245/slide-kuliah-pbo-1.jpg?quality=85)

![Slide Kuliah PBO [1]](https://img.yumpu.com/49268027/1/190x245/slide-kuliah-pbo-1.jpg?quality=85)