Marna Kearney - tips
Marna Kearney - tips
Marna Kearney - tips

You also want an ePaper? Increase the reach of your titles
YUMPU automatically turns print PDFs into web optimized ePapers that Google loves.
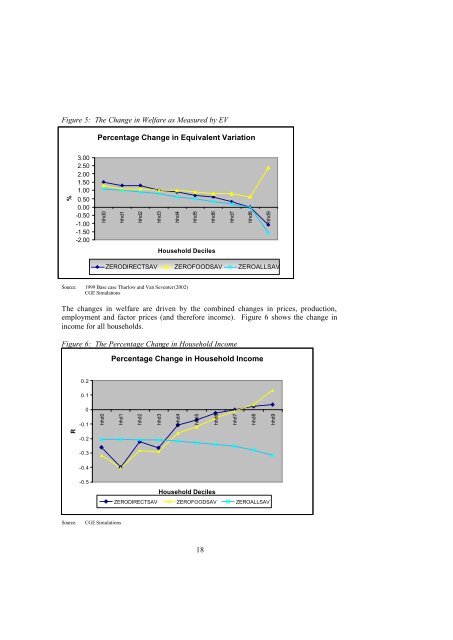
Figure 5: The Change in Welfare as Measured by EVPercentage Change in Equivalent Variation%3.002.502.001.501.000.500.00-0.50-1.00-1.50-2.00hhd0hhd1hhd2hhd3hhd4hhd5hhd6hhd7hhd8hhd9Household DecilesZERODIRECTSAV ZEROFOODSAV ZEROALLSAVSource: 1999 Base case Thurlow and Van Seventer (2002)CGE SimulationsThe changes in welfare are driven by the combined changes in prices, production,employment and factor prices (and therefore income). Figure 6 shows the change inincome for all households.Figure 6: The Percentage Change in Household IncomePercentage Change in Household Income0.20.10-0.1hhd0hhd1hhd2hhd3hhd4hhd5hhd6hhd7hhd8hhd9R-0.2-0.3-0.4-0.5Household DecilesZERODIRECTSAV ZEROFOODSAV ZEROALLSAVSource:CGE Simulations18