Marna Kearney - tips
Marna Kearney - tips
Marna Kearney - tips
You also want an ePaper? Increase the reach of your titles
YUMPU automatically turns print PDFs into web optimized ePapers that Google loves.
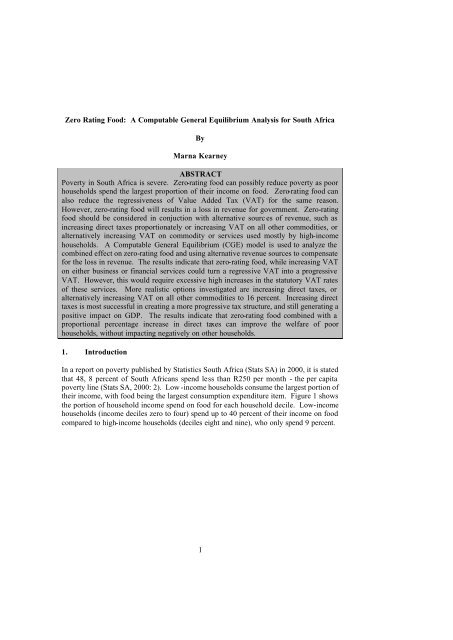
Zero Rating Food: A Computable General Equilibrium Analysis for South AfricaBy<strong>Marna</strong> <strong>Kearney</strong>ABSTRACTPoverty in South Africa is severe. Zero-rating food can possibly reduce poverty as poorhouseholds spend the largest proportion of their income on food. Zero-rating food canalso reduce the regressiveness of Value Added Tax (VAT) for the same reason.However, zero-rating food will results in a loss in revenue for government. Zero-ratingfood should be considered in conjuction with alternative sourc es of revenue, such asincreasing direct taxes proportionately or increasing VAT on all other commodities, oralternatively increasing VAT on commodity or services used mostly by high-incomehouseholds. A Computable General Equilibrium (CGE) model is used to analyze thecombined effect on zero-rating food and using alternative revenue sources to compensatefor the loss in revenue. The results indicate that zero-rating food, while increasing VATon either business or financial services could turn a regressive VAT into a progressiveVAT. However, this would require excessive high increases in the statutory VAT ratesof these services. More realistic options investigated are increasing direct taxes, oralternatively increasing VAT on all other commodities to 16 percent. Increasing directtaxes is most successful in creating a more progressive tax structure, and still generating apositive impact on GDP. The results indicate that zero-rating food combined with aproportional percentage increase in direct taxes can improve the welfare of poorhouseholds, without impacting negatively on other households.1. IntroductionIn a report on poverty published by Statistics South Africa (Stats SA) in 2000, it is statedthat 48, 8 percent of South Africans spend less than R250 per month - the per capitapoverty line (Stats SA, 2000: 2). Low -income households consume the largest portion oftheir income, with food being the largest consumption expenditure item. Figure 1 showsthe portion of household income spend on food for each household decile. Low-incomehouseholds (income deciles zero to four) spend up to 40 percent of their income on foodcompared to high-income households (deciles eight and nine), who only spend 9 percent.1


