Fundamentals of Clinical Research for Radiologists ROC Analysis
Fundamentals of Clinical Research for Radiologists ROC Analysis
Fundamentals of Clinical Research for Radiologists ROC Analysis

Create successful ePaper yourself
Turn your PDF publications into a flip-book with our unique Google optimized e-Paper software.
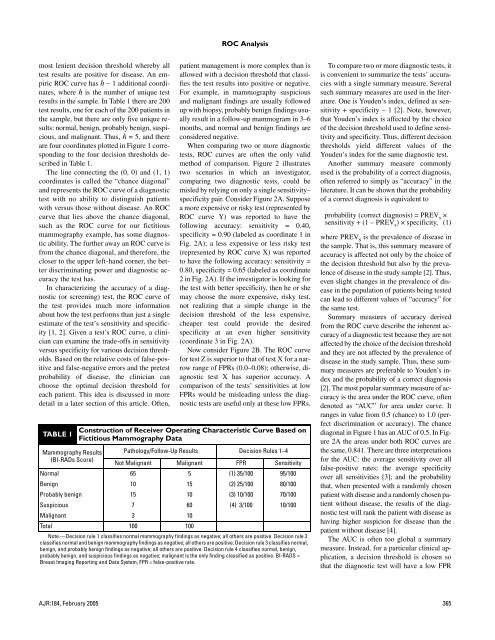
<strong>ROC</strong> <strong>Analysis</strong>most lenient decision threshold whereby alltest results are positive <strong>for</strong> disease. An empiric<strong>ROC</strong> curve has h − 1 additional coordinates,where h is the number <strong>of</strong> unique testresults in the sample. In Table 1 there are 200test results, one <strong>for</strong> each <strong>of</strong> the 200 patients inthe sample, but there are only five unique results:normal, benign, probably benign, suspicious,and malignant. Thus, h = 5, and thereare four coordinates plotted in Figure 1 correspondingto the four decision thresholds describedin Table 1.The line connecting the (0, 0) and (1, 1)coordinates is called the “chance diagonal”and represents the <strong>ROC</strong> curve <strong>of</strong> a diagnostictest with no ability to distinguish patientswith versus those without disease. An <strong>ROC</strong>curve that lies above the chance diagonal,such as the <strong>ROC</strong> curve <strong>for</strong> our fictitiousmammography example, has some diagnosticability. The further away an <strong>ROC</strong> curve isfrom the chance diagonal, and there<strong>for</strong>e, thecloser to the upper left-hand corner, the betterdiscriminating power and diagnostic accuracythe test has.In characterizing the accuracy <strong>of</strong> a diagnostic(or screening) test, the <strong>ROC</strong> curve <strong>of</strong>the test provides much more in<strong>for</strong>mationabout how the test per<strong>for</strong>ms than just a singleestimate <strong>of</strong> the test’s sensitivity and specificity[1, 2]. Given a test’s <strong>ROC</strong> curve, a cliniciancan examine the trade-<strong>of</strong>fs in sensitivityversus specificity <strong>for</strong> various decision thresholds.Based on the relative costs <strong>of</strong> false-positiveand false-negative errors and the pretestprobability <strong>of</strong> disease, the clinician canchoose the optimal decision threshold <strong>for</strong>each patient. This idea is discussed in moredetail in a later section <strong>of</strong> this article. Often,TABLE 1patient management is more complex than isallowed with a decision threshold that classifiesthe test results into positive or negative.For example, in mammography suspiciousand malignant findings are usually followedup with biopsy, probably benign findings usuallyresult in a follow-up mammogram in 3–6months, and normal and benign findings areconsidered negative.When comparing two or more diagnostictests, <strong>ROC</strong> curves are <strong>of</strong>ten the only validmethod <strong>of</strong> comparison. Figure 2 illustratestwo scenarios in which an investigator,comparing two diagnostic tests, could bemisled by relying on only a single sensitivity–specificity pair. Consider Figure 2A. Supposea more expensive or risky test (represented by<strong>ROC</strong> curve Y) was reported to have thefollowing accuracy: sensitivity = 0.40,specificity = 0.90 (labeled as coordinate 1 inFig. 2A); a less expensive or less risky test(represented by <strong>ROC</strong> curve X) was reportedto have the following accuracy: sensitivity =0.80, specificity = 0.65 (labeled as coordinate2 in Fig. 2A). If the investigator is looking <strong>for</strong>the test with better specificity, then he or shemay choose the more expensive, risky test,not realizing that a simple change in thedecision threshold <strong>of</strong> the less expensive,cheaper test could provide the desiredspecificity at an even higher sensitivity(coordinate 3 in Fig. 2A).Now consider Figure 2B. The <strong>ROC</strong> curve<strong>for</strong> test Z is superior to that <strong>of</strong> test X <strong>for</strong> a narrowrange <strong>of</strong> FPRs (0.0–0.08); otherwise, diagnostictest X has superior accuracy. Acomparison <strong>of</strong> the tests’ sensitivities at lowFPRs would be misleading unless the diagnostictests are useful only at these low FPRs.Construction <strong>of</strong> Receiver Operating Characteristic Curve Based onFictitious Mammography DataMammography Results Pathology/Follow-Up Results Decision Rules 1–4(BI-RADs Score)Not Malignant Malignant FPR SensitivityNormal 65 5 (1) 35/100 95/100Benign 10 15 (2) 25/100 80/100Probably benign 15 10 (3) 10/100 70/100Suspicious 7 60 (4) 3/100 10/100Malignant 3 10Total 100 100Note.—Decision rule 1 classifies normal mammography findings as negative; all others are positive. Decision rule 2classifies normal and benign mammography findings as negative; all others are positive. Decision rule 3 classifies normal,benign, and probably benign findings as negative; all others are positive. Decision rule 4 classifies normal, benign,probably benign, and suspicious findings as negative; malignant is the only finding classified as positive. BI-RADS =Breast Imaging Reporting and Data System, FPR = false-positive rate.To compare two or more diagnostic tests, itis convenient to summarize the tests’ accuracieswith a single summary measure. Severalsuch summary measures are used in the literature.One is Youden’s index, defined as sensitivity+ specificity − 1 [2]. Note, however,that Youden’s index is affected by the choice<strong>of</strong> the decision threshold used to define sensitivityand specificity. Thus, different decisionthresholds yield different values <strong>of</strong> theYouden’s index <strong>for</strong> the same diagnostic test.Another summary measure commonlyused is the probability <strong>of</strong> a correct diagnosis,<strong>of</strong>ten referred to simply as “accuracy” in theliterature. It can be shown that the probability<strong>of</strong> a correct diagnosis is equivalent toprobability (correct diagnosis) = PREV s ×sensitivity + (1 – PREV s ) × specificity, (1)where PREV s is the prevalence <strong>of</strong> disease inthe sample. That is, this summary measure <strong>of</strong>accuracy is affected not only by the choice <strong>of</strong>the decision threshold but also by the prevalence<strong>of</strong> disease in the study sample [2]. Thus,even slight changes in the prevalence <strong>of</strong> diseasein the population <strong>of</strong> patients being testedcan lead to different values <strong>of</strong> “accuracy” <strong>for</strong>the same test.Summary measures <strong>of</strong> accuracy derivedfrom the <strong>ROC</strong> curve describe the inherent accuracy<strong>of</strong> a diagnostic test because they are notaffected by the choice <strong>of</strong> the decision thresholdand they are not affected by the prevalence <strong>of</strong>disease in the study sample. Thus, these summarymeasures are preferable to Youden’s indexand the probability <strong>of</strong> a correct diagnosis[2]. The most popular summary measure <strong>of</strong> accuracyis the area under the <strong>ROC</strong> curve, <strong>of</strong>tendenoted as “AUC” <strong>for</strong> area under curve. Itranges in value from 0.5 (chance) to 1.0 (perfectdiscrimination or accuracy). The chancediagonal in Figure 1 has an AUC <strong>of</strong> 0.5. In Figure2A the areas under both <strong>ROC</strong> curves arethe same, 0.841. There are three interpretations<strong>for</strong> the AUC: the average sensitivity over allfalse-positive rates; the average specificityover all sensitivities [3]; and the probabilitythat, when presented with a randomly chosenpatient with disease and a randomly chosen patientwithout disease, the results <strong>of</strong> the diagnostictest will rank the patient with disease ashaving higher suspicion <strong>for</strong> disease than thepatient without disease [4].The AUC is <strong>of</strong>ten too global a summarymeasure. Instead, <strong>for</strong> a particular clinical application,a decision threshold is chosen sothat the diagnostic test will have a low FPRAJR:184, February 2005 365