Fundamentals of Clinical Research for Radiologists ROC Analysis
Fundamentals of Clinical Research for Radiologists ROC Analysis
Fundamentals of Clinical Research for Radiologists ROC Analysis

Create successful ePaper yourself
Turn your PDF publications into a flip-book with our unique Google optimized e-Paper software.
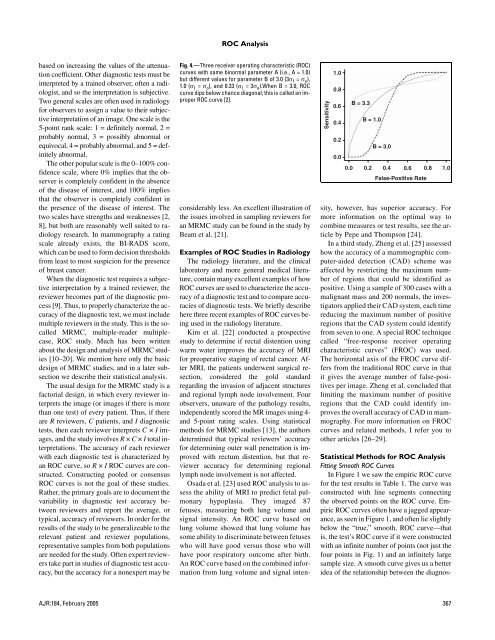
<strong>ROC</strong> <strong>Analysis</strong>based on increasing the values <strong>of</strong> the attenuationcoefficient. Other diagnostic tests must beinterpreted by a trained observer, <strong>of</strong>ten a radiologist,and so the interpretation is subjective.Two general scales are <strong>of</strong>ten used in radiology<strong>for</strong> observers to assign a value to their subjectiveinterpretation <strong>of</strong> an image. One scale is the5-point rank scale: 1 = definitely normal, 2 =probably normal, 3 = possibly abnormal orequivocal, 4 = probably abnormal, and 5 = definitelyabnormal.The other popular scale is the 0–100% confidencescale, where 0% implies that the observeris completely confident in the absence<strong>of</strong> the disease <strong>of</strong> interest, and 100% impliesthat the observer is completely confident inthe presence <strong>of</strong> the disease <strong>of</strong> interest. Thetwo scales have strengths and weaknesses [2,8], but both are reasonably well suited to radiologyresearch. In mammography a ratingscale already exists, the BI-RADS score,which can be used to <strong>for</strong>m decision thresholdsfrom least to most suspicion <strong>for</strong> the presence<strong>of</strong> breast cancer.When the diagnostic test requires a subjectiveinterpretation by a trained reviewer, thereviewer becomes part <strong>of</strong> the diagnostic process[9]. Thus, to properly characterize the accuracy<strong>of</strong> the diagnostic test, we must includemultiple reviewers in the study. This is the socalledMRMC, multiple-reader multiplecase,<strong>ROC</strong> study. Much has been writtenabout the design and analysis <strong>of</strong> MRMC studies[10–20]. We mention here only the basicdesign <strong>of</strong> MRMC studies, and in a later subsectionwe describe their statistical analysis.The usual design <strong>for</strong> the MRMC study is afactorial design, in which every reviewer interpretsthe image (or images if there is morethan one test) <strong>of</strong> every patient. Thus, if thereare R reviewers, C patients, and I diagnostictests, then each reviewer interprets C × I images,and the study involves R × C × I total interpretations.The accuracy <strong>of</strong> each reviewerwith each diagnostic test is characterized byan <strong>ROC</strong> curve, so R × I <strong>ROC</strong> curves are constructed.Constructing pooled or consensus<strong>ROC</strong> curves is not the goal <strong>of</strong> these studies.Rather, the primary goals are to document thevariability in diagnostic test accuracy betweenreviewers and report the average, ortypical, accuracy <strong>of</strong> reviewers. In order <strong>for</strong> theresults <strong>of</strong> the study to be generalizeable to therelevant patient and reviewer populations,representative samples from both populationsare needed <strong>for</strong> the study. Often expert reviewerstake part in studies <strong>of</strong> diagnostic test accuracy,but the accuracy <strong>for</strong> a nonexpert may beFig. 4.—Three receiver operating characteristic (<strong>ROC</strong>)curves with same binormal parameter A (i.e., A = 1.0)but different values <strong>for</strong> parameter B <strong>of</strong> 3.0 (3σ 1 = σ o ),1.0 (σ 1 = σ o ), and 0.33 (σ 1 = 3σ o ).When B = 3.0, <strong>ROC</strong>curve dips below chance diagonal; this is called an improper<strong>ROC</strong> curve [2].considerably less. An excellent illustration <strong>of</strong>the issues involved in sampling reviewers <strong>for</strong>an MRMC study can be found in the study byBeam et al. [21].Sensitivity1.00.80.60.40.20.00.0B = 3.3B = 1.00.2B = 3.00.40.6False-Positive Rate0.81.0Examples <strong>of</strong> <strong>ROC</strong> Studies in RadiologyThe radiology literature, and the clinicallaboratory and more general medical literature,contain many excellent examples <strong>of</strong> how<strong>ROC</strong> curves are used to characterize the accuracy<strong>of</strong> a diagnostic test and to compare accuracies<strong>of</strong> diagnostic tests. We briefly describehere three recent examples <strong>of</strong> <strong>ROC</strong> curves beingused in the radiology literature.Kim et al. [22] conducted a prospectivestudy to determine if rectal distention usingwarm water improves the accuracy <strong>of</strong> MRI<strong>for</strong> preoperative staging <strong>of</strong> rectal cancer. AfterMRI, the patients underwent surgical resection,considered the gold standardregarding the invasion <strong>of</strong> adjacent structuresand regional lymph node involvement. Fourobservers, unaware <strong>of</strong> the pathology results,independently scored the MR images using 4-and 5-point rating scales. Using statisticalmethods <strong>for</strong> MRMC studies [13], the authorsdetermined that typical reviewers’ accuracy<strong>for</strong> determining outer wall penetration is improvedwith rectum distention, but that revieweraccuracy <strong>for</strong> determining regionallymph node involvement is not affected.Osada et al. [23] used <strong>ROC</strong> analysis to assessthe ability <strong>of</strong> MRI to predict fetal pulmonaryhypoplasia. They imaged 87fetuses, measuring both lung volume andsignal intensity. An <strong>ROC</strong> curve based onlung volume showed that lung volume hassome ability to discriminate between fetuseswho will have good versus those who willhave poor respiratory outcome after birth.An <strong>ROC</strong> curve based on the combined in<strong>for</strong>mationfrom lung volume and signal intensity,however, has superior accuracy. Formore in<strong>for</strong>mation on the optimal way tocombine measures or test results, see the articleby Pepe and Thompson [24].In a third study, Zheng et al. [25] assessedhow the accuracy <strong>of</strong> a mammographic computer-aideddetection (CAD) scheme wasaffected by restricting the maximum number<strong>of</strong> regions that could be identified aspositive. Using a sample <strong>of</strong> 300 cases with amalignant mass and 200 normals, the investigatorsapplied their CAD system, each timereducing the maximum number <strong>of</strong> positiveregions that the CAD system could identifyfrom seven to one. A special <strong>ROC</strong> techniquecalled “free-response receiver operatingcharacteristic curves” (F<strong>ROC</strong>) was used.The horizontal axis <strong>of</strong> the F<strong>ROC</strong> curve differsfrom the traditional <strong>ROC</strong> curve in thatit gives the average number <strong>of</strong> false-positivesper image. Zheng et al. concluded thatlimiting the maximum number <strong>of</strong> positiveregions that the CAD could identify improvesthe overall accuracy <strong>of</strong> CAD in mammography.For more in<strong>for</strong>mation on F<strong>ROC</strong>curves and related methods, I refer you toother articles [26–29].Statistical Methods <strong>for</strong> <strong>ROC</strong> <strong>Analysis</strong>Fitting Smooth <strong>ROC</strong> CurvesIn Figure 1 we saw the empiric <strong>ROC</strong> curve<strong>for</strong> the test results in Table 1. The curve wasconstructed with line segments connectingthe observed points on the <strong>ROC</strong> curve. Empiric<strong>ROC</strong> curves <strong>of</strong>ten have a jagged appearance,as seen in Figure 1, and <strong>of</strong>ten lie slightlybelow the “true,” smooth, <strong>ROC</strong> curve—thatis, the test’s <strong>ROC</strong> curve if it were constructedwith an infinite number <strong>of</strong> points (not just thefour points in Fig. 1) and an infinitely largesample size. A smooth curve gives us a betteridea <strong>of</strong> the relationship between the diagnos-AJR:184, February 2005 367