TAG - Geological Society of Australia
TAG - Geological Society of Australia
TAG - Geological Society of Australia

Create successful ePaper yourself
Turn your PDF publications into a flip-book with our unique Google optimized e-Paper software.
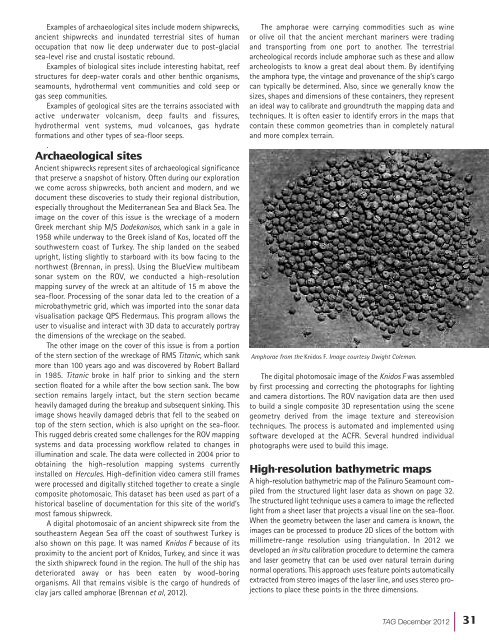
Examples <strong>of</strong> archaeological sites include modern shipwrecks,ancient shipwrecks and inundated terrestrial sites <strong>of</strong> humanoccupation that now lie deep underwater due to post-glacialsea-level rise and crustal isostatic rebound.Examples <strong>of</strong> biological sites include interesting habitat, reefstructures for deep-water corals and other benthic organisms,seamounts, hydrothermal vent communities and cold seep orgas seep communities.Examples <strong>of</strong> geological sites are the terrains associated withactive underwater volcanism, deep faults and fissures,hydrothermal vent systems, mud volcanoes, gas hydrateformations and other types <strong>of</strong> sea-floor seeps..Archaeological sitesAncient shipwrecks represent sites <strong>of</strong> archaeological significancethat preserve a snapshot <strong>of</strong> history. Often during our explorationwe come across shipwrecks, both ancient and modern, and wedocument these discoveries to study their regional distribution,especially throughout the Mediterranean Sea and Black Sea. Theimage on the cover <strong>of</strong> this issue is the wreckage <strong>of</strong> a modernGreek merchant ship M/S Dodekanisos, which sank in a gale in1958 while underway to the Greek island <strong>of</strong> Kos, located <strong>of</strong>f thesouthwestern coast <strong>of</strong> Turkey. The ship landed on the seabedupright, listing slightly to starboard with its bow facing to thenorthwest (Brennan, in press). Using the BlueView multibeamsonar system on the ROV, we conducted a high-resolutionmapping survey <strong>of</strong> the wreck at an altitude <strong>of</strong> 15 m above thesea-floor. Processing <strong>of</strong> the sonar data led to the creation <strong>of</strong> amicrobathymetric grid, which was imported into the sonar datavisualisation package QPS Fledermaus. This program allows theuser to visualise and interact with 3D data to accurately portraythe dimensions <strong>of</strong> the wreckage on the seabed.The other image on the cover <strong>of</strong> this issue is from a portion<strong>of</strong> the stern section <strong>of</strong> the wreckage <strong>of</strong> RMS Titanic, which sankmore than 100 years ago and was discovered by Robert Ballardin 1985. Titanic broke in half prior to sinking and the sternsection floated for a while after the bow section sank. The bowsection remains largely intact, but the stern section becameheavily damaged during the breakup and subsequent sinking. Thisimage shows heavily damaged debris that fell to the seabed ontop <strong>of</strong> the stern section, which is also upright on the sea-floor.This rugged debris created some challenges for the ROV mappingsystems and data processing workflow related to changes inillumination and scale. The data were collected in 2004 prior toobtaining the high-resolution mapping systems currentlyinstalled on Hercules. High-definition video camera still frameswere processed and digitally stitched together to create a singlecomposite photomosaic. This dataset has been used as part <strong>of</strong> ahistorical baseline <strong>of</strong> documentation for this site <strong>of</strong> the world’smost famous shipwreck.A digital photomosaic <strong>of</strong> an ancient shipwreck site from thesoutheastern Aegean Sea <strong>of</strong>f the coast <strong>of</strong> southwest Turkey isalso shown on this page. It was named Knidos F because <strong>of</strong> itsproximity to the ancient port <strong>of</strong> Knidos, Turkey, and since it wasthe sixth shipwreck found in the region. The hull <strong>of</strong> the ship hasdeteriorated away or has been eaten by wood-boringorganisms. All that remains visible is the cargo <strong>of</strong> hundreds <strong>of</strong>clay jars called amphorae (Brennan et al, 2012).The amphorae were carrying commodities such as wineor olive oil that the ancient merchant mariners were tradingand transporting from one port to another. The terrestrialarcheological records include amphorae such as these and allowarcheologists to know a great deal about them. By identifyingthe amphora type, the vintage and provenance <strong>of</strong> the ship’s cargocan typically be determined. Also, since we generally know thesizes, shapes and dimensions <strong>of</strong> these containers, they representan ideal way to calibrate and groundtruth the mapping data andtechniques. It is <strong>of</strong>ten easier to identify errors in the maps thatcontain these common geometries than in completely naturaland more complex terrain.Amphorae from the Knidos F. Image courtesy Dwight Coleman.The digital photomosaic image <strong>of</strong> the Knidos F was assembledby first processing and correcting the photographs for lightingand camera distortions. The ROV navigation data are then usedto build a single composite 3D representation using the scenegeometry derived from the image texture and stereovisiontechniques. The process is automated and implemented usings<strong>of</strong>tware developed at the ACFR. Several hundred individualphotographs were used to build this image.High-resolution bathymetric mapsA high-resolution bathymetric map <strong>of</strong> the Palinuro Seamount compiledfrom the structured light laser data as shown on page 32.The structured light technique uses a camera to image the reflectedlight from a sheet laser that projects a visual line on the sea-floor.When the geometry between the laser and camera is known, theimages can be processed to produce 2D slices <strong>of</strong> the bottom withmillimetre-range resolution using triangulation. In 2012 wedeveloped an in situ calibration procedure to determine the cameraand laser geometry that can be used over natural terrain duringnormal operations. This approach uses feature points automaticallyextracted from stereo images <strong>of</strong> the laser line, and uses stereo projectionsto place these points in the three dimensions.<strong>TAG</strong> December 2012| 31