Phytoplankton as an indicator of water quality health status
Phytoplankton as an indicator of water quality health status
Phytoplankton as an indicator of water quality health status

Create successful ePaper yourself
Turn your PDF publications into a flip-book with our unique Google optimized e-Paper software.
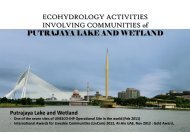
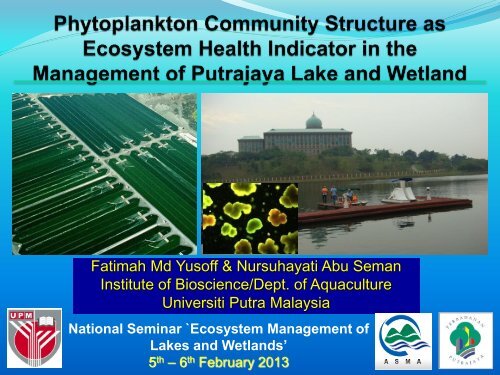
Fatimah Md Yus<strong>of</strong>f & Nursuhayati Abu Sem<strong>an</strong>Institute <strong>of</strong> Bioscience/Dept. <strong>of</strong> AquacultureUniversiti Putra MalaysiaNational Seminar `Ecosystem M<strong>an</strong>agement <strong>of</strong>Lakes <strong>an</strong>d Wetl<strong>an</strong>ds’5 th – 6 th February 2013
Contents• Introduction• <strong>Phytopl<strong>an</strong>kton</strong>• Lake ecosystem• Characteristics & types <strong>of</strong> trophic <strong>indicator</strong>• Putrajaya phytopl<strong>an</strong>kton• M<strong>an</strong>agement implications• Conclusions
Why is phytopl<strong>an</strong>kton import<strong>an</strong>t?• Produces oxygen – needs <strong>of</strong> aquaticlife• Algae are the b<strong>as</strong>is <strong>of</strong> most aquaticfood webs• Algae help to ‘purify’ <strong>water</strong> byabsorbing nutrients & heavy metals• Aquaculture – live feed• Industries - foods, nutraceuticals,pharmaceuticals, bi<strong>of</strong>uels.Algae c<strong>an</strong> be valuable <strong>indicator</strong>s <strong>of</strong> environmental <strong>quality</strong>:Sensitive to ch<strong>an</strong>ges in pH, nutrient or temperature.Monitor species composition & density - identifych<strong>an</strong>ges in <strong>water</strong> <strong>quality</strong>.
Trophic State <strong>of</strong> Lakes• Oligotrophic• Unproductive lakes, low N & P); low poductivity; veryclear <strong>water</strong>s, high hypolimnetic O 2, high species diversity.• Mesotrophic• Intermediate level <strong>of</strong> productivity; clear <strong>water</strong> lakes withsubmerged aquatic pl<strong>an</strong>ts & medium levels <strong>of</strong> nutrients.• Eutrophic• Productive with high nutrient supply, high productivity;Algae blooms – fish kills• Hypereutrophic• very nutrient-rich <strong>an</strong>d productive lakes (eg. >100 ugP/L) – severe algal blooms; low tr<strong>an</strong>sparency.(< 1m)
Eutrophication• Ecosystem response to the addition <strong>of</strong> nutrients,especially such <strong>as</strong> N & P.• C<strong>an</strong> be natural or artificial (cultural eutrophication)• Natural – natural nutrient deposition – slow• Artificial – <strong>an</strong>throphogenic – f<strong>as</strong>t & persistent org<strong>an</strong>icpollution• Nuis<strong>an</strong>ce phytopl<strong>an</strong>kton blooms
Sources <strong>of</strong> EutrophyIndustrial are<strong>as</strong>Org<strong>an</strong>ic PPO4Domestic & commercial CentresPartially treated sewageNO3NH3Org<strong>an</strong>ic NFarms (fertilisers,w<strong>as</strong>tes)Oligotrophic lakeAnthropogenic activitiesEutrophic lake
Consequences <strong>of</strong> eutrophication Incre<strong>as</strong>ed growth/blooms <strong>of</strong> nuis<strong>an</strong>ce microalgaesome algal species excrete large amt mucilage – foamstoxins - HABs Decre<strong>as</strong>e <strong>of</strong> dissolved oxygen – <strong>an</strong>oxic condition Incre<strong>as</strong>ed <strong>of</strong> toxic compounds – ammonia, nitrite, sulphide, Water <strong>quality</strong> deterioration – affect potable <strong>water</strong> Decre<strong>as</strong>e <strong>of</strong> aesthetic value – affect tourism Fish kill – high mortality Decre<strong>as</strong>e biodiversity - disappear<strong>an</strong>ce <strong>of</strong> commercially import<strong>an</strong>tspecies
Indicators <strong>of</strong> Trophic StatusWater Domin<strong>an</strong>t Algae Other commonalgaeOligotrophicSlightly acidic Desmids,Staurodesmus,Diatoms:Rhizosolenia,TabellariaOligotrophicNeutral toslightlyalkaline;nutrient poorDiatoms: Cyclotella*,Tabellaria;Chrysophytes,Diatoms;Dinobryon;CryptophytesOligotrophicNeutral toslightlyalkaline;productive atcertainse<strong>as</strong>onsChrysophytes:Dinobryon*,Mallomon<strong>as</strong>DiatomsCyclotella ocellata3 – 5 u diameter* Common in Putrajaya <strong>water</strong>sDinobryon
Indicators <strong>of</strong> Trophic StatusWater Domin<strong>an</strong>t Algae Other commonalgaeMesotrophicNeutral toslightlyalkalineDin<strong>of</strong>lagellatesMixedMesotrophicNeutral toslightly acidicPutrajaya lake –Green algae,Scenedesmus,Staur<strong>as</strong>trumPutrajaya lake,ScenedesmusEutrophicUsuallyalkaline,enrichedtropical lakesBlue-green algae:Oscillatoria,AnabaenaEuglenophytes iforg<strong>an</strong>icallypolluted
# <strong>of</strong> phytopl<strong>an</strong>kton genera <strong>an</strong>d species inPutrajaya lake <strong>an</strong>d wetl<strong>an</strong>d (Oct 2006 – Dec 2012)<strong>Phytopl<strong>an</strong>kton</strong> groups No. generadetectedNo. speciesdetectedChlorophyta (Green algae) 43 108Bacillariophyta (Diatoms) 24 41Euglenophyta (Euglenoids) 6 18Cy<strong>an</strong>obacteria (Blue-greenalgae)9 15Pyrrhophyta (Din<strong>of</strong>lagellates) 2 7Chrysophyta (Chrysophytes) 2 3Cryptophyta (Cryptophytes) 1 2Total 87 194
Sh<strong>an</strong>non-Weiner’s diversity indices (H’, H’ max <strong>an</strong>d J’)5.04.54.03.5BGA domin<strong>an</strong>ce in June 20121.00.90.80.7H' <strong>an</strong>d H' max3.02.52.01.51.00.50.00.60.50.40.30.20.10.0J'Oct. 06Nov. 06Dec. 06J<strong>an</strong>. 07Feb. 07Mar. 07Apr. 07May 07June. 07July. 07Aug. 07Sept.07Oct. 07Nov. 07Dec. 07J<strong>an</strong>. 08Feb. 08Mar.08Apr.08May 08June.08July.08Aug.08Sept.08J<strong>an</strong>.09Feb.09Mar.09Apr.09May 09June.09July.09Aug.09Sept.09Oct.09Nov.09Dec.09J<strong>an</strong>.10Feb.10Mar.10Apr.10May.10June.10July.10Aug.10Sept.10Oct.10Nov.10Dec.10Mar.11June.11Sept.11Dec.11Mar.12June.12Oct.12Dec.12Sampling MonthsH’ H’ max J'
<strong>Phytopl<strong>an</strong>kton</strong> Density Trend in PutrajayaWetl<strong>an</strong>d & Lake35006000.0Total Me<strong>an</strong> Density (cells/ml)300025002000150010005000J<strong>an</strong>.07Feb.07Mar.07Apr.07May.07Jun.07Jul.07Aug.07Sept.07Oct.07Nov.07Dec.07J<strong>an</strong>.08Feb.08Mar.08Apr.08May.08Jun.08Jul.08Aug.08Sept.08J<strong>an</strong>.09Feb.09Mar.09Apr.09May.09Jun.09Jul.09Aug.09Sept.09Oct.09Nov.09Dec.09J<strong>an</strong>.10Feb.10Mar.10Apr.10May.10Jun.10Jul.10Aug.10Sept.10Oct.10Nov.10Dec.10Mar.11Jun.11Sept.11Dec.11Mar.12Jun.12Oct.12Dec.12Sampling StationsAll stations Wetl<strong>an</strong>d Lake5000.04000.03000.02000.01000.00.0Me<strong>an</strong> Density Wetl<strong>an</strong>d vs Lake (cells/ml)Lake always h<strong>as</strong> higher density compared to the wetl<strong>an</strong>d<strong>Phytopl<strong>an</strong>kton</strong> density in the lake flcutuated dr<strong>as</strong>tically, sometimewith peaks close to eutrophic values
<strong>Phytopl<strong>an</strong>kton</strong> densities at PLg2 2006 - 2012250013,168.0PLg22,548.02,173.72000Density (cells/ml)150010005000Oct.06Nov.06Dec.06J<strong>an</strong>.07Feb.07Mar.07Apr.07May 07June.07July.07Aug.07Sept.07Oct.07Nov.07Dec.07J<strong>an</strong>.08Feb.08Mar.08Apr.08May 08June.08July.08Aug.08Sept.08J<strong>an</strong>.09Feb.09Mar.09Apr.09May 09June.09July.09Aug.09Sept.09Oct.09Nov.09Dec.09J<strong>an</strong>.10Feb.10Mar.10Apr.10May.10June.10July.10Aug.10Sept.10Oct.10Nov.10Dec.10Mar.11June.11Sept.11Dec.11Mar.12June.12Oct.12Dec.12Sampling MonthsBacillariophyta Chlorophyta Cy<strong>an</strong>ophyta PyrrophytaChrysophyta Cryptophyta Euglenophyta
Abund<strong>an</strong>ce <strong>of</strong> different phytopl<strong>an</strong>ktongroups: 2007 - 20122000.0BGA PeakMe<strong>an</strong> Density (cells/ml)1500.01000.0500.03197.60.0J<strong>an</strong>.07Feb.07Mar.07Apr.07May 07June.07July.07Aug.07Sept.07Oct.07Nov.07Dec.07J<strong>an</strong>.08Feb.08Mar.08Apr.08May 08June.08July.08Aug.08Sept.o8J<strong>an</strong>.09Feb.09Mar.09Apr.09May 09June.09July.09Aug.09Sept.09Oct.09Nov.09Dec.09J<strong>an</strong>.10Feb.10Mar.10Apr.10May.10June.10July.10Aug.10Sept.10Oct.10Nov.10Dec.10Mar.11June.11Sept.11Dec.11Mar.12June.12Oct.12Dec.12Sampling MonthsDiatoms Green algae Blue-green algae Din<strong>of</strong>lagellatesChrysophytes Cryptophytes Euglenoids• L (Low): < 100 cells/ml: Oligotrophic• C (Comparable): 100 – 1,000 cells/ml – Oligo-mesotrophic• H (high): > 1,000 cells/ml - mesotrophic• E (eutrophic): >10,000 cells/ml (mainly blue-green algae)
<strong>Phytopl<strong>an</strong>kton</strong> groups % in Putrajaya Lake <strong>an</strong>dWetl<strong>an</strong>d 2007 - 201210080<strong>Phytopl<strong>an</strong>kton</strong> population (%)6040200J<strong>an</strong>.07Feb.07Mar.07Apr.07May 07June.07July.07Aug.07Sept.07Oct.07Nov.07Dec.07J<strong>an</strong>.08Feb.08Mar.08Apr.08May 08June.08July.08Aug.08Sept.08J<strong>an</strong>.09Feb.09Mar.09Apr.09May 09June.09July.09Aug.09Sept.09Oct.09Nov.09Dec.09J<strong>an</strong>.10Feb.10Mar.10Apr.10May.10June.10July.10Aug.10Sept.10Oct.10Nov.10Dec.10Mar.11June.11Sept.11Dec.11Mar.12June.12Oct.12Dec.12Sampling MonthsDiatoms Green algae Blue-green algae Din<strong>of</strong>lagellatesChrysophytes Cryptophytes Euglenoids
Density (cells/ml)<strong>Phytopl<strong>an</strong>kton</strong> abund<strong>an</strong>ce at diff. stations5002195.0cells/mL2060.0cells/mL120117.0232.0 225.5 170.0 430.0<strong>Phytopl<strong>an</strong>kton</strong> Density(cells/mL)400300200100200780200860Density (cells/mL)10040200UE1 UW1 LE1 CW PLb1 PLc2 PLe1 PLd2 PLf5 PLg2Sampling StationBacillariophyta Chlorophyta Cy<strong>an</strong>ophyta PyrrhophytaChrysophyta Cryptophyta Euglenophyta0UE1 UW1 LE1 CW PLb1 PLc2 PLe1 PLd2 PLf5 PLg2Sampling StationBacillariophyta Chlorophyta Cy<strong>an</strong>ophyta PyrrhophytaChrysophyta Cryptophyta EuglenophytaDensity (cells/ml)6050403020100200970.0 100.0 144.0UE1 UW1 LE1 CW PLb1 PLc2 PLe1 PLd2 PLf5 PLg2Sampling StationBacillariophyta Chlorophyta Cy<strong>an</strong>ophyta PyrrhophytaChrysophyta Cryptophyta Euglenophyta80070060050040030020010002010UE1 UW1 LE1 CW PLb1 PLc2 PLe1 PLd2 PLf5 PLg2Sampling StationBacillariophyta Chlorophyta Cy<strong>an</strong>ophyta PyrrhophytaChrysophyta Cryptophyta EuglenophytaHigher abund<strong>an</strong>ce in the lake stations
<strong>Phytopl<strong>an</strong>kton</strong> abund<strong>an</strong>ce at diff. stationsDensity (cells/ml)9008007006005004003002001002011Density (cells/ml)4000.03500.03000.02500.02000.01500.01000.0500.0June 2012Domin<strong>an</strong>ce <strong>of</strong> BGA0UE1 UW1 LE1 CW PLb1 PLc2 PLe1 PLd2 PLf5 PLg2Sampling StationBacillariophyta Chlorophyta Cy<strong>an</strong>ophyta PyrrhophytaChrysophyta Cryptophyta Euglenophyta0.0UE1 UW1 LE1 CW PLb1 PLc2 PLe1 PLd2 PLf5 PLg2Sampling StationsBacillariophyta Chlorophyta Cy<strong>an</strong>ophyta PyrrophytaChrysophyta Cryptophyta Euglenophyta1200.0Density (cells/ml)1000.0800.0600.0400.0200.0Dec. 2012Incre<strong>as</strong>ing abund<strong>an</strong>ce<strong>of</strong> blue-greens &euglenoids in 20120.0UE1 UW1 LE1 CW PLb1 PLc2 PLe1 PLd2 PLf5 PLg2Sampling StationsBacillariophyta Chlorophyta Cy<strong>an</strong>ophyta PyrrophytaChrysophyta Cryptophyta Euglenophyta
Cluster Analysis <strong>of</strong> <strong>Phytopl<strong>an</strong>kton</strong> Abund<strong>an</strong>ce7580Tr<strong>an</strong>sform: Log(X+1)Resembl<strong>an</strong>ce: S17 Bray Curtis similarity20076070Tr<strong>an</strong>sform: Log(X+1)Resembl<strong>an</strong>ce: S17 Bray Curtis similarity2008Similarity8590Similarity809590100Wetl<strong>an</strong>d4Wetl<strong>an</strong>d2Lake5Lake6Lake4StationsLake1Lake3Wetl<strong>an</strong>d3Wetl<strong>an</strong>d160Lake2(a)100Lake3Lake4Lake5Lake6Wetl<strong>an</strong>d1StationsWetl<strong>an</strong>d3Tr<strong>an</strong>sform: Log(X+1)Resembl<strong>an</strong>ce: S17 Bray Curtis similarityLake1Lake2Wetl<strong>an</strong>d2Wetl<strong>an</strong>d4(b)Dendrograms <strong>of</strong>different stations b<strong>as</strong>edon phytopl<strong>an</strong>ktondensitySimilarity708090100Lake1Lake2Lake3LakeLake5Lake4StationsLake6Wetl<strong>an</strong>d1Wetl<strong>an</strong>d3Wetl<strong>an</strong>d2Wetl<strong>an</strong>d2009Wetl<strong>an</strong>d4(c)
Cluster Analysis <strong>of</strong> <strong>Phytopl<strong>an</strong>kton</strong> Abund<strong>an</strong>ce7075Tr<strong>an</strong>sform: Log(X+1)Resembl<strong>an</strong>ce: S17 Bray Curtis similarity201085Tr<strong>an</strong>sform: Log(X+1)Resembl<strong>an</strong>ce: S17 Bray Curtis similarity20118090Similarity8590Similarity9595100Lake1Lake2Lake3Lake5LakeLake4StationsLake6Wetl<strong>an</strong>d3Wetl<strong>an</strong>d1Wetl<strong>an</strong>d28085Wetl<strong>an</strong>dWetl<strong>an</strong>d4(d)100Lake3Lake5Lake4Tr<strong>an</strong>sform: Log(X+1)Resembl<strong>an</strong>ce: S17 Bray Curtis similarity2012Lake6Lake1Lake2StationsLakeWetl<strong>an</strong>d3Wetl<strong>an</strong>d2Wetl<strong>an</strong>d1Wetl<strong>an</strong>d4(e)Wetl<strong>an</strong>dSimilarity9095100Lake4Lake6Lake5LakeLake2Lake1StationsLake3Wetl<strong>an</strong>d1Wetl<strong>an</strong>d2Wetl<strong>an</strong>d3Wetl<strong>an</strong>dWetl<strong>an</strong>d4(f)
<strong>Phytopl<strong>an</strong>kton</strong> <strong>as</strong> <strong>indicator</strong> <strong>of</strong> trophic <strong>status</strong> in PutrajayaLake & Wetl<strong>an</strong>dsTrophic : Oligotrophic ...............mesotrophic………….eutrophicNutrient: Deficient….................adequate……………………highClarity: clear………………………………………..………..turbidDiatoms: Cyclotella……………Melosira…………………..…….………………………Fragilaria………………..Chrysophytes: Dinobryon, Mallomon<strong>as</strong>…………………………Chlorophyta:………Scenedesmus, Staur<strong>as</strong>trum……………..Cy<strong>an</strong>obacteria: .……Merismopedia………Anabaena, MicrosystisDin<strong>of</strong>lagellates:…… Peridinium, Ceratium………………………Cryptophytes:..............Cryptomon<strong>as</strong>.........................................Euglenoids: ………………………………….…………. Euglena…………………………………...........................Phacus
<strong>Phytopl<strong>an</strong>kton</strong> & M<strong>an</strong>agement <strong>Phytopl<strong>an</strong>kton</strong> species composition shifts with ch<strong>an</strong>ging<strong>water</strong> <strong>quality</strong>: Cle<strong>an</strong> <strong>water</strong> species: Diatoms, chrysophytes Eutrophic species: Blue-green algae, euglenoids <strong>Phytopl<strong>an</strong>kton</strong> density responses to ch<strong>an</strong>ges in nutrients: < 1000 cells; oligo-mesotrophic > 10,000 cells/ml: eutrophicIncre<strong>as</strong>ing density <strong>of</strong> green algae, cells/ml
<strong>Phytopl<strong>an</strong>kton</strong> & M<strong>an</strong>agementThreats <strong>of</strong> eutrophication:Nutrients from the upstream <strong>of</strong> thewetl<strong>an</strong>ds & the area surrounding thelake.<strong>Phytopl<strong>an</strong>kton</strong> communityresponses by shifts in speciescomposition & abund<strong>an</strong>ce <strong>of</strong><strong>indicator</strong> speciesWetl<strong>an</strong>d area w<strong>as</strong> less affecteddue to filtering effects by themacrophytes: More oligotrophic <strong>indicator</strong> speciesUN 6 lower phytopl<strong>an</strong>kton densities th<strong>an</strong> the lake Less dr<strong>as</strong>tic density fluctuationsEuglenoid blooms - Indicator<strong>of</strong> org<strong>an</strong>ic pollution
Conclusions• 194 species <strong>of</strong> phytopl<strong>an</strong>kton from 87 genera• The no. <strong>of</strong> species underwent dr<strong>as</strong>tic fluctuations in the earlyyears, but seemed to stabilize in 2009-2010.• Dr<strong>as</strong>tic fluctuations in 2011 & 2012 could be due to longsampling intervals• Species diversity decre<strong>as</strong>ed in 2012 due to domin<strong>an</strong>ce <strong>of</strong>blue-green algae – eutrophication <strong>indicator</strong>.• In the wetl<strong>an</strong>d – more oligotrophic species• In the lake – more mesotrophic species• In 2012 – lake area w<strong>as</strong> dominated by eutrophic species• In 2012 - Euglenoid w<strong>as</strong> dom<strong>an</strong>t in the upper wetl<strong>an</strong>d area.• <strong>Phytopl<strong>an</strong>kton</strong> density incre<strong>as</strong>ed over the years, especially inthe lake area:– Density in wetl<strong>an</strong>d area is in the oligotrophic level– In the lake – mesotrophic level: > 1000 cells/ml
Conclusions• Ecosystem is slowly ch<strong>an</strong>ging towards mesotrophic <strong>an</strong>d eutrophic• Effective m<strong>an</strong>agement <strong>of</strong> nutrient loadings• Surrounding l<strong>an</strong>d area: housing, commercial centre• Head<strong>water</strong>s: UPM, MARDI, Agriculture l<strong>an</strong>ds, Golf course, Hospital,Hotels• Artificial wetl<strong>an</strong>d is very effectively in reducing pollution from thehead<strong>water</strong>s• Wetl<strong>an</strong>d belt around the lake perimeter• Application <strong>of</strong> in-lake ecotechnology• Incre<strong>as</strong>e oxygen level at sediment-<strong>water</strong> interph<strong>as</strong>e• Nutrient sequestrationOligotrophyMesotrophyEutrophicHyper-eutrohic
Putrajaya LakeYes ???Blue-green algae bloomsEuglena blooms