Design of Deep Underground stations in soft soil ... - Royal Haskoning
Design of Deep Underground stations in soft soil ... - Royal Haskoning
Design of Deep Underground stations in soft soil ... - Royal Haskoning

You also want an ePaper? Increase the reach of your titles
YUMPU automatically turns print PDFs into web optimized ePapers that Google loves.
<strong>Design</strong> <strong>of</strong> <strong>Deep</strong> <strong>Underground</strong> <strong>stations</strong> <strong>in</strong> s<strong>of</strong>t <strong>soil</strong> conditions<br />
J. Herbschleb 1 , J.C.W.M. de Wit 2<br />
ABSTRACT<br />
The municipality <strong>of</strong> Amsterdam wish to<br />
reduce the level <strong>of</strong> car traffic with<strong>in</strong> the<br />
City Centre. As a consequence the public<br />
transport is to be extended by a new<br />
North/South Metro l<strong>in</strong>e. This paper will<br />
focus on the design philosophy <strong>of</strong> the deep<br />
station boxes. The excavations depths for<br />
the <strong>stations</strong> will exceed 30m and will be<br />
constructed <strong>in</strong> difficult s<strong>of</strong>t <strong>soil</strong> conditions.<br />
A further significant aspect is that the<br />
build<strong>in</strong>g pits are very near (3 to 5 m) to<br />
build<strong>in</strong>gs <strong>of</strong> historical importance. This is<br />
illustrated by the follow<strong>in</strong>g topics that are<br />
<strong>in</strong>vestigated.<br />
• Geology/Geotechnics<br />
• Structural design station box<br />
• Requirements/Impact surround<strong>in</strong>gs<br />
• FE-Modell<strong>in</strong>g<br />
• Additional test project diaphragm walls<br />
• Monitor<strong>in</strong>g dur<strong>in</strong>g construction<br />
INTRODUCTION<br />
Central<br />
Station<br />
Rok<strong>in</strong><br />
Station<br />
Vijzelgracht<br />
Station<br />
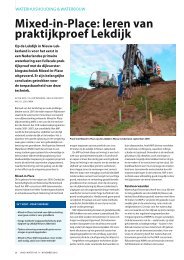
Figure 1: Aerial photograph <strong>of</strong> Amsterdam with projected<br />
North/South Metro l<strong>in</strong>e<br />
The Amsterdam North/South metro l<strong>in</strong>e will connect several important public transport systems (tra<strong>in</strong>, tram,<br />
bus, and metro) with the north, centre and south districts <strong>of</strong> Amsterdam. The total length <strong>of</strong> the metro is 9<br />
km, <strong>of</strong> which 4 km will be constructed underground. Dur<strong>in</strong>g the construction (early 70’s) <strong>of</strong> the first metro<br />
l<strong>in</strong>e <strong>in</strong> Amsterdam it was necessary to demolish build<strong>in</strong>gs <strong>in</strong> city centre. The client wishes to avoid any<br />
demolition dur<strong>in</strong>g the construction <strong>of</strong> the new metro l<strong>in</strong>e. Hence the follow<strong>in</strong>g two major restrictions were<br />
imposed for this project:<br />
1) No significant damage to build<strong>in</strong>gs may occur.<br />
2) Disruption <strong>of</strong> city life should be limited.<br />
To m<strong>in</strong>imise the effects <strong>of</strong> the construction to adjacent historical build<strong>in</strong>gs a bored tunnel will be adopted for<br />
the underground sections <strong>in</strong> the city centre. The tunnel follows the street pattern as closely as possible, see<br />
Figure 1, and descends to a great depth. Consequently the metro <strong>stations</strong> are located at significant depths<br />
(over 30 meters below surface level). A build<strong>in</strong>g pit will be constructed for the <strong>stations</strong>, hav<strong>in</strong>g braced<br />
diaphragm walls to a level <strong>of</strong> over 40m below street level.<br />
The <strong>in</strong>fluence <strong>of</strong> the construction <strong>of</strong> the North/South l<strong>in</strong>e on historic and vulnerable build<strong>in</strong>gs was a<br />
significant design issue.<br />
Much design effort was required and special test procedures were carried out to <strong>in</strong>vestigate the realistic<br />
effects <strong>of</strong> underground construction <strong>in</strong> the City.<br />
1 De Weger, Architects and Eng<strong>in</strong>eers, Heer Bokelweg 145, 3032 AD Rotterdam, the Netherlands, email: jh@deweger.nl<br />
2 De Weger, Architects and Eng<strong>in</strong>eers, Heer Bokelweg 145, 3032 AD Rotterdam, the Netherlands, email:hdw@deweger.nl<br />
De Weger participates together with Witteveen & Bos bv and IBA <strong>in</strong> the North/South l<strong>in</strong>e <strong>Design</strong> Office, which is responsible for the<br />
design <strong>of</strong> the North/South l<strong>in</strong>e metro.
GEOLOGY<br />
The subsurface <strong>of</strong> Amsterdam is<br />
composed <strong>of</strong> sediments, up to depths<br />
vary<strong>in</strong>g between 800 to 1000 meters<br />
below ground level. The sediments<br />
(sands, silts, clays and peat) have<br />
orig<strong>in</strong>ated from mar<strong>in</strong>e-, glacial-,<br />
eolian- and river deposits. In the<br />
upper 350 meters <strong>of</strong> sediments two<br />
ma<strong>in</strong> geological important units are<br />
dist<strong>in</strong>guished, namely Holocene<br />
(10.000 years - present) and<br />
Pleistocene (10.000 - 2.5 million<br />
before present) deposits, see Figure 2<br />
for a general lithological pr<strong>of</strong>ile <strong>of</strong><br />
Amsterdam.<br />
The oldest and deepest Pleistocene<br />
deposits are mar<strong>in</strong>e clays and f<strong>in</strong>e- Figure 2: Geological cross section <strong>of</strong> Amsterdam<br />
gra<strong>in</strong>ed sands, which extend to a level<br />
<strong>of</strong> 250- 350 meter below groundlevel<br />
With the second last (Saalien) ice age sediments were deposited on top <strong>of</strong> these river deposits. The ice cap<br />
came near to the South <strong>of</strong> Amsterdam and created the Amsterdam Bas<strong>in</strong>. Dur<strong>in</strong>g this period ma<strong>in</strong>ly glacial<br />
and melt water deposits were formed with<strong>in</strong> the bas<strong>in</strong>. After melt<strong>in</strong>g <strong>of</strong> the ice cap the Amsterdam Bas<strong>in</strong> was<br />
flooded with the sea and partially filled with mar<strong>in</strong>e sands and clays (Eemclay). Dur<strong>in</strong>g the last ice age<br />
(100.000 - 10.000 years ago), the ice cap did not extend to the south <strong>of</strong> Amsterdam. In that period the<br />
Netherlands experienced a tundra climate. The Amsterdam Bas<strong>in</strong> was filled with ma<strong>in</strong>ly sand. These sand<br />
layers are very important to foundation practice <strong>in</strong> Amsterdam and marks also the end <strong>of</strong> the Pleistocene.<br />
Holocene deposits (ma<strong>in</strong>ly peats and clays) were ma<strong>in</strong>ly formed under the <strong>in</strong>fluence <strong>of</strong> the sea. The ris<strong>in</strong>g<br />
sea (0.5m per century) reached the present location <strong>of</strong> Amsterdam 7000 year ago. A transgression started due<br />
to lower<strong>in</strong>g <strong>of</strong> the sea level, 5000 years ago. Dur<strong>in</strong>g the Holocene a river connection existed to the sea. This<br />
river produced erosion channels <strong>in</strong> the Pleistocene sand deposits. In these channels, sometimes with widths<br />
over 100m, th<strong>in</strong> sand and (s<strong>of</strong>t) clay layers were deposited.<br />
SITE INVESTIGATION<br />
Along the route <strong>of</strong> the North/South l<strong>in</strong>e a comprehensive <strong>soil</strong> <strong>in</strong>vestigation has been made. This <strong>soil</strong><br />
<strong>in</strong>vestigation consisted <strong>of</strong> a total <strong>of</strong> 125 boreholes and about 400 CPT’s each up to depths <strong>of</strong> 70 meters. As<br />
well as these bor<strong>in</strong>gs and CPT’s, special tests like Cone Pressure Meters (CPM) were also carried out.<br />
In the laboratory the samples <strong>of</strong> the bor<strong>in</strong>gs were classified and tested. The laboratory tests were used ma<strong>in</strong>ly<br />
to determ<strong>in</strong>e the strength and stiffness parameters <strong>of</strong> the <strong>soil</strong>s, specially the Pleistocene Mar<strong>in</strong>e Eemclay. The<br />
reason to concentrate the site <strong>in</strong>vestigation to the Eemclay is that very little geotechnical <strong>in</strong>formation was<br />
available for this layer prior to the North/South l<strong>in</strong>e project. Also this will be the first time a construction<br />
(both the bored tunnel and the deep build<strong>in</strong>g pits for the <strong>stations</strong>) is made <strong>in</strong> this clay.<br />
Table 1: Global overview <strong>of</strong> laboratory tests<br />
Soil layer Classification Sieve analysis Atterberg Triaxial Oedometer<br />
limits tests test<br />
Holocene 405 35 45 50 19<br />
Pleistocene Sand 260 80 38<br />
Pleistocene Eemclay 360 170 170 96 135<br />
Other layers 685 265 165 49 37<br />
Total 1710 550 380 233 191
GEOTECHNICAL DESIGN<br />
Geotechnical pr<strong>of</strong>ile<br />
The geotechnical data (CPT’s, boreholes) are each<br />
<strong>in</strong>terpreted to obta<strong>in</strong> a <strong>soil</strong> pr<strong>of</strong>ile. Instead <strong>of</strong> draw<strong>in</strong>g<br />
one geotechnical pr<strong>of</strong>ile along the centrel<strong>in</strong>e <strong>of</strong> the<br />
alignement <strong>of</strong> the tunnel it was decided to use a GIS.<br />
With the aid <strong>of</strong> a GIS a 3D block model, see Figure<br />
3, is constructed. The advantages <strong>of</strong> the 3D GIS<br />
block model are:<br />
1) A geotechnical pr<strong>of</strong>ile can be created <strong>in</strong> each<br />
direction and location.<br />
2) Updat<strong>in</strong>g the pr<strong>of</strong>ile is fast and easy when<br />
additional data becomes available.<br />
3) The ability to calculate the volumes <strong>of</strong> excavated<br />
<strong>soil</strong>s with a dist<strong>in</strong>ction <strong>in</strong> sands, clays, etc.<br />
The ma<strong>in</strong> disadvantage is that subjective<br />
<strong>in</strong>formation, such as possible filled-<strong>in</strong> channels, are<br />
more difficult to take <strong>in</strong>to consideration. The f<strong>in</strong>al<br />
geotechnical pr<strong>of</strong>iles are therefore corrected and<br />
adapted by hand.<br />
Geotechnical parameters<br />
The determ<strong>in</strong>ation <strong>of</strong> geotechnical parameters can<br />
not be seen apart from boundary conditions like:<br />
1) Calculations models<br />
2) Required safety<br />
Figure 3: Automatic Generation <strong>of</strong> pr<strong>of</strong>ile<br />
The calculation models and design <strong>of</strong> the build<strong>in</strong>g pit<br />
determ<strong>in</strong>e the type <strong>of</strong> geotechnical parameters.<br />
Advanced f<strong>in</strong>ite element programs with second order material models require different geotechnical<br />
parameters than analytical models. The careful selection <strong>of</strong> calculation (<strong>soil</strong>) models, the level <strong>of</strong> safety (risk<br />
analysis) and site <strong>in</strong>vestigation is the start <strong>of</strong> the determ<strong>in</strong>ation <strong>of</strong> the geotechnical parameters. In this project<br />
some <strong>of</strong> the important geotechnical parameters can be derived <strong>in</strong> several ways. In Table 2 a global overview<br />
is given <strong>of</strong> the applied <strong>in</strong>vestigation methods and the connection to some geotechnical parameters.<br />
Table 2: Global overview <strong>of</strong> Geotechnical parameters<br />
Investigation Type Phi E’50 Eoed E’ur<br />
Atterberg limits Laboratory C C<br />
Triaxial test (load<strong>in</strong>g) Laboratory X X<br />
Traixial test (unload<strong>in</strong>g) Laboratory X<br />
CPT In-situ C C C<br />
CPM In-situ X X<br />
Oedometer test Laboratory X X<br />
Void ratio Laboratory C C<br />
C Correlation<br />
X Direct measurement<br />
By careful selection <strong>of</strong> the samples and the characterisation it was possible to dist<strong>in</strong>guish a set <strong>of</strong> geological<br />
layers. When study<strong>in</strong>g these parameters further it was concluded that the variations found <strong>in</strong> the values <strong>of</strong> the<br />
stiffness parameters were not only caused by the different test methods (laboratory, <strong>in</strong>-situ), stress path, etc.<br />
But ma<strong>in</strong>ly due to differences <strong>in</strong> the stra<strong>in</strong> levels <strong>of</strong> the tests. With an <strong>in</strong>-situ test (CPM) low (10 -4 ) stra<strong>in</strong><br />
levels are <strong>in</strong>troduced <strong>in</strong> the <strong>soil</strong>, the result<strong>in</strong>g E’ur is therefore much higher than <strong>in</strong> an Oedometer test where<br />
high (10 -1 ) stra<strong>in</strong> levels are <strong>in</strong>troduced to the <strong>soil</strong> samples. This has led to the conclusion that when<br />
determ<strong>in</strong><strong>in</strong>g the design values <strong>of</strong> the geotechnical parameters it is necessary to derive the stiffness values <strong>in</strong><br />
the range <strong>of</strong> the expected stra<strong>in</strong> level. With careful <strong>in</strong>terpretation <strong>of</strong> all tests eventually a geotechnical<br />
parameter set that meets the above mentioned requirements was derived.
DESIGN PHILOSOPHY<br />
The design philosophy <strong>of</strong> the station boxes was to determ<strong>in</strong>e an acceptable balance between the safety<br />
requirements and construction costs. The guidel<strong>in</strong>es for the design, both for the build<strong>in</strong>g pits and the bored<br />
tunnel, are the predicted deformations <strong>of</strong> the adjacent build<strong>in</strong>g foundations. The deformations depend on the<br />
follow<strong>in</strong>g:<br />
a. Geotechnical behaviour (parameters)<br />
b. Calculation models (F<strong>in</strong>ite Element or Analytical)<br />
c. Construction design<br />
Knowledge <strong>of</strong> the optimal geotechnical parameters allows the <strong>soil</strong> behaviour to be determ<strong>in</strong>ed. However<br />
because it is not possible to derive the geotechnical parameters exactly from laboratory-or <strong>in</strong>-situ tests, a<br />
certa<strong>in</strong> safety marg<strong>in</strong> is <strong>in</strong>troduced. The larger the safety marg<strong>in</strong> the more secure but also the more costly. To<br />
calculate the deformations mathematical <strong>soil</strong> models are used. By us<strong>in</strong>g the latest validated FE models and<br />
technology the most accurate predictions <strong>of</strong> the deformations can be assessed. Apart from the geotechnical<br />
behaviour, the deformations depend also on the design <strong>of</strong> the build<strong>in</strong>g pit.<br />
The ma<strong>in</strong> objective is not to cause any significant damage to the adjacent build<strong>in</strong>gs, the criteria (allowable<br />
deformations <strong>of</strong> ground level and foundations) are assessed a conservative manner. In Figure 7 all the<br />
<strong>in</strong>volved elements are illustrated <strong>in</strong>clud<strong>in</strong>g their <strong>in</strong>teractions.<br />
UNDERGROUND STATIONS<br />
Four underground <strong>stations</strong> will be built <strong>in</strong><br />
the city centre <strong>of</strong> Amsterdam as a part <strong>of</strong><br />
the North/South l<strong>in</strong>e metro. For the<br />
construction <strong>of</strong> the underground <strong>stations</strong>,<br />
a build<strong>in</strong>g pit will be constructed hav<strong>in</strong>g<br />
1.2m thick braced diaphragm walls.<br />
These walls reach down to approx. NAP -<br />
35 m/ -40 m, see figure 4. The m<strong>in</strong>imum<br />
distance between the build<strong>in</strong>g pit and the<br />
historical build<strong>in</strong>gs is about 3 m. The<br />
build<strong>in</strong>g pit will be excavated <strong>in</strong> the dry<br />
after the water level <strong>in</strong>side the pit has<br />
been lowered. This can be done without<br />
<strong>in</strong>fluenc<strong>in</strong>g the water level outside the pit<br />
because the build<strong>in</strong>g pit walls cont<strong>in</strong>ue<br />
down <strong>in</strong>to the seal<strong>in</strong>g Eemclay at a depth<br />
<strong>of</strong> 20-25m. The excavation depth varies<br />
per station and will be between 26-32m<br />
below street level. With a dry excavation<br />
the vertical equilibrium <strong>of</strong> the build<strong>in</strong>g-<br />
pit base must be considered. For the<br />
deepest build<strong>in</strong>g pits safety aga<strong>in</strong>st<br />
vertical equilibrium cannot be achieved<br />
by the weight <strong>of</strong> the seal<strong>in</strong>g ground<br />
stratum (Eemclay) alone. Additional<br />
measurements are to be taken by<br />
excavat<strong>in</strong>g the deep part <strong>of</strong> the build<strong>in</strong>g<br />
pit under compressed air conditions.<br />
When the build<strong>in</strong>g pit is excavated the<br />
concrete structure can be built. The<br />
re<strong>in</strong>forced concrete diaphragm wall, which<br />
Depth [NAP + m]<br />
0<br />
-10<br />
-20<br />
-30<br />
3.0 to 9.0 m 24.5 m<br />
3.0 to 9.0 m<br />
Plaxis 2D<br />
predictions<br />
-40<br />
-40 -20 0<br />
Horizontal deformation [mm]<br />
Excavation NAP -10.0m<br />
Excavation NAP -15.0m<br />
Excavation NAP -25.3m<br />
Groutstrut<br />
Figure 4: <strong>Design</strong> Rok<strong>in</strong> Station<br />
-60<br />
0 10 20<br />
qc [MPa]<br />
30<br />
is orig<strong>in</strong>ally the reta<strong>in</strong><strong>in</strong>g wall, will be <strong>in</strong>tegrated <strong>in</strong> the permanent body. This was so decided because a<br />
composite structure <strong>of</strong> the diaphragm wall and a cast-<strong>in</strong>-situ <strong>in</strong>ner wall results <strong>in</strong> the m<strong>in</strong>imum depth <strong>of</strong> the wall<br />
structure and therefore a maximum distance between the build<strong>in</strong>g pit and the adjacent build<strong>in</strong>gs.<br />
0<br />
-10<br />
-20<br />
-30<br />
-40<br />
-50<br />
Depth [NAP + m]
INFLUENCE ON THE SURROUNDINGS<br />
In consider<strong>in</strong>g the environmental impact <strong>of</strong> construct<strong>in</strong>g these <strong>stations</strong> the follow<strong>in</strong>g elements require closer<br />
exam<strong>in</strong>ation:<br />
1. Excavation <strong>of</strong> diaphragm wall trench, which <strong>in</strong>troduces a 3D stress stra<strong>in</strong> behaviour <strong>in</strong> the <strong>soil</strong> layers.<br />
2. The self weight <strong>of</strong> the wall and the applied deck which can cause settlement <strong>of</strong> the wall.<br />
3. Excavation <strong>of</strong> the build<strong>in</strong>g pit which causes horizontal deformation <strong>of</strong> the diaphragm wall and a<br />
relaxation <strong>of</strong> the Pleistocene Eemclay which forms the bottom <strong>of</strong> the build<strong>in</strong>g pits.<br />
Some <strong>of</strong> the described mechanisms can cause settlements <strong>of</strong> nearby pile foundations, others may result <strong>in</strong><br />
heave. Also the deformation behaviour <strong>of</strong> the <strong>soil</strong> layers (clay) is time dependent due to consolidation and<br />
creep effects. This means that the f<strong>in</strong>al situation is not necessarily the critical situation, and that the entire<br />
construction process should be taken <strong>in</strong>to account. To obta<strong>in</strong> a complete picture <strong>of</strong> deformations ,it is<br />
necessary to use a FEM program, <strong>in</strong> which the full construction sequence is considered.<br />
Settlement risk assessment studies were carried out to predict the risk and degree <strong>of</strong> settlement <strong>in</strong>duced<br />
damage to adjacent structures. The specific surround<strong>in</strong>g conditions <strong>of</strong> the Amsterdam city centre necessitated<br />
the application <strong>of</strong> analytical and numerical studies to <strong>in</strong>vestigated this risk. The study results were used to<br />
def<strong>in</strong>e boundary conditions for the historical masonry build<strong>in</strong>gs and the requirements for the settlement<br />
<strong>in</strong>duc<strong>in</strong>g construction activities (Kaalberg et al).<br />
2D & 3D FE MODEL<br />
The vertical load<strong>in</strong>g <strong>of</strong> the diaphragm wall, as well as the excavation and unload<strong>in</strong>g <strong>of</strong> the Eemclay are<br />
analysed with a 2D FE model. The excavation <strong>of</strong> the diaphragm wall trench however is more complicated.<br />
This is due to 3D stress/stra<strong>in</strong> effects, therefore a 3D FE model is used. The 2D FE model is furthermore<br />
used to estimate the deformations, at ground- and foundation level, dur<strong>in</strong>g the several stages <strong>of</strong> the<br />
excavation <strong>of</strong> the deep build<strong>in</strong>g pits. Three FE s<strong>of</strong>tware programs were tested <strong>in</strong> order to select the one most<br />
suitable for the construction <strong>of</strong> the station box. Eventually Plaxis was selected ma<strong>in</strong>ly because <strong>of</strong> the<br />
extensive <strong>soil</strong> mode library. After research, both <strong>in</strong>ternally and by the University <strong>of</strong> Stuttgart, the Harden<strong>in</strong>g<br />
Soil model <strong>of</strong> Plaxis appeared to a most suitable model for very large (unload<strong>in</strong>g ) excavations <strong>in</strong> sand and<br />
clay.<br />
Harden<strong>in</strong>g Soil model<br />
The Harden<strong>in</strong>g-Soil model represents a much more advanced model than the Mohr-Coulomb model. In the<br />
Harden<strong>in</strong>g Soil model the limit<strong>in</strong>g states <strong>of</strong> stress are described by means <strong>of</strong> the friction angle, φ, the<br />
cohesion, c, and the dilatancy angle, ψ. The <strong>soil</strong> stiffness is described much more accurately by us<strong>in</strong>g three<br />
different <strong>in</strong>put stiffnesses: the triaxial load<strong>in</strong>g stiffness, E50, the triaxial unload<strong>in</strong>g stiffness, Eur, and the<br />
oedometer load<strong>in</strong>g stiffness, Eoed. In contrast to the Mohr-Coulomb model, the Harden<strong>in</strong>g-Soil model also<br />
accounts for stress-dependency <strong>of</strong> stiffness moduli. This means that all stiffnesses <strong>in</strong>crease with pressure.<br />
Build<strong>in</strong>g sequence<br />
The build<strong>in</strong>g sequence as implemented <strong>in</strong> the FE model<br />
is more or less as follows:<br />
1) Installation <strong>of</strong> diaphragm wall (stresses only)<br />
2) Installation <strong>of</strong> deck<br />
3) 6 excavation phases up to NAP -32m.<br />
a) lower water table <strong>in</strong>side pit<br />
b) dry excavation<br />
c) plac<strong>in</strong>g struts<br />
d) consolidation (2-4 months)<br />
4) Installation <strong>of</strong> concrete and structure<br />
Sometimes special build<strong>in</strong>g steps are <strong>in</strong>cluded to model<br />
excavation under air-pressure or the <strong>in</strong>stallation <strong>of</strong> groutstruts<br />
before excavation. Includ<strong>in</strong>g steps for numerical<br />
stability more than 100 calculation steps are used to<br />
model a s<strong>in</strong>gle excavation.<br />
harden<strong>in</strong>g<br />
shear locus<br />
cap with<br />
compression<br />
harden<strong>in</strong>g<br />
Figure 5: Plaxis Harden<strong>in</strong>g Soil model
FE MODEL VALIDATION<br />
The ma<strong>in</strong> objective <strong>of</strong> the FE calculations is to create a frame <strong>of</strong> reference for the expected deformations. For<br />
this reason a large amount <strong>of</strong> sensitivity calculations were made after which a set <strong>of</strong> new calculations was<br />
created. In this new set <strong>of</strong> calculations the <strong>soil</strong> parameters (lower, average and upper limit value) were varied<br />
such that special features like maximum horizontal bend<strong>in</strong>g <strong>of</strong> diaphragm wall could be calculated.<br />
The 3D FE model is validated with the results <strong>of</strong> a special test project. This test project was conducted to<br />
ga<strong>in</strong> more <strong>in</strong>sight <strong>in</strong> the deformations that occur dur<strong>in</strong>g <strong>in</strong>stallation <strong>of</strong> a diaphragm wall <strong>in</strong> Amsterdam <strong>soil</strong><br />
conditions.<br />
After validation <strong>of</strong> the 3D FE model the total deformations, <strong>in</strong>stallation <strong>of</strong> diaphragm wall (3D FE model)+<br />
excavation <strong>of</strong> build<strong>in</strong>g pit (2D FE model) are calculated.<br />
Diaphragm wall test<br />
The ma<strong>in</strong> objectives for the full-scale test on a construction site <strong>in</strong> Amsterdam are:<br />
• Expand<strong>in</strong>g the knowledge on this subject, so that design if necessary can be made <strong>in</strong> advance.<br />
• Validation <strong>of</strong> 3D- FE model based on the test results.<br />
• Ga<strong>in</strong>ed <strong>in</strong>sight <strong>in</strong> the specific execution aspects <strong>of</strong> diaphragm wall <strong>in</strong>stallation <strong>in</strong> Amsterdam <strong>soil</strong>.<br />
The test project <strong>of</strong> the diaphragm wall <strong>in</strong>stallation consists <strong>of</strong> three parts:<br />
1. Prediction <strong>of</strong> the impact with a 3D FE model<br />
2. Full scale test at a construction site <strong>in</strong> Amsterdam<br />
a. Measurement <strong>of</strong> vertical and<br />
horizontal deformations <strong>of</strong><br />
the <strong>soil</strong> adjacent to the<br />
excavated trench, see<br />
figure 6.<br />
b. Settlement <strong>of</strong> loaded piles<br />
c. Impact on bear<strong>in</strong>g capacity<br />
<strong>of</strong> piles, due to excavation<br />
and concret<strong>in</strong>g <strong>of</strong><br />
succeed<strong>in</strong>g diaphragm wall<br />
panels.<br />
3. Validation <strong>of</strong> 3D FE model based<br />
on the test results that have<br />
become available.<br />
At this moment the validation <strong>of</strong> the<br />
3D model is f<strong>in</strong>alised. Nevertheless<br />
the follow<strong>in</strong>g conclusions can be<br />
taken:<br />
• The test results show that the<br />
<strong>in</strong>stallation <strong>of</strong> a diaphragm wall<br />
on this project has a m<strong>in</strong>or effect<br />
on the surround<strong>in</strong>gs and no<br />
significant impact on the piles <strong>of</strong><br />
nearby foundations (de Wit, et<br />
al, 1999).<br />
• The prediction by means <strong>of</strong> a 3D<br />
FE model proved, apart from<br />
consolidation effects, to be able<br />
to predict the deformations<br />
caused by the succeed<strong>in</strong>g stages<br />
<strong>in</strong> the <strong>in</strong>stallation <strong>of</strong> the<br />
diaphragm wall. In general the<br />
FE predictions result <strong>in</strong> larger<br />
deformations than monitored at<br />
the test program.<br />
60 m<strong>in</strong>utes<br />
Horizontal Deformation Incl<strong>in</strong>ometer dur<strong>in</strong>g<br />
concret<strong>in</strong>g <strong>of</strong> diaphragm wall [mm]<br />
45 m<strong>in</strong>utes<br />
20 m<strong>in</strong>utes<br />
10 m<strong>in</strong>utes<br />
Figure: 6 Results <strong>of</strong> <strong>in</strong>cl<strong>in</strong>ometer measurements<br />
Depth [NAP +m]
MONITORING<br />
To anticipate ground movement and damage to build<strong>in</strong>gs dur<strong>in</strong>g construction and to enable timely and<br />
appropriate actions, an effective monitor<strong>in</strong>g concept has been designed. Build<strong>in</strong>gs will be monitored us<strong>in</strong>g a<br />
fully automatic system <strong>of</strong> total <strong>stations</strong> and sensors. This on-l<strong>in</strong>e system will provide direct data for<br />
<strong>in</strong>terpretation <strong>in</strong> the design <strong>of</strong>fice. A system <strong>of</strong> partly automatic and partly manual monitor<strong>in</strong>g will be carried<br />
out dur<strong>in</strong>g the construction activities for the <strong>stations</strong>:<br />
• vertical ground deformations on surface level (outside the pit) with precise levell<strong>in</strong>g po<strong>in</strong>ts and on<br />
deeper levels (<strong>in</strong>side and outside the pit) with extensometers;<br />
• horizontal ground deformations with <strong>in</strong>cl<strong>in</strong>ometers;<br />
• horizontal and vertical deformations <strong>of</strong> the diaphragm wall (precise levell<strong>in</strong>g po<strong>in</strong>ts and <strong>in</strong>cl<strong>in</strong>ometer);<br />
• strut monitor<strong>in</strong>g<br />
An area <strong>of</strong> about 70 m around the build<strong>in</strong>g pit will be monitored. The monitor<strong>in</strong>g activities for the<br />
North/South L<strong>in</strong>e are divided <strong>in</strong>to three stages:<br />
a. Base monitor<strong>in</strong>g: Base monitor<strong>in</strong>g is carried out before construction works starts and will determ<strong>in</strong>e the<br />
natural settlement behaviour and seasonal (temperature) effects on the deformations <strong>of</strong> the build<strong>in</strong>gs.<br />
b. Process monitor<strong>in</strong>g: Process monitor<strong>in</strong>g is carried out dur<strong>in</strong>g construction and results will be provided<br />
on-l<strong>in</strong>e. The sample rate depends on the process (bored tunnel/build<strong>in</strong>g pit).<br />
c. Close out monitor<strong>in</strong>g: Closeout monitor<strong>in</strong>g cont<strong>in</strong>ues after build<strong>in</strong>g activities have ended and register<br />
long-term settlement behaviour.<br />
The monitor<strong>in</strong>g <strong>in</strong>formation is analysed and processed <strong>in</strong> such a way that dur<strong>in</strong>g the construction period<br />
changes to the design/process can be made. This approach has been used to some success <strong>in</strong> several projects<br />
<strong>in</strong> the UK and is usually called the Observational method [Anon 1996].<br />
Settlement Risk Management with GIS<br />
Settlement risk management is a important tool <strong>in</strong> controll<strong>in</strong>g the effects <strong>of</strong> construction activities on the<br />
surround<strong>in</strong>gs. It is implemented by a special developed Geographic Information System (GIS). The GIS has<br />
various modules that are used <strong>in</strong> the settlement risk management :<br />
• <strong>Design</strong><br />
• data <strong>of</strong> defect surveys<br />
• settlement predictions by FE modell<strong>in</strong>g <strong>of</strong> <strong>stations</strong>’ construction;<br />
• damage classification system by 3D numerical risk assessment studies on typical masonry structures<br />
us<strong>in</strong>g settlement predictions;<br />
• build<strong>in</strong>g classification based on damage classification system and settlement predictions<br />
• mitigat<strong>in</strong>g measures for locations with unacceptable damage risk<br />
• Construction<br />
• monitor<strong>in</strong>g data<br />
With<strong>in</strong> the design phase GIS is used to comb<strong>in</strong>e settlement predictions and build<strong>in</strong>g classifications along the<br />
station <strong>in</strong> order to confirm or adjust the <strong>stations</strong>’ design or to design mitigat<strong>in</strong>g measures. Dur<strong>in</strong>g<br />
construction the GIS allows for rapid <strong>in</strong>terpretation <strong>of</strong> the monitor<strong>in</strong>g data us<strong>in</strong>g the <strong>in</strong>formation from the<br />
design modules. If necessary back analyses can be carried out and be implemented <strong>in</strong> the GIS. In this way a<br />
early decision can be made about active measures.<br />
CONCLUSIONS<br />
Extensive parametric studies were carried out tak<strong>in</strong>g <strong>in</strong>to account the upper and lower bound values <strong>of</strong> both<br />
geotechnical parameters as well as material properties <strong>of</strong> the concrete structure. The result is a<br />
range/envelope <strong>of</strong> deformations <strong>in</strong> the sub<strong>soil</strong> that represents the impact <strong>of</strong> construction on the surround<strong>in</strong>gs<br />
and that will have to meet the boundary conditions <strong>of</strong> the masonry build<strong>in</strong>gs. This is achieved with both<br />
passive as well as active measures <strong>in</strong> the <strong>stations</strong> design. Passive measures are taken <strong>in</strong> advance e.g. six or<br />
seven strut levels, a deep jet grout strut etc. An active measure is taken dur<strong>in</strong>g construction and based on<br />
relation between numerical analysis results and monitor<strong>in</strong>g results dur<strong>in</strong>g construction (observational<br />
method). Active measures can be the pre-stress<strong>in</strong>g level <strong>of</strong> the struts or <strong>in</strong>creas<strong>in</strong>g the compressed air. This<br />
means that the design must be suitable to this possible active measures. In a complex project like the
excavation <strong>of</strong> a build<strong>in</strong>g pit (dimensions :<br />
lxhxw=120mx30mx20m) <strong>in</strong> a busy city very close<br />
(