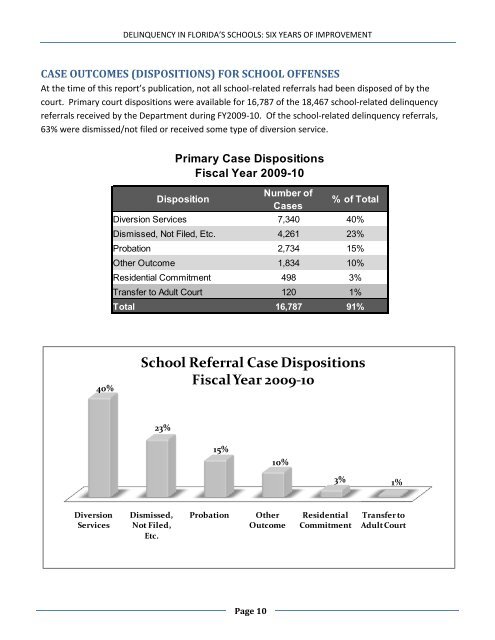
DELINQUENCY IN FLORIDA’S SCHOOLS: SIX YEARS OF IMPROVEMENTCASE OUTCOMES (DISPOSITIONS) FOR SCHOOL OFFENSESAt the time <strong>of</strong> this report’s publication, not all school-related referrals had been disposed <strong>of</strong> by thecourt. Primary court dispositions were available for 16,787 <strong>of</strong> the 18,467 school-related <strong>del<strong>in</strong>quency</strong>referrals received by the <strong>Department</strong> dur<strong>in</strong>g FY2009-10. Of the school-related <strong>del<strong>in</strong>quency</strong> referrals,63% were dismissed/not filed or received some type <strong>of</strong> diversion service.Primary Case DispositionsFiscal Year 2009-10DispositionNumber <strong>of</strong>Cases% <strong>of</strong> TotalDiversion Services 7,340 40%Dismissed, Not Filed, Etc. 4,261 23%Probation 2,734 15%Other Outcome 1,834 10%Residential Commitment 498 3%Transfer to Adult Court 120 1%Total 16,787 91%40%School Referral Case DispositionsFiscal Year 2009-1023%15%10%3% 1%DiversionServicesDismissed,Not Filed,Etc.ProbationOtherOutcomeResidentialCommitmentTransfer toAdult CourtPage 10
DELINQUENCY IN FLORIDA’S SCHOOLS: SIX YEARS OF IMPROVEMENTDEMOGRAPHICS AND CASE OUTCOMES FOR SCHOOL OFFENSESThere are substantial differences <strong>in</strong> case outcomes for school <strong>of</strong>fenses between white youth and theirnonwhite counterparts. Black youth were substantially more likely to have their cases dismissed thantheir white counterparts. Black youth were <strong>in</strong>volved <strong>in</strong> 51% <strong>of</strong> cases that were dismissed or not filed,compared to 32% for white youth. In addition, black males were much more likely to receive acommitment disposition or to have their cases transferred to adult court. Of the cases that resulted <strong>in</strong> atransfer to adult court, 70% <strong>in</strong>volved a black youth.Case Disposition Demographics for School Referrals (Fiscal Year 2009-10)Disposition TypeWhiteMaleWhiteFemaleBlackMaleBlackFemaleHispanicWhiteMaleHispanicWhiteFemaleHispanicBlackMaleHispanicBlackFemaleOtherMaleOtherFemaleDiversion Services 2,079 804 1,895 1,028 941 266 37 20 204 66 7,340Dismissed, Not Filed, Etc. 965 374 1,587 600 426 118 33 7 123 28 4,261Probation 744 177 1,046 353 254 36 26 9 72 17 2,734Other Outcome 501 134 680 228 181 46 6 2 46 10 1,834Residential Commitment 125 9 234 49 45 6 3 0 26 1 498Transfer to Adult Court 17 1 82 2 9 0 3 0 6 0 120Total Dispositions 4,431 1,499 5,524 2,260 1,856 472 108 38 477 122 16,787TotalCase Disposition Demographic Percentages for School Referrals (Fiscal Year 2009-10)Disposition TypeWhiteMaleWhiteFemaleBlackMaleBlackFemaleHispanicWhiteMaleHispanicWhiteFemaleHispanicBlackMaleHispanicBlackFemaleOtherMaleOtherFemaleDiversion Services 28% 11% 26% 14% 13% 4% 1% 0% 3% 1% 100%Dismissed, Not Filed, Etc. 23% 9% 37% 14% 10% 3% 1% 0% 3% 1% 100%Probation 27% 6% 38% 13% 9% 1% 1% 0% 3% 1% 100%Other Outcome 27% 7% 37% 12% 10% 3% 0% 0% 3% 1% 100%Residential Commitment 25% 2% 47% 10% 9% 1% 1% 0% 5% 0% 100%Transfer to Adult Court 14% 1% 68% 2% 8% 0% 3% 0% 5% 0% 100%% <strong>of</strong> Total Dispositions 26% 9% 33% 13% 11% 3% 1% 0% 3% 1% 100%TotalCase Dispositions by Race/EthnicityFiscal Year 2009-10Disposition Type White Black Hispanic Other TotalDiversion Services 39% 40% 17% 4% 100%Dismissed, Not Filed, Etc. 31% 51% 14% 4% 100%Probation 34% 51% 12% 3% 100%Other Outcome 35% 50% 13% 3% 100%Residential Commitment 27% 57% 11% 5% 100%Transfer to Adult Court 15% 70% 10% 5% 100%Total 35% 46% 15% 4% 100%Page 11