Cultus Lake Park Sanitary Sewer Infrastructure Assessment
Cultus Lake Park Sanitary Sewer Infrastructure Assessment
Cultus Lake Park Sanitary Sewer Infrastructure Assessment

You also want an ePaper? Increase the reach of your titles
YUMPU automatically turns print PDFs into web optimized ePapers that Google loves.
Place Image over thisBlue Box Area.This box will not print.
Fraser Valley Regional District<strong>Cultus</strong> <strong>Lake</strong> <strong>Sanitary</strong> <strong>Sewer</strong> <strong>Infrastructure</strong> <strong>Assessment</strong> – Final ReportTable of Contents1.0 Introduction 11.1 Background 11.2 Scope of Work 11.3 Reference Materials 21.4 Abbreviations 22.0 Existing System and Conditions 32.1 Population 32.2 Existing Flows 42.3 Ministry of Environment (MoE) Permit 42.4 Upgrade Options 53.0 Design Criteria 63.1 Projected Population 63.2 Land Use 63.3 Design Flows 73.4 Effluent Limits 83.5 Influent Parameters 93.6 MSR Design Standards 94.0 Treatment Options 104.1 Option 1 – Effluent Class D 104.2 Option 2 and 3 – Effluent Class C and A 104.3 Preliminary Treatment 114.4 Secondary Treatment 124.5 Disinfection 194.6 Sludge Treatment 214.7 Discharge to Ground 235.0 Pumping Option (Option 4) 246.0 Treatment and Pumping Options Evaluation 257.0 Opinion of Probable Costs 278.0 Net Present Value Analysis 289.0 Conclusion and Recommendation 299.1 Conclusion 299.2 Recommendation 29AppendicesAppendix AAppendix BAppendix CAppendix DAppendix EAppendix FDeveloped Treatment and Pumping Option SourcesDesign FlowsConceptual DrawingsOpinion of Probable Capital, Operating and Maintenance Costs & NetPresent Value (NPV) AnalysisProposed Location of Ground Water WellsPrevious Studies and PermitProject No. 30825 – September, 2012Table of Contents
Fraser Valley Regional District<strong>Cultus</strong> <strong>Lake</strong> <strong>Sanitary</strong> <strong>Sewer</strong> <strong>Infrastructure</strong> <strong>Assessment</strong> – Final ReportTablesTable 1: East and West residents Population 3Table 2: Historical Maximum Daily Flow 4Table 3: Projected Populations (20 years) 6Table 4: Land Use 7Table 5: Design Flows for the Treatment and Pumping Options 7Table 6: Effluents Limits ? Discharge to Ground) (MSR Regulation – Schedule 12? Table1) 8Table 7: Influent Parameters and Effluent Limits 9Table 8: Preliminary Equipment Summary and Capacities 12Table 9: Secondary Treatment – Advantages and Disadvantages 17Table 10: Secondary Treatment Preliminary Sizing 19Table 11: Disinfection Options – Advantages and Disadvantages 20Table 12: Preliminary sizing of UV reactors 21Table 13: Belt Press and Centrifuge – Advantages and Disadvantages 21Table 14: Belt Filter Press Sizing 22Table 15: Levelton Consultant Percolation Test – East Field 23Table 16: Drainage Pipe Lengths for each option 23Table 17: Preliminary sizing of pump station 24Table 18: Treatment and Pumping Options – Advantages and Disadvantage 25Table 19: Opinion of Probable Costs 27Table 20: Net Present Value Results 28Project No. 30825 – September, 2012Table of Contents
Fraser Valley Regional District<strong>Cultus</strong> <strong>Lake</strong> <strong>Sanitary</strong> <strong>Sewer</strong> <strong>Infrastructure</strong> <strong>Assessment</strong> – Final Report1.0 IntroductionISL Engineering and Land Services Ltd. (ISL) was commissioned by Fraser ValleyRegional District (FVRD) to conduct an assessment of <strong>Cultus</strong> <strong>Lake</strong> <strong>Sanitary</strong> <strong>Sewer</strong><strong>Infrastructure</strong>. The purpose of study is to assess the existing infrastructure and determinethe required work to accommodate existing and future demands.1.1 Background<strong>Cultus</strong> <strong>Lake</strong> <strong>Park</strong> Community is located approximately 90.0 kilometers from the City ofVancouver and 11.0 kilometers south west of the City of Chilliwack. The park is locatedwithin Electoral Area “E“ within the Fraser Valley Regional District (FVRD). The park is acommunity of seasonal and full?time residences, commercial business and camp?sites(Sunnyside Campground and others). Approximately 930 people reside in the <strong>Park</strong>throughout the year. <strong>Cultus</strong> <strong>Lake</strong> is a tourist destination and in a summer season, it canattract more than one million visitors for daily?use and overnight camping.<strong>Cultus</strong> <strong>Lake</strong> is served by a sewage collection and treatment system. Septic tanks anddisposal fields are used for treatment. The system was constructed in 1970 andupgraded in 1979, and it is operated by the <strong>Cultus</strong> <strong>Lake</strong> <strong>Park</strong> Board (CLPB). The existingsystem is mainly comprised of the East and West Systems with authorized capacities of360 m3/day and 90 m3/day respectively. In addition to these systems, individual septictanks and disposal fields are used to serve different areas within <strong>Cultus</strong> <strong>Lake</strong> <strong>Park</strong>Community.1.2 Scope of WorkISL’s scope of work on this study is summarized below:• Assess the existing infrastructure and determine the required work toaccommodate the existing and future demand.• Develop Treatment/Transferring Options to accommodate the existing and futureflow rates. The Options that will be investigated are as follows:o Option 1: expand the existing system to accommodate the design flowrate using the same treatment scheme (i.e. septic tanks).o Option 2: provide secondary treatment option to comply with Class?Ceffluent according to the Municipal Sewage Regulation (MSR)o Option 3: provide high quality secondary treatment to comply with Class?oA effluent according to the Municipal Sewage Regulation (MSR)Option 4: abandon existing disposal field and send the wastewater to theCity of Chilliwack sewer system.• Prepare conceptual capital cost estimates, yearly operation and maintenancecosts (O&M), and net present value (NPV) for all options.• Evaluate all the Options based on the advantages, disadvantages, costestimates and NPV and recommend the Ultimate Option for implementation• Prepare engineering report that consolidates the findings of the study into acomprehensive document.The scope of work also includes preparing engineering drawings for a pump station andodor control package, the drawings is not part of this report.Project No. 30825 – September, 2012 Page 1
Fraser Valley Regional District<strong>Cultus</strong> <strong>Lake</strong> <strong>Sanitary</strong> <strong>Sewer</strong> <strong>Infrastructure</strong> <strong>Assessment</strong> – Final Report1.3 Reference MaterialsThe following documents were reviewed as part of this project:• B.C. Ministry of Environment, Municipal Sewage Regulation, includesamendments up to B.C. Reg. 4/2010, January 2010, (B.C. MoE, 2010)• Dayton and Knight Ltd Consulting Engineers, Fraser Valley Regional District –<strong>Cultus</strong> <strong>Lake</strong> <strong>Sewer</strong> <strong>Assessment</strong>, (Dayton and Knight 2010)• Urban Systems, <strong>Cultus</strong> <strong>Lake</strong> <strong>Park</strong>, Financial Sustainability and GovernanceAlternatives, (Urban System, 2003)• <strong>Cultus</strong> <strong>Lake</strong> <strong>Park</strong> board, <strong>Cultus</strong> <strong>Lake</strong> <strong>Park</strong> Plan, (CLPB, 1997)• Omega & Associates Engineering (1978) Ltd, Regional District of Fraser Cheam,<strong>Cultus</strong> <strong>Lake</strong> <strong>Sewer</strong>age System – as built drawings, (Omega & AssociatesEngineering (1978) Ltd., 1979)• City of Chilliwack, Subdivision and Land Development By law 2004, No.3055?Schedule B, (City of Chilliwack, 2004).• B.C. Ministry of Health, <strong>Sewer</strong>age System Standard Practice Manual Version 2,2007, (Ministry of Health, 2007)• B.C. Ministry of Environment, Permit 5526, (B.C. Ministry of Environment, Issued1979, amended 2011• Piteau Associates, Inspection of Sewage Disposal Fields, (Piteau Associates,2008)• Levelton Consultants Ltd, Field Review Report, ( Levelton Consultants Ltd, 2010)• Urban Systems, <strong>Cultus</strong> <strong>Lake</strong> Financial Sustainability and GovernanceAlternatives – <strong>Infrastructure</strong> Servicing Update, (Urban Systems, 2008)1.4 AbbreviationsACActivated SludgeB.C.MoE British Columbia, Ministry of EnvironmentB.C.MoT British Columbia, Ministry of TransportationBODBiological oxygen DemandL/sLiter per secondL/c/dLiter/capita/dayMBBR Moving Bed Biological ReactorMBRMembrane Biological Reactorm3/day Cubic meter per daymin.MinutesRBCRotating Biological ContactorTSSTotal Suspended SolidsSBRSequential Batch ReactorProject No. 30825 – September, 2012 Page 2
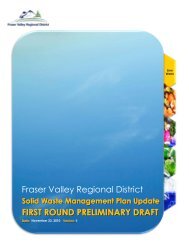
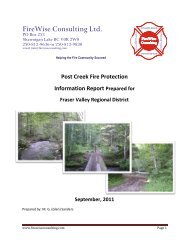
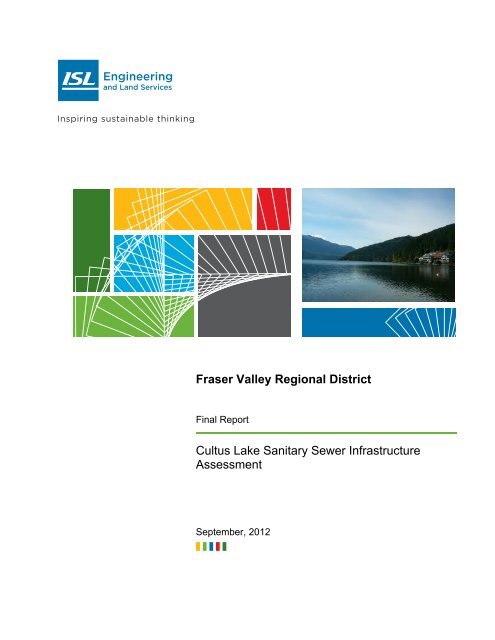
Fraser Valley Regional District<strong>Cultus</strong> <strong>Lake</strong> <strong>Sanitary</strong> <strong>Sewer</strong> <strong>Infrastructure</strong> <strong>Assessment</strong> – Final Report2.0 Existing System and Conditions<strong>Cultus</strong> <strong>Lake</strong> is served by a sewage collection and treatment system. Septic tanks anddisposal fields are used for treatment. The system was constructed in 1979 and it isoperated by the <strong>Cultus</strong> <strong>Lake</strong> <strong>Park</strong> Board (CLPB). The existing system is mainlycomprised of the following:• The east system serves the residents located on the east side of the <strong>Park</strong>. Thegenerated sewage discharges by gravity to a lift station (SL1) which pumps thecollected sewage to four septic tanks. The effluent from the septic tanksoverflows to lift station (SL3) which pumps the collected effluent to eight disposalfields (Field 1?8). The authorized capacity of the east disposal system is 360m3/day.• The west system serves the residents located on the west side of the <strong>Park</strong>. Onelift station (SL2) is used to collect the sewage and pump it back to the north sideof the collection system to overcome the variation of the ground levels betweenthe south and north side. The sewage discharges by gravity directly to two septictanks. The effluent from the septic tanks overflows to lift station (SL4) whichpumps the collected sewage to four disposal fields (Field 1?4). The authorizedcapacity of the west disposal system is 90 m3/day.Figure 1 outlines the location of the system components within the community. Inaddition to the east and west systems, individual septic tanks and disposal fields areused to serve different areas such as; Mountainview, <strong>Park</strong> Drive, and <strong>Park</strong>view mobilehomes. These areas are not currently connected to the <strong>Cultus</strong> <strong>Lake</strong> sanitary sewagecollection system.2.1 PopulationThe <strong>Park</strong> includes seasonal and full?time residents. The estimated full?time residentpopulation (2003) was around 930 persons (<strong>Cultus</strong> <strong>Lake</strong> <strong>Park</strong>, Financial Sustainabilityand Governance Alternatives, Urban Systems 2003) based on 457 single family homeswhich represents 2.03 persons/household.Currently, the number of lots in the east side, west side, Mountain View/<strong>Park</strong> Drive, andplanned <strong>Cultus</strong> <strong>Lake</strong>side condominium are 300, 80, 86 and 21 respectively. Based on the(2003) persons per household, and the total number of lots (487), the estimated full timeresident population is likely around 990 persons. The estimated population of the eastand west residents is shown on Table 1.Table 1: East and West residents PopulationDescription East Residents West ResidentsNumber of lots 300 80Residents/lot 2.03 2.03Population 609 163Project No. 30825 – September, 2012 Page 3
4225364367380412383368425399426379413384395424369378414428353415386422360371429392421441403417446358391373356357389405418432SUNNYSIDE BLVD.ROADPARMENTEROffice42824305PARK4234422442544244LAKESHORESL4PDR.4169DFO Office/Site4220CommunityHall42224222A4222BDISTRIBUTIONFIELDSWSECOND AVENUE4226SOOWAHLIE4223423342394229FIRST AVE.42644243PARK LANE4219425342304263200312313309307308310 213311 214215216211212V1920212223242526210A208209210205206207MUNROE AVE.LAKESHOREDR.18172012022032041667891011125432141674165<strong>Park</strong> Office41634161Cabins4170Gas Station80WWater Slides4150DUMP ROAD41044100409640944088Debby Whitfield / Nov. 17, 11 / T:\Projects\30000\30825 - <strong>Cultus</strong> Saintary <strong>Sewer</strong> <strong>Infrastructure</strong> <strong>Assessment</strong>\Client Data\Drawings\Figure 1.dwg22922844AVE.219220MUNROE227221218V2232242252262161W2162W217434241P3334353637383940LEGENDP200mmPVC75mm PVCW272829303132SL2Pump StationGravity <strong>Sewer</strong>Force Main<strong>Cultus</strong> <strong>Lake</strong> <strong>Park</strong> Board LandGroundwater WellMonitoring WellBoatRental77106 2061071081091101111131142051151161182072082091192102111201211221232132141242151252161262171272 AVE.218219128129SL12201307131312212221327122231347112242251357101 AVE. 1 AVE.226227136137709138284229139708230232140141<strong>Park</strong>ing142143144285145707146147234235148283149236150151286237152153154155156306238239157706P158159282308287309240160161162241242243166705167281305327244168245169288328246329347247170171172173280310304330348248174249175176704365 366250177251178252253289326345279349381 382254180703255311256303257331397 398258259181182290260183702FIR ST.325261278312350262302363263184185332396291264186701277324344351410313265301292333Mini Golf78HEMLOCK ST.1 AVE.700400276323409427266314342352436300385267293334361423394370408275322401299315377341435294335439268393407274SPRUCE ST.Church74321316402269298BALSAM ST.PINE ST.CEDAR ST.ALDER ST.BIRCH ST.340354416434387295336MAPLE ST.37635927331733833937240643035529738843350296337WILLOW ST.marina320419420443319OAK ST.1 AVE.374404431390442447270413175FirehallWorks Yard70SchoolVV65600601Restaurant60260350289604605504Plaza736 5 2 14WPWGENERATORWELL HOUSEEXISTING WELLNEW WELL6066075066086095084125610611510612613512615 614514SL3617 6165166186195184121Store/Playground620621520622623522DISTRIBUTIONFIELDS624625524626627526CULTUS LAKEPARK BOARD628629528631530PARK DR.630MOUNTAINVIEW RD.632633532634635534636637536638639538640641540643 642542644645544646647546648649548650651550652653552654655554CULTUS LAKESANITARY SEWER ASSESSMENTLand UseFigure 1November, 2011
Fraser Valley Regional District<strong>Cultus</strong> <strong>Lake</strong> <strong>Sanitary</strong> <strong>Sewer</strong> <strong>Infrastructure</strong> <strong>Assessment</strong> – Final Report2.2 Existing Flows<strong>Cultus</strong> <strong>Lake</strong> <strong>Park</strong> Board (CLPB) monitors the actual flow to the east and west field usinga flow meters installed within SL1 and SL4 respectively. The CLPB monitors the dailyflows on a weekly basis; the weekly reading is recorded and divided by seven days toobtain the daily flows based on weekly basis. Table 2 provides the recorded daily flowsbased on a weekly basis.Table 2: Historical Maximum Daily FlowEast and West Fields (based on weekly measurements)East FieldWest FieldYearMaximum l/c/d Maximum l/c/dDaily FlowDaily Flowm3/daym3/day2003 272.9 448.1 N/A N/A2004 209.1 343.3 N/A N/A2005 179.5 294.7 N/A N/A2006 256.1 420.5 N/A N/A2007 171.2 281.1 N/A N/A2008 117.0 192.1 131 801.92009 86.6 142.2 76 466.32010 77.5 127.3 71.5 438.7The flows based on liter/capita/day (l/c/d) varied considerably between the years andbetween the East and West field readings. As per Table 2, the flow dropped considerablyfrom 2008 to 2010 and it may be due to flow meter malfunction as indicated in the Daytonand Knight Consulting Engineers Report, “Fraser Valley Regional District, <strong>Cultus</strong> <strong>Lake</strong><strong>Sewer</strong> <strong>Assessment</strong>, 2010”. The daily data from January 2011 to October 2011 wereavailable to ISL for review. The data still shows a considerable drop in the daily flowsespecially for the East Field.The collected data is also based on a weekly basis which may not represent the actualmaximum daily flow; especially that <strong>Cultus</strong> <strong>Lake</strong> may experience high residents duringweekends.The historical data is based on the maximum days which usually in summer. Thegenerated sewage flows, especially the area contributing to the East field, is consideredlow in terms of (l/c/d) compared with other communities. The low sewage flow (l/c/d) canbe attributed to either a high un?occupied dwellings or faulty flow meter.2.3 Ministry of Environment (MoE) PermitIn February 2011, the Ministry of Environment issued Permit # 5526 to the Fraser ValleyRegional District which identifies certain requirements that have to be met for the sanitarysystem including submitting a written report for Maintenance and Repairs. The permitalso sets the maximum authorized discharge rate to the east and west disposal fields at360 m3/day and 90 m3/day respectively.Project No. 30825 – September, 2012 Page 4
Fraser Valley Regional District<strong>Cultus</strong> <strong>Lake</strong> <strong>Sanitary</strong> <strong>Sewer</strong> <strong>Infrastructure</strong> <strong>Assessment</strong> – Final ReportThe maximum authorized rate for the east disposal field is sufficient to accommodate theexisting development and an additional 17 single family homes on Mountain View Roadand <strong>Park</strong> Drive and 21 condominium homes located next to <strong>Cultus</strong> <strong>Lake</strong> approximately1.5 km south of <strong>Park</strong> Drive, as indicated by the permit. The west disposal field issufficient for the existing homes located on the west side of <strong>Cultus</strong> <strong>Lake</strong>, as indicated bythe permit.The Permit identifies certain requirements and repairs that have to be met prior toconnecting the additional 17 single family homes on Mountain View Road and <strong>Park</strong> Driveand the 21 condominium homes which includes the repairs identified in Dayton andKnight report, 2010 and assurance of properly operating flow monitoring devices. ISLreviewed the recommended repairs and in full agreement with the required repairsidentified in the report.Due to the uncertainty of the historical flow data relative to the population, werecommend that the CLPB contacts the flow meters’ manufacturers for verification ofexisting flow meters readings prior to connecting the identified additional developments. Ifthe flow meters were proven non repairable, replacement of the flow meters is required.The Fraser Valley Regional District (FVRD) is planning to expand its sewage collectionsystem and add new areas to the system beyond the above identified developments. It isanticipated that adding the new areas will result in exceeding the authorized capacity ofthe east and west fields. Major upgrades will be required to accommodate the desiredservice areas. The MoE has also indicated that the existing treatment system may needto be upgraded to a secondary treatment process or better to accommodate future flowincreases.2.4 Upgrade OptionsFour options were investigated to accommodate existing and future flow rates. TheOptions that were investigated by ISL are as follows:• Option 1: expand the existing system to accommodate the design flow rate usingthe same treatment scheme (i.e. septic tanks and disposal fields).• Option 2: provide secondary treatment option to comply with Class?C effluentaccording to the Municipal Sewage Regulation (MSR)• Option 3: provide high quality secondary treatment to comply with Class?Aeffluent according to the Municipal Sewage Regulation (MSR)• Option 4: abandon existing disposal fields and pump the sewage to the City ofChilliwack’s sewer system for treatment.Design criteria and conceptual design for the upgrade options were developed todetermine the most suitable option for <strong>Cultus</strong> <strong>Lake</strong>.Project No. 30825 – September, 2012 Page 5
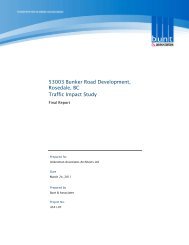
Fraser Valley Regional District<strong>Cultus</strong> <strong>Lake</strong> <strong>Sanitary</strong> <strong>Sewer</strong> <strong>Infrastructure</strong> <strong>Assessment</strong> – Final Report3.0 Design Criteria3.1 Projected PopulationThe <strong>Cultus</strong> <strong>Lake</strong> <strong>Park</strong> Community includes seasonal and full?time residents; theestimated full time resident population is likely around 990 persons. This population figuredoes not account for the population in the summer months when more people reside inseasonal dwellings, motorhomes, and campgrounds. FVRD is anticipating that the yearlypopulation growth rate will be about 2.5%, similar to the City of Chilliwack’s projectedgrowth rate.Table 3 provides the projected population growth resulting over 20 years.Table 3: Projected Populations (20 years)YearPopulation2011 9902016 11202021 12672026 14342031 16223.2 Land UseThe FVRD is planning to extend its sanitary sewage service, beyond the east and westareas, to include areas that are not connected to the sanitary sewer system. The plannedareas are as follows:• Residences of Mountainview and <strong>Park</strong> Drive, 86 single family units (3 bedroom)• <strong>Cultus</strong> <strong>Lake</strong>side condominium development, located approximately 1.5 km southof <strong>Park</strong> Drive, 21 single family (2 bedroom).• <strong>Cultus</strong> <strong>Lake</strong>/<strong>Park</strong>view, 184 mobile home units• Sunnyside Campground, 348 Seasonal sites, 104 full hookup sites, 134 tentingsites, group campsites (2 waterfront sites hold up to 50 people)In addition to planned areas, an area of 12.5 ha is allocated for future residentialexpansion to accommodate for the increase of population from 990 (2011) to 1622 (2031)expected from annual growth.Figures 2 outlines the existing and planned areas that will be included and the areas arecategorized as residential, commercial and institutional areas. Table 4 provides the areasassociated with each category.Project No. 30825 – September, 2012 Page 6
PARK<strong>Cultus</strong> <strong>Lake</strong>WestCommercial &InstitutionalMobile Home <strong>Park</strong><strong>Cultus</strong> <strong>Lake</strong>EastFutureResidentialCULTUS LAKEPARK BOARDMountain View and<strong>Park</strong> DriveSunny Side CampgroundDebby Whitfield / Jun. 19, 12 / T:\Projects\30000\30825 <strong>Cultus</strong> <strong>Sanitary</strong> <strong>Sewer</strong> <strong>Infrastructure</strong> <strong>Assessment</strong>\Client Data\Drawings\Figure 1.dwgLEGENDResidential <strong>Cultus</strong> <strong>Lake</strong> East (12.8 ha) <strong>Cultus</strong> <strong>Lake</strong> West (3.8 ha) Mountain View / <strong>Park</strong> Drive (9.5 ha) <strong>Lake</strong>side Condominiums (1.3 ha) Mobile Home <strong>Park</strong> (12.2 ha)Future Residential Expansion (12.5 ha)Commercial and Institutional (10.2 ha)Sunny Side Campground (24.7 ha)<strong>Cultus</strong> <strong>Lake</strong> <strong>Park</strong> Board Boundary<strong>Cultus</strong> <strong>Lake</strong><strong>Lake</strong> Side CondominiumsCULTUS LAKE PROVINCIAL PARKCULTUS LAKESANITARY SEWER ASSESSMENTExisting <strong>Cultus</strong> <strong>Lake</strong>Collection and TreatmentFigure 2November, 2011
Fraser Valley Regional District<strong>Cultus</strong> <strong>Lake</strong> <strong>Sanitary</strong> <strong>Sewer</strong> <strong>Infrastructure</strong> <strong>Assessment</strong> – Final ReportTable 4: Land UseCategory/IdentificationArea (ha)Residential<strong>Cultus</strong> <strong>Lake</strong>, East side 12.8<strong>Cultus</strong> <strong>Lake</strong>, West side 3.3Mountain View/ <strong>Park</strong> Drive 9.5<strong>Cultus</strong> <strong>Lake</strong>side condominiums 1.3Future Expansion 12.5<strong>Cultus</strong> lake mobile home park 12.2Commercial and InstitutionalSunnyside campground (seasonal sites) 24.7Commercial and institutional (shopping plaza, gas station,restaurant, church, fire hall, water park, etc.)10.23.3 Design FlowsDaily design flows were developed based on the existing and future population and landuse. Two sources were used to determine the design flows for the developed treatmentand pumping options (refer to Appendix A). These sources are:• City of Chilliwack “Subdivision and Land Development Bylaw 2004, No. 3055”• <strong>Sewer</strong>age System Standard Practice Manual” (SPM) ? (BC Ministry of Health2007)The design flows were developed based on the following criteria:• Ultimate population: 1622 capita• Residential and commercial area: 86.5 ha• Domestic flow rate: 410 l/c/d• Infiltration: 0.1 l/s/ha• Peaking factor: 3Table 5 provides the Design Flows that were be used for developing the describedTreatment and Pumping Options. For detailed flow calculations, refer to Appendix B.Table 5: Design Flows for the Treatment and Pumping OptionsDescriptionUnitTreatmentOptionsPumpingOptionAverage Dry Weather Flow (ADWF) m 3 /day 946 946Maximum Day Design Flow (MDD) m 3 /day 1893 ?Average Wet Weather Flow (AWWF) m 3 /day 1694 ?Peak Wet Weather Flow (PWWF) L/s 42 42Project No. 30825 – September, 2012 Page 7
Fraser Valley Regional District<strong>Cultus</strong> <strong>Lake</strong> <strong>Sanitary</strong> <strong>Sewer</strong> <strong>Infrastructure</strong> <strong>Assessment</strong> – Final Report3.4 Effluent LimitsExisting sewage system disposes its effluent to the subsurface ground through septictanks and disposal fields. Treatment and disposal of sewage into ground (more than,22.70 m3/day) is regulated by B.C. Ministry of Environment.The B.C. legalization which regulates sewage treatment and disposal for <strong>Cultus</strong> <strong>Lake</strong> isthe Environmental Management Act, Municipal Sewage Regulation (MSR). Theregulation identifies four treated effluent classes that can allowed to be discharged intoground. Table 6 summarizes the effluent quality for each effluent class.EffluentClassTable 6: Effluents Limits 3 Discharge to Ground) (MSR Regulation – Schedule 123 Table 1)Effluent Quality Parameters (maximum values)DescriptionBOD5(mg/L)TSS(mg/L)Fecal Coliform(#/100ml)Turbidity(NTU)Nitrogen(mg/L)A High quality secondary(drinking water wellwithin 300 m)10 10 median ? 2.2any sample ? 14average ? 2anysample ? 5B High quality secondary 10 10 400 N/A N/ANitrate?N ?10Total N ? 20C Secondary 45 45 N/A N/A N/AD Typical septic tank N/A N/A N/A N/A N/ATable notes:N/A: not applicableFor discharge into ground, the regulation requires the treated effluent to meet abovelimits and an environmental impact assessment to be conducted prior to construction ofthe treatment works. The environmental impact assessment can request a more stringenteffluent limits than the limits identified in Table 6.The existing septic tanks and disposal system follows effluent Class D. Class A, B and Crequires higher treatment than the existing treatment. The regulation requires thedischargers to ensure the following requirements:• The subsurface travel time before effluent reaches the property boundary, isintercepted by a water well or surfaces is not less than 6 days for effluent class Aor B and 10 days for effluent Class C or D• The effluent does not surface nor cause the groundwater table to be raised withina distance of 30.0 m beyond the disposal site perimeter• The discharge does not impact property owners, residents and usersCurrently, two <strong>Cultus</strong> <strong>Lake</strong> Water <strong>Park</strong> groundwater wells are located within a separationdistance less than 300 m gradient from the disposal field. These wells can becontainment with the effluent from the disposal field. ISL believes that the proximity ofthese wells to the disposal fields represents a health risk to the park patrons, and anyground water monitoring program that can be implemented will not conclude for certainthat the health risks are eliminated especially at future sanitary flow rates or atemergency situations when the chlorination system at the water park fails for any reason.Treating the sewage to high quality secondary effluent will eliminate the need forrelocating the water park wells.Project No. 30825 – September, 2012 Page 8
Fraser Valley Regional District<strong>Cultus</strong> <strong>Lake</strong> <strong>Sanitary</strong> <strong>Sewer</strong> <strong>Infrastructure</strong> <strong>Assessment</strong> – Final Report3.5 Influent ParametersThe quality of the influent sewage parameters (BOD5, TSS…etc.) is not monitored and itis not required by to be monitored by the MoE Permit. Typical domestic sewageparameters were used to develop the conceptual design for each treatment Option.Table 7 provides the influent parameters and effluent limits that were used for eachtreatment Option.Table 7: Influent Parameters and Effluent LimitsInfluent ParametersEffluent LimitsDescriptionLoading Concentration Effluent EffluentClass C Class A(g/capita. d) (mg/L) Option (2) Option (3)BOD 5 85 207 45 10TSS 95 232 45 10Ammonia NH3 as N 7.8 19 N/A N/AOrganic Nitrogen as N 5.5 13 N/A N/ATN 13.3 32 N/A 20Nitrates NO3 as N N/A N/A N/A 10Organic P as P 1.23 3 N/A N/AInorganic P as P 2.05 5 N/A N/ATotal Phosphorous as P 3.28 8 N/ATurbidity (average) N/A N/A N/A 2 NTUTurbidity (maximum) N/A N/A N/A 5 NTUTemperature (minimum) 12 o C N/A N/A N/ATemperature (maximum) 25 o C N/A N/A N/ATable Notes:N/A: not applicableInfluent loading parameters are typical values for raw wastewater constitutes, (M&E, 2003)Concentrations are based on 410 L/c/d3.6 MSR Design StandardsMSR requires pumping and treatment facilities to be designed according to certainreliability categories. The following define each category:• Category I which includes treatment plants that discharges to water or land thatcould be permanently or unacceptably damaged by effluent that is degrade inquality for even a few hours such as discharges near drinking water source• Category II which includes treatment plants that would not be permanently orunacceptably damaged by short term effluent degradation, but would bedamaged by continued (several days) effluent quality degradation such asdischarges to recreational land and waters• Category III which includes treatment works not designated as Category I or IIIf FVRD want to pursue any of the treatment options, an Environmental Impact<strong>Assessment</strong> (EIA) should be conducted. The EIA requirements are identified in MSRregulation, April 2012, Division 3, included in Appendix A. As part of the assessment,MSR require the reliability category to be identified based on the study results. For thetreatment units that were used for Option 2 and Option 3, Category I and Category II hasthe same requirements for equipment redundancy. The conceptual design was carriedbased on providing redundant equipment according to either category I or II. In addition,MSR requires the effluent from the treatment plants to be filtered prior to discharge toprevent solids carrying over into the disposal fields.Project No. 30825 – September, 2012 Page 9
Fraser Valley Regional District<strong>Cultus</strong> <strong>Lake</strong> <strong>Sanitary</strong> <strong>Sewer</strong> <strong>Infrastructure</strong> <strong>Assessment</strong> – Final Report4.0 Treatment Options4.1 Option 1 – Effluent Class DOption 1 includes expanding the existing system to accommodate the design flow rateusing the same treatment scheme (i.e. septic tanks and disposal fields). This Optionprovides only primary treatment (Class D effluent). Currently, the existing treatmentsystem (septic tanks and disposal fields) is regulated by the MoE via Permit #05526. ThePermit was originally issued on August, 1979 and amended on February 2011. ThePermit states that “the existing treatment may be required to be upgraded to secondarytreatment or better for any future flow increases”. The calculated maximum daily designflows (1893 m3/day) for the existing <strong>Cultus</strong> lake area and the anticipated futureexpansion is considerably above the authorized capacities of the East and West disposalfields (360 m3/day and 90 m3/day respectively). Providing secondary treatment or higheris required.Based on the requirement for secondary treatment, Option (1) was not carried forward forfurther evaluation and cost estimating.4.2 Option 2 and 3 – Effluent Class C and AConceptual design and preliminary sizing was carried out to determine the probable costsassociated with treating the wastewater to the required effluent limits. Several wastewatertreatment equipment and processes were considered for <strong>Cultus</strong> <strong>Lake</strong>. The evaluatedequipment and processes were as follows:• Preliminary Treatmento Sewage grindingo Fine screeningo Equalization• Secondary Treatmento Sequencing Batch Reactor (SBR)o Rotating Biological Reactor (RBC)o Membrane Biological Reactor (MBR)o Moving Bed Biofilm Reactor (MBBR)• Disinfectiono UV disinfectiono Chlorination• Sludge Treatmento Belt filter presso CentrifugesProject No. 30825 – September, 2012 Page 10
Fraser Valley Regional District<strong>Cultus</strong> <strong>Lake</strong> <strong>Sanitary</strong> <strong>Sewer</strong> <strong>Infrastructure</strong> <strong>Assessment</strong> – Final Report4.3 Preliminary TreatmentPrior to introducing raw sewage to the wastewater treatment plant, the raw sewage hasto be screened to protect pumps, valves, pipelines, and other equipment from damage orclogging by rags and large objects. In <strong>Cultus</strong> <strong>Lake</strong>, the raw sewage is pumped from SL 1to an existing distribution chamber which distributes the flow equally to four septic tanks.It is proposed to intercept the raw sewage prior to existing septic tanks and route the rawsewage to the treatment plant where it can be screened. Flow from others future areasand the west field can be routed directly to the treatment plant using pump stations. Referto Appendix C, Drawings which shows the process flow diagrams and preliminary layoutfor Option 2 and 3 respectively4.3.1 Grinding and ScreeningThe sewage will be pumped by the influent pumps to the fine screens through thegrinders. The grinders will shred the large objects and rags, and the fine screen removesthe shredded screenings from influent water. The fine screen is provided with a press thatcompacts, and dewaters the captured screenings for final disposal.The conceptual design was carried based on providing, two influent pumps(duty/standby), two grinders (duty/standby) and two fine screens (duty/standby) completewith the associated pipes, valves and flowmeters.4.3.2 EqualizationThe peak wet weather flow to the plant is 42 L/s, and the maximum day design flow is1893 m3/day (22 L/s). An equalization tank should be provided to store the excesswastewater during wet weather flow events and to minimize the hydraulic shock loads onthe treatment plant. MSR require treatment plants to be designed based on two trains asa minimum, with the remaining capacity of each train must be at least 75% of the designmaximum flow. The downstream trains will have capacity of 150% of the designmaximum flow (i.e. 22 L/s x 1.5 = 33 L/s) which is less than the peak wet weather flow(42 L/s). Equalization will be required to store excess wastewater above the designmaximum flow.Currently, the East field has four septic tanks with a total capacity of 368 m 3 . These tankscan be converted and utilized as an equalization tank. The capacity of the tanks willprovide approximately 11.3 hrs. of retention time based on a peak wet weather flow andmaximum downstream treatment capacity of 42 L/s and 33 L/s respectively.The flow from the fine screens will be discharged by gravity to the equalization tanks andthree equalization tank pumps (2 duty/1 standby) will pump the screened wastewater tothe secondary treatment.4.3.3 Preliminary Treatment SizingTable 8 summarizes the preliminary treatment equipment Sizing.Project No. 30825 – September, 2012 Page 11
Fraser Valley Regional District<strong>Cultus</strong> <strong>Lake</strong> <strong>Sanitary</strong> <strong>Sewer</strong> <strong>Infrastructure</strong> <strong>Assessment</strong> – Final ReportTable 8: Preliminary Equipment Summary and CapacitiesDescription Option 2 Option 3Peak wet weather flow (L/s) 42 42Influent pumpsNumber of pumps 2 (1 duty/ 1 standby) 2 (1 duty/ 1 standby)Capacity of each pump (L/s) 42 42GrindersNumber of grinders 2 (1 duty/ 1 standby) 2 (1 duty/ 1 standby)Capacity of each Grinder (L/s) 42 42Fine screensNumber of screens 2 (1 duty/ 1 standby) 2 (1 duty/ 1 standby)Capacity of each screen (L/s) 42 42Dry solids concentration 25% ? 30% 25% ? 30%Equalization tankNumber of tanks 4 (existing septic tanks) 4 (existing septic tanks)Total tanks capacity (m3) 368 368Retention time (hr.) 11.3 11.3Equalization tank pumpsNumber of screens 2 (1 duty/ 1 standby) 2 (1 duty/ 1 standby)Capacity of each pump (L/s) 16.5 16.54.4 Secondary TreatmentMany secondary treatment process and technologies can be provided to achieve therequired effluent limits. The four processes selected for comparison include aSequencing Batch Reactor (SBR), Rotating Biological Contactor (RBC), Membrane Bio?Reactor (MBR) and Moving Bed Biological Reactor (MBBR). All four processes canprovide Class C effluent and can be configured to achieve nutrient removal (Class Aeffluent). Each process is described in the following sections with particular reference to<strong>Cultus</strong> <strong>Lake</strong>.4.4.1 Sequencing Batch Reactor (SBR)SBR is the modification of conventional activated sludge process. Figure 3 showsschematic drawing for conventional activated sludge.Project No. 30825 – September, 2012 Page 12
Fraser Valley Regional District<strong>Cultus</strong> <strong>Lake</strong> <strong>Sanitary</strong> <strong>Sewer</strong> <strong>Infrastructure</strong> <strong>Assessment</strong> – Final ReportFigure 3: Activated Sludge Process SchematicConventional activated sludge is an aerobic biological process for treatment of domesticwastewater. The process utilizes microorganisms to feed on available organic matters inthe wastewater. The microorganisms responsible for treatment are maintained insuspension at a certain concentration. The microorganisms use the available organicmatters as food source to maintain its life sustaining process such as energyreproduction, growth…etc. In conventional activated sludge method, the wastewater isintroduced to an aeration tank where air is provided as an oxygen source to keep themicroorganisms alive and in suspension. After, the aeration tank, the liquid flows bygravity to a secondary clarifier tank where the microbial suspension is settled to thebottom. The settled biomass is returned back to the aeration tank (return sludge) tocontinue degradation of organic matters in the tank. A portion of the biomass (wastesludge) has to be removed periodically as the process produces excess biomass. Controlof the process is achieved by maintain certain biomass concentration in the aeration tank.Project No. 30825 – September, 2012 Page 13
Fraser Valley Regional District<strong>Cultus</strong> <strong>Lake</strong> <strong>Sanitary</strong> <strong>Sewer</strong> <strong>Infrastructure</strong> <strong>Assessment</strong> – Final ReportFigure 4: Sequential Batch Reactor (SBR) SchematicIn SBR process, wastewater is processed biologically and physically in one tank. Unlikeconventional activated sludge where flow moves continuously from aeration tank tosecondary clarifier, the process operates on a time?based batch system. Processinginvolves sequential stages; fill, aeration, sedimentation, and decanting (discharge ofclarified effluent) stages. Once the wastewater in the tank completes the first threestages, the tank is decanted to another treatment process (such as disinfection) ordirectly to the receiving stream. For optimal performance, the process should be providedwith a minimum of two tanks, so that one tank receives the flow while the other completesits treatment stages. The process can be configured for nitrogen removal by controllingthe time associated with each stage. Sludge wasting usually occurs during the reactstage and there is no need for sludge return because aeration and settling occurs in thesame tank.For SBR, decanting is achieved in a very short time, which means a very high effluentflow to the receiving stream. In <strong>Cultus</strong> lake, the disposal field will be the receiving streamand sizing of the disposal field pipes to accommodate for the decanted effluent is noteconomically feasible, alternatively a balancing tank must be provided downstream of thetreatment process. Figure 4 shows a schematic drawing for the SBR process.Project No. 30825 – September, 2012 Page 14
Fraser Valley Regional District<strong>Cultus</strong> <strong>Lake</strong> <strong>Sanitary</strong> <strong>Sewer</strong> <strong>Infrastructure</strong> <strong>Assessment</strong> – Final Report4.4.2 Rotating Biological Reactor (RBC)The RBC process is a fixed film bioreactor in that the bacteria are attached to the partiallysubmerged disks of the reactor. Rotation of the disks allows the bacteria to alternatelytravel through the air for oxygen and through the wastewater for nutrients. The bacteriadegrade the organic nutrients and, depending on the design, the process can beconfigured for nitrification (transform ammonia to nitrogen gas). Wastewater continuouslyenters underneath at one end of the RBC, travels across the RBC tank undergoingtreatment, and then continuously flows out of the RBC into a secondary clarifier tank.Small amounts of the biofilm slough off the disks and settle to the bottom of the reactorfor later removal. The secondary clarifier tank is used to allow further settling ofsuspended solids and stray bacteria. Supplementary air is generally required forinstallations that require nitrification. Performance of RBC is greatly affected withupstream treatment (reduction of BOD and TSS). The wastewater temperature,especially in winter, adversely affects the sizing of RBC units for nitrification applications.The main advantages of an RBC process include low energy costs and simple operation.The main disadvantages include potential for shaft failure due to the load of biomass.Figure 5 shows a schematic drawing for the RBC process.Figure 5: Rotating Biological Reactor (RBC) Schematic4.4.3 Membrane Biological Reactor (MBR)The MBR process involves a bioreactor and a membrane system. The bioreactor refersto a tank in which the bacterial population degrades the organic nutrients. Themicrofiltration process filters the water from the bioreactor (by vacuum filtration), leavingthe bacteria and the suspended solids behind. The microfiltration membrane is made ofa polymer with sufficiently small sized pores such that bacteria and suspended solids aregenerally unable to cross the membrane. The bioreactor membranes are continuouslyaerated for biological treatment, and the submerged membranes are also aerated toscour the surface area of the membranes to limit membrane fouling. The membrane isalso cleaned regularly with a weak acid to control fouling. The main advantage ofmembrane systems is excellent effluent quality, as the membrane system acts asfiltration system that prevent carry over solids to the receiving stream. Wastewatertemperature greatly affect membrane system sizing and should be taken intoconsideration. The main disadvantage of the process is the use of chemicals to controlfouling, redundancy is required to operate one membrane module while the othermembrane module is being cleaned.Project No. 30825 – September, 2012 Page 15
Fraser Valley Regional District<strong>Cultus</strong> <strong>Lake</strong> <strong>Sanitary</strong> <strong>Sewer</strong> <strong>Infrastructure</strong> <strong>Assessment</strong> – Final ReportThe main advantage of the MBR system is that the process can consistently provide higheffluent quality and it is more compact compared with other biological treatment. Theprocess does not need more filtration equipment prior to dispose of the effluent to thedisposal fields. The SBR and RBC process requires a filtration system to eliminate anycarry over solids to the disposal fields. Figure 6 shows a schematic drawing for the MBRprocess.Figure 6: Membrane Biological Reactor (MBR) Schematic4.4.4 Moving Bed Biofilm Reactor (MBBR)The MBBR is a submerged attached growth process. The process enhances theactivated sludge process by providing synthetic packing media in the aeration tank whichincreases the biomass concentration in the aeration tank; as a result the aerobic tanksize can be reduced. The process is normally a single pass process with no returnactivated sludge. The process can use disc filter after secondary clarifier or a dissolvedair flotation (DAF), for filtration. Using DAF requires chemical treatment to assist thefiltration process. The process is easy to operate and require less capital cost. Figure 7shows a schematic drawing for the MBBR process.Project No. 30825 – September, 2012 Page 16
Fraser Valley Regional District<strong>Cultus</strong> <strong>Lake</strong> <strong>Sanitary</strong> <strong>Sewer</strong> <strong>Infrastructure</strong> <strong>Assessment</strong> – Final ReportFigure 7: Moving Bed Biofilm Reactor (MBBR) Schematic4.4.5 Evaluation of Secondary Treatment ProcessesTable 9 summarizes the advantages and disadvantages of the secondary treatmentprocesses discussed in previous sections.Table 9: Secondary Treatment – Advantages and DisadvantagesAlternative Advantages DisadvantagesSequencing BatchReactors (SBRs)Rotating BiologicalContactors (RBCs)• Eliminates need for secondaryclarifiers and sludge returnpumping facilities;• Large flow variations can betreated• Low operational attention• Simple operation;• Eliminates need for sludge return;• Readily covered;• Lower power requirements.• Proven technology• Easy to operate• Covered units eliminate odorous• Complex control technology• Scum removal can be difficult;• Reliability of the decant mechanismhas been a concern in the past• Intermittent operation requires largeraeration systems, and a higherelectrical peak demand charge.• Maintenance more complex thanother biological processes• Downstream filteration or finescreening is required to prevent solidscarry over to disposal fields• Effluent equalization required fordownstream processes• May have difficulty in consistentlymeeting effluent ammonia limits;• Poorer cold weather performancethan other options;• Must be conservatively designed dueto concerns with shaft failures andtemperature effects on performance• High capital cost.Project No. 30825 – September, 2012 Page 17
Fraser Valley Regional District<strong>Cultus</strong> <strong>Lake</strong> <strong>Sanitary</strong> <strong>Sewer</strong> <strong>Infrastructure</strong> <strong>Assessment</strong> – Final ReportAlternative Advantages Disadvantagesemissions• "Sloughed" biomass may settle poorly• Can produce a nitrified effluent.MembraneBiological Reactor(MBR)Moving BedBiological Reactor(MBBR)• Small footprint;• Eliminates need for secondaryclarifiers or filters• Achieves highest quality effluentand highest biological processreliability.• Low capital cost• Small footprint• High capital cost;• High O&M costs;• Membranes has a limited design life(10 years).• Membrane chemical treatment isrequired• High O&M cost• Chemical is required to aid theclarification process• The process has small retention timewhich make it suspectable to shockloadsEvaluation of the treatment options were carried out based MBBR process for Class Ceffluent and MBR process for Class A effluent. Although, the MBBR process can achieveClass C effluent limits and can be configured to achieve Class A as well.However, for Class A effluent, MBR process is more robust compared with MBBR andwill provide the required high effluent quality (Class A) on a consistent basis.The rational for selecting the processes was as follows:• Compact treatment• The technology is capable of meeting effluent limits easily on a consistent basis• The technology have proven experience and well supported in North America4.4.6 Secondary Treatment SizingPreliminary sizing for the biological treatment was carried out based on MBBR processfor Class C effluent and MBR for Class A effluent. Table 10 provides the preliminarysizing of the secondary treatment.Project No. 30825 – September, 2012 Page 18
Fraser Valley Regional District<strong>Cultus</strong> <strong>Lake</strong> <strong>Sanitary</strong> <strong>Sewer</strong> <strong>Infrastructure</strong> <strong>Assessment</strong> – Final ReportTable 10: Secondary Treatment Preliminary SizingDescription Units Option 2 Option 3Maximum Daily Design Flow (MDD) m3/day 1,893 1,893Average Dry Weather Flow m3/day 946 946Process MBBR MBRNumber of trains 2 2Train capacity m3/day 1,420 1,420Anoxic zone volume (each) m3 ? 100Anoxic zone retention timebased on annual average daily flow hr. ? 5.1based maximum day design flow hr. ? 2.5Aerobic tank volume m3 300 400Fill media m3 180 ?Aerobic tank retention timebased on annual average daily flow hr. 15.2 20.3based maximum day design flow hr. 7.6 10.1Total number of DAF units 2Total number of disc filters 2Total number of membrane modules 4Number of membrane modules per train 2Sludge concentration % 0.8?1.04.5 DisinfectionFor effluent Class A (Option 3), the effluent limits for fecal coliform is 2.2 #/100 ml(median) and 14.0 #/100 ml (any sample). For effluent Class C (Option 2), there is nolimit for fecal coliform; disinfection is not required for this option.Disinfection can be achieved using chlorine or UV disinfection.4.5.1 Ultraviolet DisinfectionUltraviolet light irradiation is an effective disinfectant. Since ultraviolet irradiation is aphysical process rather than chemical disinfection method, no toxic residuals areproduced. The major advantages of UV disinfection are its simplicity of operation, andshort contact times.The disinfection efficiency of UV irradiation depends on the degree of penetration of lightinto the micro?organisms. Suspended solids in the effluent reduce the effectiveness ofthis technology by shielding micro?organisms from the UV light. For this reason, UVirradiation is well suited to tertiary treatment plants that have effluent filters to reducesuspended solids. The major operating costs associated with this process are for powerconsumption and replacement of ultraviolet lamps. Figure 8 shows wastewater UVreactor.Project No. 30825 – September, 2012 Page 19
Fraser Valley Regional District<strong>Cultus</strong> <strong>Lake</strong> <strong>Sanitary</strong> <strong>Sewer</strong> <strong>Infrastructure</strong> <strong>Assessment</strong> – Final ReportFigure 8: Wastewater UV Reactor4.5.2 Chlorine DisinfectionChlorination is historically the most common method for the destruction of pathogenicorganisms in treated sewage. Its advantages include reliable equipment, simple andflexible operation, well?developed process control, and effective disinfection. Chlorine gasor sodium hypochlorite can be used for disinfection. The use of sodium hypochlorite issafer compared with chlorine gas. For both chlorine forms, a relatively long contact time,compared with UV, is required to ensure adequate disinfection, and as such, contactchambers are typically much larger with chlorination compared to UV disinfection4.5.3 Evaluation of Disinfection ProcessesTable 11 summarizes the advantages and disadvantages of each disinfection method.Table 11: Disinfection Options – Advantages and DisadvantagesProcess Option Advantages DisadvantagesChlorine disinfection • Proven technology;• Low O&M requirements;• Low to Moderate energy use.• Requires large footprint;• Produces chlorinated organiccompounds;• Requires complexinstrumentation for control.UV disinfection • Very small footprint;• Proven technology;• Capital costs would be similarto chlorination;• No chemicals added to effluent;• Lamp cleaning can be excessivewhere wastewater has high Feand Ca;• Pathogen shielding problems ifeffluent TSS is high.• Moderate to high energy use.In recent years; most municipalities depart from chlorine and uses UV disinfection forwastewater effluents. The process is more safe to operate and can achieve the requiredfecal coliform limits. UV disinfection were is recommended for Option 3,Project No. 30825 – September, 2012 Page 20
Fraser Valley Regional District<strong>Cultus</strong> <strong>Lake</strong> <strong>Sanitary</strong> <strong>Sewer</strong> <strong>Infrastructure</strong> <strong>Assessment</strong> – Final Report4.5.4 UV SizingTable 12 provides a preliminary sizing for the UV reactorsTable 12: Preliminary sizing of UV reactorsDescription Units Option 3Maximum peak flow L/s 33Total number of reactors 3Number of duty reactors2 duty / 1 standbyCapacity of each reactor L/s 16.54.6 Sludge TreatmentFor all treatment of processes, sludge will be produced and portion of the sludge (wasteactivated sludge) has to be further processed to reduce its volume before transporting itto disposal sites. Achieving a more concentrated sludge, prior to disposal, lowers thehauling and transportation costs from the treatment plant to the disposal site, and lowersthe number of sludge trucks that has to go through the community. Increasing the sludgeconcentration from 1% to 15% reduces the hauling and transportation cost to 1/15 of thecost. .The sludge concentration from the biological process is in the range of 0.5% – 1.0 %.Normally, mechanical dewatering units such as belt press or centrifuge require the feedsludge to be concentrated to 2% to 4%. A sludge thickening process is needed to thickenthe sludge to these concentrations (2 %?4 %). Using either belt press or centrifuge canachieve a minimum sludge concentration of 15%.Table 13 provides description, advantages and disadvantages of each processTable 13: Belt Press and Centrifuge – Advantages and DisadvantagesProcess Description Advantages DisadvantagesBelt FilterPressBiosolids pressedbetween two porousmoving belts.• Relatively low capitalcost,• Relatively low powerconsumption,• High solids capture withminimum polymer• Continuous feed,• Moderate cake solidsconcentration,• Moderate throughoutcapabilities versusspace requirement• Open design providesgood visual controlcapability for processperformance• Can be provided with anintegrated sludgethickening unit• Housekeeping –open design does notallow containmentduring processupsets• Moderate operatorattentionrequirements;• Odour potential,• Sensitive to incomingfeed characteristicsProject No. 30825 – September, 2012 Page 21
Fraser Valley Regional District<strong>Cultus</strong> <strong>Lake</strong> <strong>Sanitary</strong> <strong>Sewer</strong> <strong>Infrastructure</strong> <strong>Assessment</strong> – Final ReportProcess Description Advantages DisadvantagesCentrifugeCentrifugal force usedto separate moisturefrom biosolids.• Contained processminimizes housekeepingand odourconsiderations• Continuous operationprovides flexible controlcapability for processperformance;• Moderate to high cakesolids concentration;• Relatively small arearequirements;• Moderate to highthroughput capabilitiesversus spacerequirements;• Low operator attentionrequirements;• High solids capture.• Relatively high capitalcost;• Relatively high powerrequirements;• Moderate to highpolymerrequirements;• High operatingspeeds;• High noise potential• Require thickeningprocess and nointegrated thickeningunit are available forcentrifugesConsidering the small size of the treatment plant, a compact dewatering unit withintegrated thickening unit can be provided. Belt filter press with an integrated thickeningunit is recommended for its compact size and low capital cost. The integrated unit canprovide a sludge concentration in the range of 15% to 18%. Thickening/dewatering unitsrequire injecting polymers in the feed stream to aid the process and the belt filter presswill require a backwashing system to clean the belt when required.Table 14 provides the preliminary sizing for belt filter pressTable 14: Belt Filter Press SizingDescription Units Option 2& 3BOD load per day Kg/day 196Estimated bio?solids generated per day (dry127.4Kg/daybasis)Estimated sludge concentration % 0.8Estimated feed sludge quantity (wet basis@111.0m3/weekconcentration)Number of belt filter press 1Number of integrated thickening unit 1Estimated sludge generated per week (dry891kg/weekbasis)Estimated sludge cake per week (@ 15%6m3/weekconcentration)Table Notes:BOD load is based on the average dry weather flow at the ultimate design year (946.0m 3 /day)Estimated bio?solids generated per day is based on observed yield of 0.65 kg TSSgenerated/BOD removalProject No. 30825 – September, 2012 Page 22
Fraser Valley Regional District<strong>Cultus</strong> <strong>Lake</strong> <strong>Sanitary</strong> <strong>Sewer</strong> <strong>Infrastructure</strong> <strong>Assessment</strong> – Final Report4.7 Discharge to GroundFor all identified treatment options, discharge to the ground is required. The MSRregulation prescribes a certain minimum pipe length for disposal fields based on flow,effluent class, soil percolation rate, type of soil, and the use of effluent filtration andmonitoring. In March 2010, Levelton Consultants Ltd. Conducted a percolation test for theEast Field. Table 15 summarizes the percolation test results for the test holes.Table 15: Levelton Consultant Percolation Test – East FieldPercolationRateTest Hole #Minutes/25mmPH10?01 5.65PH10?02 2.15PH10?03 1.43PH10?04 0.88PH10?05 1.62PH10?06 5.0Average Percolation Rate 2.79Preliminary sizing for the required disposal pipe length for each treatment option werecarried based on an average percolation rate of 2.79 minutes/25 mm. Table 16 providesthe required drainage pipe for each Option.Table 16: Drainage Pipe Lengths for each optionOption 2 Option 3DescriptionClass C Class AMaximum Day Design Flow (m3/day) 1893 1893Percolation rate (minutes/25 mm) 2.79 2.79Number of meters of drainage pipe for each 10 m 3 /d of56.5 56.5maximum daily flowRequired number of meters based on maximum daily flow 10,695 10,695Required number of meters based on maximum daily flow 10,695 6,417and the maximum percentage reductionNumber of Disposal Fields (duty/standby)(2/1) (2/1)Total number of drainage pipes based on 2 duty/1 standby) 16,043 9,626Existing drainage pipes available ?East Field (m) 9,544 9,544Drainage pipes deficit (m)6,499 82Table notes:For effluent Class A, continuous monitoring is required.For Class A, and C, the regulation requires filtration of the effluent prior to discharge to thedisposal field to prevent solids carrying over into the disposal field.For effluent Class A, 40% reduction of disposal field length as per MSR, Schedule 4, Table3 is appliedNumber of meters of drainage pipe is based on the percolation rates in MSR Schedule 4Table 4Project No. 30825 – September, 2012 Page 23
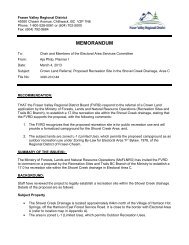
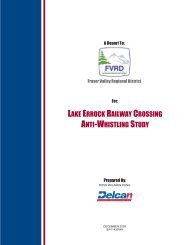
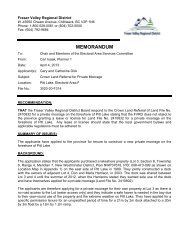
Fraser Valley Regional District<strong>Cultus</strong> <strong>Lake</strong> <strong>Sanitary</strong> <strong>Sewer</strong> <strong>Infrastructure</strong> <strong>Assessment</strong> – Final Report5.0 Pumping Option (Option 4)Option 4 requires abandonment of existing disposal fields and pumping the sewage tothe City of Chilliwack’s sewer system for treatment. In this option, a new pump station willbe constructed at the location of SL3, Flow from other future areas and the west fieldcan be routed directly to the new lift station using gravity mains or pump stations.The conceptual design was carried based on providing, two pumps (1 duty/ 1 standby)complete with their associated pipes and flowmeter. The sewage will be pumped to thenearest Chilliwack gravity manhole which is located along Vedder Mountain Road. Thetotal length of the alignment is approximately 3.2 km.The alignment will have a high ground elevation point at an approximate distance of 2.55km from the lift station. The conceptual design was carried based on pumping thesewage up to the high point and provide a gravity sewer pipe (with manholes) from thehigh point to the Chilliwack gravity manhole. Providing forcemain/gravity pipe from the liftstation to the nearest Chilliwack gravity manhole, in lieu of constructing only a forcemainfrom the lift station to the gravity manhole, will avoid developing negative pressure in theforcemain.ISL contacted the Ministry of Transportation (MoT) and they indicated the possibility ofthe actual placement of the sanitary forcemain outside the road prism (i.e. on the backside of the ditch lines).Figure 9 provides the conceptual alignment of the forcemain/gravity pipe. Figure 10provides the hydraulic gradient of the lift station. Table 17 provides the preliminary sizingof the pump station.Table 17: Preliminary sizing of pump stationDescription Units Option 4Peak wet weather flow L/s 42Number of pumps1 duty / 1 standbyCapacity of each pump L/s 42Pump head m 75Pump (hp) 105Forcemain material/sizePVC/250 mmTable notesPump head and horsepower need to be confirmed during detail designFRVD and ISL contacted the City of Chilliwack to determine the associated constructioncosts related to the pumping option. The City of Chilliwack indicated that upgrades arerequired to accommodate the flow from <strong>Cultus</strong> <strong>Lake</strong> which includes replacing the sewerpipes from the connection point on Vedder Mountain Road up to Watson Road. Theestimated cost for the upgrade is $1.5 million, and an additional $2.035 million forDevelopment Cost Charge (DCC) based on the anticipated population for <strong>Cultus</strong> <strong>Lake</strong>Project No. 30825 – September, 2012 Page 24
Debby Whitfield / Mar. 6, 12 / T:\Projects\30000\30825 <strong>Cultus</strong> <strong>Sanitary</strong> <strong>Sewer</strong> <strong>Infrastructure</strong> <strong>Assessment</strong>\Client Data\Drawings\Figure 10.dwgCULTUS LAKESANITARY SEWER ASSESSMENTForce Main Hydraulic Gradient - 42 L/SFigure 10March, 2012
PLEGENDPump StationForce MainDebby Whitfield / Mar. 6, 12 / T:\Projects\30000\30825 <strong>Cultus</strong> <strong>Sanitary</strong> <strong>Sewer</strong> <strong>Infrastructure</strong> <strong>Assessment</strong>\Client Data\Drawings\Figure 9.dwgCULTUS LAKESANITARY SEWER ASSESSMENTConceptual - Force Main / Gravity Pipe AlignmentFigure 9March, 2012
Fraser Valley Regional District<strong>Cultus</strong> <strong>Lake</strong> <strong>Sanitary</strong> <strong>Sewer</strong> <strong>Infrastructure</strong> <strong>Assessment</strong> – Final Report6.0 Treatment and Pumping Options EvaluationThe advantage and disadvantage of each Option considered are summarized in Table18.Table 18: Treatment and Pumping Options – Advantages and DisadvantageDescription Advantages DisadvantagesOption 2 – Treatment toClass C effluentOption 3 – Treatment toClass A effluent• Moderate capital cost• Higher effluent qualitycompared with Option2• Upgrading of disposalfields is minimal• Relocating of waterpark’s wells is notrequired• Reduce nutrients(ammonia andphosphorus) loads on<strong>Cultus</strong> <strong>Lake</strong>• High operating cost• Require chemical handling• Require Permanenttreatment operation andmaintenance staff• Require expansion ofdisposal fields• Changes in theenvironmental regulationmay trigger expensiveupgrades• Relocating of water park’swells is required• Future equipmentreplacement cost is high.• Sludge transportation withinthe community streets isrequired• Odour control is moredifficult compared withOption 4• Less effluent qualitycompared with option 3• Changes in theenvironmental regulationmay trigger expensiveupgrades• High capital cost• High operating cost• Require chemical handling• Require Permanenttreatment operation andmaintenance staff• Future equipmentreplacement cost is high.• Sludge transportation withinthe community streets isrequiredProject No. 30825 – September, 2012 Page 25
Fraser Valley Regional District<strong>Cultus</strong> <strong>Lake</strong> <strong>Sanitary</strong> <strong>Sewer</strong> <strong>Infrastructure</strong> <strong>Assessment</strong> – Final ReportOption 4 – Pumping tothe City of Chilliwack• Lowest capital cost• Lowest operating cost• No chemical handling• Odour control is easier• Low futurereplacement costs• No permanent O&Mstaff is required• Relocating of waterpark’s wells is notrequired• Sludge transportationis not required• Reduce nutrients(ammonia andphosphorus) loads on<strong>Cultus</strong> <strong>Lake</strong>• Odour control is moredifficult compared withOption 4• Membranes has a limitedshort life, approximately 10years• NoneBased on the advantages and disadvantages outlined above, Option 4, pumping to theCity of Chilliwack, represents the most effective option for <strong>Cultus</strong> <strong>Lake</strong>.Project No. 30825 – September, 2012 Page 26
Fraser Valley Regional District<strong>Cultus</strong> <strong>Lake</strong> <strong>Sanitary</strong> <strong>Sewer</strong> <strong>Infrastructure</strong> <strong>Assessment</strong> – Final Report7.0 Opinion of Probable CostsThe probable costs of the treatment and pumping options were developed based on theconceptual design discussed in previous sections. All the cost stated are in 2012Canadian Dollars. The discrepancy between the probable costs at the planning stage andthe costs that will occur is about +/? 25% (Taxes are excluded). Details of probable costsare included in Appendix D.Table 19 summarizes the probable cost for each option.Table 19: Opinion of Probable CostsDescription Option 2 Option 3 Option 4Construction Cost $7,368,000 $8,871,800 $2,012,000Engineering and constructioncontingencies (35%) $2,578,800 $3,105,130 $704,200City of Chilliwack upgrade cost $1,500,000City of Chilliwack (DCC Charges) $2,035,000Total cost $9,946,800 $11,976,930 $6,251,200Project No. 30825 – September, 2012 Page 27
Fraser Valley Regional District<strong>Cultus</strong> <strong>Lake</strong> <strong>Sanitary</strong> <strong>Sewer</strong> <strong>Infrastructure</strong> <strong>Assessment</strong> – Final Report8.0 Net Present Value AnalysisThe NPV analysis for options (2, 3, and 4) was completed based on the capital andoperating costs, The NPV analysis covers a 20 year period from 2012 to 2031. The year2012 is assumed to be the year for construction of all options while the year 2013 isassumed the starting year for post?construction operations. The NPV analysis was alsobased on an annual 2% inflation rate and an interest rate of 5.45%. The interest raterepresents the average interest rate for business loans over the last 20 years (1992 to2011).Table 20 summarizes the NPV analysis results. Details of NPV analysis are included inAppendix D.DescriptionTable 20: Net Present Value ResultsOption 2($)Option 3($)Option 4($)Capital costs 9,946,800 11,976,930 6,251,200Average yearly operating costs 462,887 563,499 55,916Average yearly sewer users rates $216,550.78Net present value 15,528,113 18,778,407 9,479,245Project No. 30825 – September, 2012 Page 28
Fraser Valley Regional District<strong>Cultus</strong> <strong>Lake</strong> <strong>Sanitary</strong> <strong>Sewer</strong> <strong>Infrastructure</strong> <strong>Assessment</strong> – Final Report9.0 Conclusion and Recommendation9.1 Conclusion• The existing disposal fields do not have the capacity to accommodate future flowrates• Implementing secondary wastewater treatment at <strong>Cultus</strong> <strong>Lake</strong> represents aconsiderable capital and operating costs.• Upgrading of the treatment plant in future represents a substantial cost comparedwith constructing a pumping station and sending the flow to the City of Chilliwackfor treatment.9.2 Recommendation• Pursue the pumping option as the ultimate option for <strong>Cultus</strong> <strong>Lake</strong>.• In the short term, if there are no available funds to construct the pump stationand the forcemain. Implement all recommendations identified in Dayton andKnight’s Report titled “<strong>Cultus</strong> lake <strong>Sewer</strong> <strong>Assessment</strong>” and all the work requiredby the Permit which includes: constructing monitoring wells for the east and westfields. The suggested location of the wells is identified in Appendix E. Thepriority of the construction work should be as follows:o Construct the required groundwater monitoring wells ($19,800)o Calibrate or replace existing flow meters ($30,000)o Repair of the distribution boxes and outlet tees ($20,000)o Replace existing corroded SL3 pumps ($ 45,000)• Limit any connection of additional sources of discharges to the disposal fieldsuntil all work prescribed in the Dayton and Knight Report is completed accordingto the MoE Permit 5526, issued 1979 and amended 2011.• Monitor the groundwater water monitoring wells as required by the Permit, untilconstructing the pump station and forcemain and decommissioning the existingdisposal system.Project No. 30825 – September, 2012 Page 29
Fraser Valley Regional District<strong>Cultus</strong> <strong>Lake</strong> <strong>Sanitary</strong> <strong>Sewer</strong> <strong>Infrastructure</strong> <strong>Assessment</strong> – Final ReportAppendix AProject No. 30825 – September, 2012
Fraser Valley Regional District<strong>Cultus</strong> <strong>Lake</strong> <strong>Sanitary</strong> <strong>Sewer</strong> <strong>Infrastructure</strong> <strong>Assessment</strong> – Final ReportAppendix BProject No. 30825 – September, 2012
B.1 Design FlowsThe design flows that were used for evaluating the treatment and pumping options are:• Average Dry Weather Flow (ADWF) which is equal to the sewage generation flow rate multipliedby the contributing population.• Average Wet Weather Flow (AWWF) which is equal the ADWF plus an inflow/infiltrationallowance.• Peak Dry Weather Flow (PDWF) which is equal to the sewage generation flow rate multiplied bya peaking factor.• Peak Wet Weather Flow (PWWF) which is equal to the PDWF plus an inflow/infiltration allowanceThe design flows were developed based on the City of Chilliwack’s “Subdivision and Land DevelopmentBylaw 2004, No. 3055” (refer to Appendix A).The following design criteria were used for estimating the design flows:• Sewage generation rate (Residential): 410 litres/capita/day• Sewage generation rates (commercial and institutional): varies according to use, Daily DesignFlows (DDF) are according to “<strong>Sewer</strong>age System Standard Practice Manual” (SPM) 6 (BCMinistry of Health 2007). The SPM provides daily design flows for various uses with peakingfactors (1.5 – 2) built into the daily design flows (DDF).• Inflow/infiltration allowance: 0.1 liter/second/hectare• Peaking factor: 3 for residential, commercial and institutional flowsTable B.1 provides the ADWF for the 2031 residential population.DescriptionTable B.1: ADWF (Residential)ADWFCapitaL/capita/dayADWF m3/dayUltimate Population 1622 410 665.1
Table B.2 provides the ADWF for commercial & Institutional; the ADWF is based on DDF/ADWF ratio of1.5.DescriptionTable B62 ADWF (Commercial & Institutional)Numberof UnitsDaily DesignFlow (DDF)L/Unit/DayDaily DesignFlow (DDF)m3/dayCommercial & InstitutionalMobile homes (<strong>Park</strong>view), (2 persons/home) 184 600 110.4Gas Station (per island) 2 2000 4.0Convenience Store 1 379 0.4Shopping Plaza (per shop) 9 379 3.4Restaurant Space (per seat) 100 90 9.0<strong>Park</strong> Office (per employee) 2 68 0.1Cabins (2 persons per cabin) 6 636 3.8Church (per seat) 50 9 0.5Fire Hall (per employee) 4 36 0.1Works Yard (per toilet room) 1 1513 1.5School (per student) 159 71 11.3<strong>Park</strong> Office (per employee) 4 36 0.1Community Hall (per seat) 50 19 1.0Water Slide <strong>Park</strong> (per visitor) 500 15 7.5Sunnyside (Campground)Seasonal Sites 348 365 127.0RV's Sites 104 365 38.0tent sites 134 180 24.1Group camping (two sites 6 50 persons each) 100 38 3.8Visitors 2000 38 76.0Total Daily Design Flow 422DDF/ADWF Ratio 1.5ADWF 281.4An allowance of 2000 visitors for the whole community is included to accommodate for visitors duringsummer weekends.
Table B.3 provides the design flows (ADWF, PDWF, and PWWF) based on the City of Chilliwack designcriteria.Table B.3 ADWF, PDWF, and PWWFDescription Unit ValueUltimate Population persons 1622Residential and commercial area ha 86.5Domestic flow rate l/c/d 410infiltration rate l/s/ha 0.1Peaking FactorAverage Dry Weather Flow 6 ADWFPeak Dry Weather Flow 6 PDWFInflow/infiltration (I/I)Residential 3.00commercial and institutional 3.00Residential m3/day 665.1l/s 7.7Commercial and institutional m3/day 281.4l/s 3.3ADWF (total) m3/day 946.5l/s 11.0Residential l/s 23Commercial and institutional l/s 10PDWF (total) l/s 33inflow/infiltration l/s 9Peak Wet Weather Flow (PWWF) l/s 42
Treatment Plant Options were developed and evaluated based on using ADWF, Maximum Day DesignFlow (MDD), AWWF, and PWWF. Pumping options were developed and evaluated based on the PWWF.Table B.4 provides the design flows for the treatment and pumping options.DescriptionTable B.4 Design Flows for the Treatment and Pumping OptionsUnitTreatmentOptionsPumpingOptionAverage Dry Weather Flow m3/day 946 946Maximum Day Design Flow m3/day 1893 6Average Wet Weather Flow (AWWF) m3/day 1694 6Peak Wet Weather Flow (PWWF) l/s 42 42Note: Maximum Day design Flow = 2 x ADWFIn order to investigate intermediate phasing of the pump station, FVRD requested the estimated flowrates along the operating years. Table B.4 provides the projected land use over the years. The estimationis based on connecting Mountain View/<strong>Park</strong> Drive, <strong>Lake</strong>side Condominiums, Mobile Home <strong>Park</strong>, andSunnyside Campground by 2016.Table B.5 Projected Land Use (2011 – 2031)NameArea (ha)2011 2016 2021 2026 203112.8 12.8 12.8 12.8 12.8<strong>Cultus</strong> lake East3.3 3.3 3.3 3.3 3.3<strong>Cultus</strong> <strong>Lake</strong> WestMountain View/<strong>Park</strong> Drive 0.0 9.5 9.5 9.5 9.5<strong>Lake</strong>side Condominiums 0.0 1.3 1.3 1.3 1.3Mobile Home <strong>Park</strong> 0.0 12.2 12.2 12.2 12.2Future ResidentialExpansion 0.0 2.6 5.5 8.8 12.5Commercial and Institutional 10.2 10.2 10.2 10.2 10.2Sunnyside Campground 0.0 24.7 24.7 24.7 24.7Total 26.3 76.6 79.5 82.8 86.5
Table B.6 provides the design flow rates according to the projected population and land useTable B.6 Design Flow Rates (2011 – 2031)Description Unit 2011 2016 2021 2026 2031Ultimate Population persons 990 1120 1267 1434 1622Residential and commercialarea ha 26.3 76.6 79.5 82.8 86.5Domestic flow rate l/c/d 410 410 410 410 410infiltration rate l/s/ha 0.1 0.1 0.1 0.1 0.1Peaking FactorResidential 3.00 3.00 3.00 3.00 3.00commercial and institutional 3.00 3.00 3.00 3.00 3.00Average Dry Weather Flow 6ADWFResidential m3/day 405.9 459.2 519.6 587.9 665.1l/s 4.7 5.3 6.0 6.8 7.7Commercial and institutional m3/day 281.4 281.4 281.4 281.4 281.4l/s 3.3 3.3 3.3 3.3 3.3ADWF (total) m3/day 687.3 740.6 800.9 869.2 946.5l/s 8.0 8.6 9.3 10.1 11.0Peak Dry Weather Flow 6 PDWFResidential l/s 14 16 18 20 23Commercial and institutional l/s 10 10 10 10 10PDWF (total) l/s 24 26 28 30 33Inflow/infiltrationinflow/infiltration l/s 3 8 8 8 9Peak Wet Weather Flow l/s 26 33 36 38 42
Fraser Valley Regional District<strong>Cultus</strong> <strong>Lake</strong> <strong>Sanitary</strong> <strong>Sewer</strong> <strong>Infrastructure</strong> <strong>Assessment</strong> – Final ReportAppendix CProject No. 30825 – September, 2012
Dmitri Loukin / Mar. 6, 12 / T:\Projects\30000\30825 <strong>Cultus</strong> <strong>Sanitary</strong> <strong>Sewer</strong> <strong>Infrastructure</strong> <strong>Assessment</strong>\Client Data\Drawings\Figure_8-Mechanical.dwgLABORATORYWASHROOMSHOWERLOCKERUVMODULEUVMODULEUVMODULE13850MECH.ROOMCONTROLROOMELECTRICALROOMBLOWERS ROOM2780027800FINESCREENSPOLYMERDOSINGCHEMICALDOSINGPERMEATEPUMPS6m WIDE O/H DOORMEMBRANETANKMEMBRANETANKMEMBRANETANKMEMBRANETANK19800315008750SLUDGEPUMPS450001170011300EQUALIZATIONPUMPSEFFLUENTPUMPSSLUDGEBININFLUENTPUMPS5200AEROBICZONEAEROBICZONEANOXICZONEANOXICZONE10100570022300MEMBRANETANKAEROBICZONE2270020200700010100FINESCREENSBELTPRESSSLUDGEBINCULTUS LAKE SANITARY SEWER ASSESSMENTPLANT LAYOUT / OPTION 3ANOXICZONEFIGURE D-2February 2012
Dmitri Loukin / Mar. 7, 12 / T:\Projects\30000\30825 <strong>Cultus</strong> <strong>Sanitary</strong> <strong>Sewer</strong> <strong>Infrastructure</strong> <strong>Assessment</strong>\Client Data\Drawings\Figure_8-Mechanical.dwgBLOWERS ROOM1853630236LABORATORYDISCFILTERDISCFILTERWASHROOMSHOWERLOCKER13850MECH.ROOMCONTROLROOMFLOTATIONFLOTATIONELECTRICALROOMCOAGULATIONFLOCCULATIONCOAGULATIONFLOCCULATION11700278002780087506m WIDE O/H DOORFINESCREENSPOLYMERDOSINGSLUDGEPUMPSAEROBICTANKAEROBICTANKCHEMICALDOSINGEQUALIZATIONPUMPSEFFLUENTPUMPSINFLUENTPUMPSSLUDGEBIN5200113005700151007000FINESCREENSBELTPRESSSLUDGEBINAEROBICTANKCULTUS LAKE SANITARY SEWER ASSESSMENTPLANT LAYOUT / OPTION 2FIGURE D-4February 2012
Fraser Valley Regional District<strong>Cultus</strong> <strong>Lake</strong> <strong>Sanitary</strong> <strong>Sewer</strong> <strong>Infrastructure</strong> <strong>Assessment</strong> – Final ReportAppendix DProject No. 30825 – September, 2012
D.1 Opinion of Probable Costs – Capital CostsThe probable costs of the treatment and pumping options were developed based on the conceptualdesign discussed in the report. All costs are in 2012 Canadian Dollars. The discrepancy between theprobable costs at the planning stage and the costs that will occur is about +/! 25% (Taxes are excluded).Table D.1 Opinion of Probable Costs – Capital CostsDescription Option 2 Option 3 Option 4GeneralMobilization/Demobilization $75,000 $100,000 $15,000Cash allowance for utilities $30,000 $30,000 $20,000O&M manuals and record drawings $10,000 $10,000 $2,000Commissioning $40,000 $40,000 $5,000Site workSite preparation, clearing and grabbing $10,000 $15,000 $5,000Site grading, paving and fencing $75,000 $60,000 $15,000Drainage pipes (disposal fields) $390,000 $4,800Forcemain, 250 mm (3.2 km) $1,280,000SubstructureExcavation, trenching and backfilling $28,000 $72,000Concrete $540,000 $750,000 $40,000Building $1,050,000 $1,050,000 $50,000Metals $250,000 $250,000 $25,000Process EquipmentGrinders $70,000 $70,000Influent pumps $60,000 $60,000Fine screens $250,000 $250,000Equalization tank pumps $90,000 $90,000MBR equipment $3,000,000MBBR equipment $2,000,000UV disinfection $300,000Effluent pumps $90,000 $90,000Sludge transfer pumps $50,000 $50,000Gravity belt press $310,000 $310,000Odour control unit $200,000 $200,000 $75,000Sewage pumps $180,000Process piping and valves $400,000 $500,000Laboratory equipment and furniture $50,000 $50,000MechanicalHeating and ventilation $400,000 $400,000 $50,000Plumbing $150,000 $150,000Electrical and InstrumentationMCC $250,000 $400,000 $50,000PLC + Instruments and control system $200,000 $250,000 $40,000Wiring, cabling and lighting $50,000 $70,000 $10,000Standby Generator $250,000 $250,000 $150,000Total Construction CostEngineering and construction contingencies (35%)$7,368,000$2,578,800$8,871,800$3,105,130$2,012,000$704,200City of Chilliwack upgrade cost $1,500,000City of Chilliwack (DCC Charges) $2,035,000Total cost $9,946,800 $11,976,930 $6,251,200Table Notes:For all options, costs do not include routing of any gravity pipes or servicing’s forcemains to the location of the proposedtreatment plant or pump station.The costs does not include any costs associated with land acquisition
D%2 Opinion of Probable Costs % Operation and Maintenance CostsOperation and maintenance (O&M) costs associated with each option differs depending on the equipmentused and the level of staffing required. Table D.2 outlines the estimated yearly O&M (fixed and variable)costs.The yearly O&M costs were developed to compare between the investigated options, and should not beused for billing purposes. The O&M costs were developed based on average flow rate of the anticipatedconstruction year (2012) which is 698 m 3 /day.Table D.2 Estimated Yearly Operating CostsYearly Operating Cost Option 2 Option 3 Option 4FixedcostVariablecostFixedcostVariablecostFixedcostVariablecostPower cost ($0.1/kwh) $40,000 $61,000 $11,000Chemical consumption $15,000 $9,000Labour cost ($ 30.0/hour) $94,000 $94,000 $15,000Repairs and replacement costs(5% of equipment costs)$244,000 $325,000 $28,000Laboratory analysis and supplies $15,000 $15,000Sludge disposal fees ($60/wet$19,000 $19,000tonne)Gas, water, and phone$23,000 $25,000allowance Total estimated yearly operating $376,000 $74,000 $459,000 $89,000 $43,000 $11,000costsEstimated variable cost/m 3 $0.29 $0.35 $0.04
D%3 City of Chilliwack <strong>Sewer</strong> Users RatesCurrently, the city of Chilliwack charges quarterly basic fees and consumption fee for sewer. The ratesare as follows:! Basic Fee: $ 27.66 for each single residential property, dwelling or mobile unit pad connected tothe sewer system.! Consumption fee: $2.05 per 100 cubic feet of sewer ($0.724/m3)Table D.3 provides the estimated costs for basic and consumption fees.YearPopulationNo. OfResidentialCustomersNo. OfCommercial&institutionalCustomersTotalNumber ofCustomersCity ofChilliwackBasic Fee($)AverageDailyFlowm3/dayCity ofChilliwackConsumptionFee($)TotalYearlyCost($)2011 990 487 487 53,904 687 181,614 235,5182012 1,015 499 499 55,252 698 184,938 240,1902013 1,040 512 512 56,633 709 187,252 243,8852014 1,066 525 525 58,049 719 190,071 248,1202015 1,093 538 538 59,500 730 192,890 252,3902016 1,120 551 558 1,109 122,725 741 195,709 318,4342017 1,148 565 558 1,123 124,250 753 198,899 323,1482018 1,177 579 558 1,137 125,812 765 202,088 327,9012019 1,206 594 558 1,152 127,414 777 205,278 332,6922020 1,236 608 558 1,166 129,056 789 208,467 337,5232021 1,267 624 558 1,182 130,739 801 211,657 342,3962022 1,299 639 558 1,197 132,464 815 215,265 347,7302023 1,331 655 558 1,213 134,232 828 218,874 353,1062024 1,365 672 558 1,230 136,045 842 222,483 358,5272025 1,399 688 558 1,246 137,903 856 226,091 363,9942026 1,434 706 558 1,264 139,807 869 229,700 369,5062027 1,470 723 558 1,281 141,758 885 233,783 375,5412028 1,506 741 558 1,299 143,759 900 237,865 381,6242029 1,544 760 558 1,318 145,809 916 241,948 387,7582030 1,583 779 558 1,337 147,911 931 246,031 393,9422031 1,622 798 558 1,356 150,066 946 250,114 400,180Table NotesResidential customers is based on population density of 2.03 persons/householdCommercial and institutional customers is based on connecting Sunnyside campground, mobile homes and other institutionalfacilities by 2016City of Chilliwack basic fee is based on a quarterly fee of $27.66 per customerCity of Chilliwack consumption fee is based on $2.05 per 100 cubic feet of sewer
D%4 Net Present Value AnalysisThe NPV analysis for options (2, 3, and 4) was completed based on the capital and operating costsidentified in the previous sections. The NPV analysis covers a 20 year period from 2012 to 2031. Theyear 2012 is assumed to be the year for construction of all options while the year 2013 is assumed thestarting year for post!construction operations. The NPV analysis was also based on an annual 2%inflation rate and an interest rate of 5.45%. The interest rate represents the average interest rate forbusiness loans over the last 20 years (1992 to 2011).D.4.1 Option 2YearPopulationADD(m3/day)CapitalCosts($)YearlyFixedCosts($)YearlyVariableCosts($)TotalYearlyCosts($)InflatedYearly Costs($)2012 1,015 698 9,946,800 9,946,8002013 1,040 709 376,000 75,131 451,131 460,1542014 1,066 719 376,000 76,262 452,262 470,5342015 1,093 730 376,000 77,393 453,393 481,1452016 1,120 741 376,000 78,524 454,524 491,9922017 1,148 753 376,000 79,804 455,804 503,2452018 1,177 765 376,000 81,084 457,084 514,7512019 1,206 777 376,000 82,364 458,364 526,5162020 1,236 789 376,000 83,643 459,643 538,5452021 1,267 801 376,000 84,923 460,923 550,8462022 1,299 815 376,000 86,371 462,371 563,6272023 1,331 828 376,000 87,819 463,819 576,7002024 1,365 842 376,000 89,267 465,267 590,0712025 1,399 856 376,000 90,715 466,715 603,7452026 1,434 869 376,000 92,162 468,162 617,7302027 1,470 885 376,000 93,801 469,801 632,2902028 1,506 900 376,000 95,439 471,439 647,1842029 1,544 916 376,000 97,077 473,077 662,4222030 1,583 931 376,000 98,715 474,715 678,0102031 1,622 946 376,000 100,353 476,353 693,957Average NPV$462,887 $15,528,113NPV is based on 2% inflation rate, and 5.40% interest rate
D.4.2 Option 3YearPopulationADD(m3/day)CapitalCosts($)YearlyFixedCosts($)YearlyVariableCosts($)TotalYearlyCosts($)InflatedYearly Costs($)2012 1,015 698 11,976,930 11,976,9302013 1,040 709 459,000 90,360 549,360 560,3482014 1,066 719 459,000 91,721 550,721 572,9702015 1,093 730 459,000 93,081 552,081 585,8732016 1,120 741 459,000 94,441 553,441 599,0632017 1,148 753 459,000 95,981 554,981 612,7432018 1,177 765 459,000 97,520 556,520 626,7322019 1,206 777 459,000 99,059 558,059 641,0342020 1,236 789 459,000 100,598 559,598 655,6582021 1,267 801 459,000 102,137 561,137 670,6112022 1,299 815 459,000 103,878 562,878 686,1462023 1,331 828 459,000 105,620 564,620 702,0342024 1,365 842 459,000 107,361 566,361 718,2832025 1,399 856 459,000 109,103 568,103 734,9012026 1,434 869 459,000 110,844 569,844 751,8972027 1,470 885 459,000 112,814 571,814 769,5872028 1,506 900 459,000 114,784 573,784 787,6832029 1,544 916 459,000 116,755 575,755 806,1952030 1,583 931 459,000 118,725 577,725 825,1332031 1,622 946 459,000 120,695 579,695 844,506Average NPV$563,499 $18,778,407NPV is based on 2% inflation rate, and 5.40% interest rate
D.4.3 Option 4YearPopulationADD(m3/day)CapitalCosts($)YearlyFixedCosts($)YearlyVariableCosts($)<strong>Sewer</strong>UsersRates ($)TotalYearlyCosts($)InflatedYearlyCosts($)201 1,015 698 6,251,20 6,251,200201 1,040 709 43,000 11,168 187,252 241,420 246,249201 1,066 719 43,000 11,336 190,071 244,407 254,281201 1,093 730 43,000 11,504 192,890 247,395 262,537201 1,120 741 43,000 11,673 195,709 250,382 271,021201 1,148 753 43,000 11,863 198,899 253,761 280,173201 1,177 765 43,000 12,053 202,088 257,141 289,583201 1,206 777 43,000 12,243 205,278 260,521 299,257202 1,236 789 43,000 12,433 208,467 263,901 309,202202 1,267 801 43,000 12,624 211,657 267,280 319,425202 1,299 815 43,000 12,839 215,265 271,104 330,475202 1,331 828 43,000 13,054 218,874 274,928 341,838202 1,365 842 43,000 13,269 222,483 278,752 353,525202 1,399 856 43,000 13,485 226,091 282,576 365,542202 1,434 869 43,000 13,700 229,700 286,400 377,898202 1,470 885 43,000 13,943 233,783 290,726 391,279202 1,506 900 43,000 14,187 237,865 295,052 405,044202 1,544 916 43,000 14,430 241,948 299,379 419,202203 1,583 931 43,000 14,674 246,031 303,705 433,765203 1,622 946 43,000 14,917 250,114 308,031 448,743Averag Averag Average Average NPV$43,00 $12,91 $216,55 $272,46 $9,479,24NPV is based on 2% inflation rate, and 5.40% interest rateD.4.4NPV Summary TableDescriptionOption 2($)Option 3($)Option 4($)Capital costs 9,946,800 11,976,930 6,251,200Average yearly operating costs 446,887 547,499 53,416Average yearly sewer users rates $216,550.78Net present value 15,316,954 18,567,248 9,446,251
Fraser Valley Regional District<strong>Cultus</strong> <strong>Lake</strong> <strong>Sanitary</strong> <strong>Sewer</strong> <strong>Infrastructure</strong> <strong>Assessment</strong> – Final ReportAppendix EProject No. 30825 – September, 2012
4 September 2012FV12-1536-00 V.2Levelton Consultants Ltd.Fraser Valley Group301 – 19292 60 th AvenueSurrey, B.C.Canada V3S 3M2Tel: 604 533-2992Fax: 604 533-0768E-Mail: surrey@levelton.com110 - 34077 Gladys AvenueAbbotsford, B.C.Canada V2S 2E8Tel: 604 855-0206Fax: 604 853-1186E-Mail: abbotsford@levelton.comSouthern Interior108 – 3677 Highway 97NKelowna, B.C.Canada, V8J 5C3Tel: 250-491-9778Fax: 250-491-9729Email: kelowna@levelton.comWeb Site: www.levelton.comConstruction MaterialsBuilding ScienceGeotechnicalCorrosion PreventionMetallurgyEnvironmentalPhysical TestingISL Engineering and Land Services Ltd.#301, 20338-65 AvenueLangley, B.C.V2Y 2X3Attention: Randolph R. Rosin, M.Eng., P.Eng.Manager, Municipal EngineeringRe: Memorandum - Groundwater Monitoring Wells and SamplingFrequency <strong>Cultus</strong> <strong>Lake</strong> <strong>Sewer</strong> System (herein referred to as “Site”)1.0 INTRODUCTION AND OBJECTIVESLevelton Consultants Ltd. (Levelton) was retained by ISL Engineering and LandServices Ltd. (ISL) to identify locations and sampling frequency for groundwatermonitoring wells in conjunction with the <strong>Cultus</strong> <strong>Lake</strong> <strong>Sanitary</strong> Project.2.0 SCOPE OF WORKThe scope of work included a review of the following reports/documentsprovided by ISL:1. <strong>Cultus</strong> <strong>Lake</strong> <strong>Sewer</strong> <strong>Assessment</strong>, BC, Prepared By Dayton & Knight Ltd.,Abbotsford, BC (14 May 2010), Prepared for – Fraser Valley RegionalDistrict, Chilliwack, BC;2. Ministry of Environment Permit #5526, Issued By British Columbia Ministryof Environment Lower Mainland Region, Amended 4 February 2011, Issuedto – Fraser Valley Regional District.3. Technical Memorandum: Groundwater Supply Investigation – <strong>Cultus</strong> <strong>Lake</strong>,BC. (File No. 2837) Prepared by Piteau Associates Engineering Ltd. (May2007), Prepared for Urban Systems Ltd.4. Letter report to Urban Systems Ltd. regarding Hydrogeological <strong>Assessment</strong>for Groundwater Supply Development, <strong>Cultus</strong> <strong>Lake</strong>, British ColumbiaPrepared By Piteau Associates Engineering Ltd. (7 September 2007),Prepared for – Urban Systems Ltd.;5. Aquifer Protection Plan for <strong>Cultus</strong> <strong>Lake</strong> <strong>Park</strong>, Prepared By PiteauAssociates Engineering Ltd. (May 2008), Prepared for – <strong>Cultus</strong> <strong>Lake</strong> <strong>Park</strong>Board.Richmond Victoria Nanaimo Courtenay Surrey Abbotsford Kelowna Calgary
ISL Engineering and Land Services Ltd.Proposed Monitoring Well Locations & Sampling Frequency<strong>Cultus</strong> <strong>Lake</strong> <strong>Sewer</strong> SystemFV12-1536-00Page 2 of 53.0 REVIEW FINDINGSThe <strong>Cultus</strong> <strong>Lake</strong> <strong>Sewer</strong> System is located within the <strong>Cultus</strong> <strong>Lake</strong> <strong>Park</strong> community. According toDayton & Knight Ltd. report, the <strong>Cultus</strong> <strong>Lake</strong> <strong>Sewer</strong> System consists of a sewage collectionsystem that discharges into two disposal fields (Disposal 1.1 “East Field” and Disposal 1.2“West Field”). The West Field is located north of the Columbia Valley Highway and to theimmediate west of the <strong>Cultus</strong> <strong>Lake</strong> Water <strong>Park</strong> and the East Field is located south of theColumbia Valley Highway and to the east of Sunnyside Boulevard.According to Piteau’s reports, the groundwater flow in the vicinity of the septic field is to thenorth by northeast, towards the Sweltzer and Vedder Rivers. The community drinking waterwells are located to the southwest of the East Field and are considered by Piteau to have a lowpotential to be impacted by the disposal fields. However, according to Piteau, two drinking waterwells have been installed within and along the eastern boundary of the <strong>Cultus</strong> <strong>Lake</strong> Water parkproperty and are located within 300m and downgradient of the disposal fields.This sewer system was implemented in 1980. In 2007 Piteau installed three groundwatermonitoring wells to the north and south of the east field for the purpose of assessing thepossible impact of the drainage field on a potential new drinking water well to the south.However, no monitoring wells were installed around the west field.According to the monitoring well installation logs for the wells MW07-1, MW07-2 and MW07-3,the wells were installed with the screened portion situated across the groundwater table with ascreen length of approximately 3m. The screened portion of the wells are installed in mainlygravel, however, in the case of MW07-1, the screened portion is installed across both a layer ofsand and a layer of gravel.The locations of MW07-1, MW07-2 and MW07-3 are such that they meet the requirements ofthe well placement around the east field as outlined in the Ministry of Environment’s (MOE)permit 5526.According to the MOE permit 5526 (amended 4 February 2011), groundwater monitoring wellsare required to be installed and regular groundwater data should be collected for these wellsand presented to the Director for review. The following recommendations are such that theyalign with the requirements of the MOE’s permit 5526 with regards to the groundwatermonitoring at the Site.4.0 RECCOMENDATIONS4.1 INSTALLATION OF GROUNDWATER MONITORING WELLSProvided the Piteau’s wells MW07-1, MW07-2 and MW07-3 still exist and are in good workingcondition, Levelton recommends Situation 1. Should the aforementioned wells no longer exist orare damaged, Levelton recommends Situation 2.
ISL Engineering and Land Services Ltd.Proposed Monitoring Well Locations & Sampling Frequency<strong>Cultus</strong> <strong>Lake</strong> <strong>Sewer</strong> SystemFV12-1536-00Page 3 of 5Situation 1: MW07-1, MW07-2 and MW07-3 still exist and are in good working conditionLevelton recommends that two (2) groundwater monitoring wells be installed at the locations asshown on the attached Figure 1. The well locations are situated such that monitoring wells arelocated between the West disposal field (Discharge 1.2) and the <strong>Cultus</strong> <strong>Lake</strong> Water <strong>Park</strong>drinking water wells. The new groundwater wells, as well as MW07-1, MW07-2 and MW07-3 willbe used to collect the groundwater samples as outlined in the MoE permit 5526.Situation 2: MW07-1, MW07-2 and MW07-3 no longer still exist or are damagedLevelton recommends that four (4) groundwater monitoring wells be installed at the locations asshown on the attached Figure 2. These monitoring wells will be used to collect the groundwatersamples as outlined in the MoE permit 5526. The well locations are situated such thatmonitoring wells are located north and south of the East disposal field (Discharge 1.1) and twowells are located between the West disposal field (Discharge 1.2) and the <strong>Cultus</strong> <strong>Lake</strong> Water<strong>Park</strong> drinking water wells.4.2 SAMPLING GROUNDWATER MONITORING WELLSAs per MoE permit 5526, quarterly (four (4) times per year) groundwater monitoring is requiredfor the following parameters:• Fecal coliform, MPN/100ml• Nitrite nitrogen, mg/L• Nitrate nitrogen, mg/L• Total phosphorous, mg/LFurthermore, according to Section 3.3.3 “Quality Assurance” of the Ministry of EnvironmentPermit 5526, a one field blank and one duplicate should also be collected during each samplingevent.According to the BC Field Sampling manual (2003 Edition) a field blank is described as follows:‘Field Reference Samples’, sometimes called QC Samples [or field blanks], arealiquots of water having known concentrations that are sent by the laboratory tothe field, but the seal is broken in the field, the contents are poured out and arehandled identically to a genuine sample. The purpose of field reference samplesis to determine contamination or analyte loss arising from the sample collectionequipment, sample handling equipment (e.g., filtration apparatus) or from thegeneral conditions during sampling (e.g., blowing dust). 1According to the BC Field Sampling manual (2003 Edition) a duplicate is described as follows:Replicate samples are multiple (i.e., two or more) samples collected at the samelocation and time, by the same person, and using the same equipment andprocedures. The smallest number of replicates is two (i.e., a duplicate). Thepurpose of collecting replicate samples is to obtain the precision for each analyteanalyzed within these samples. The observed variance will be the sum of the1 British Columbia Field Sampling Manual for Continuous Monitoring and the Collection of Air, Air-Emissions, Water, Wastewater,Soil, Sediment and Biological Samples, 2003 Edition, Page 20
ISL Engineering and Land Services Ltd.Proposed Monitoring Well Locations & Sampling Frequency<strong>Cultus</strong> <strong>Lake</strong> <strong>Sewer</strong> SystemFV12-1536-00Page 4 of 5local environmental variance, the analytical variance, plus the sampling variance.There are various methods to estimate the sources of variation in results.Replicate analyses of replicate samples has been reported to be a particularlyuseful QC approach in that it permits identification of analytical uncertaintysampling uncertainty, and environmental heterogeneity via analysis of variance(ANOVA) calculations (Ramsey et al., 1992). 2All groundwater sampling procedures are to be carried out in accordance with the “BritishColumbia Field Sampling Manual for Continuous Monitoring and the Collection of Air, Air-Emissions, Water, Wastewater, Soil, Sediment and Biological Samples, 2003 Edition(Permittee)” 3 . The analysis of the samples is to be carried out by a laboratory that conforms tothe procedures outlined n the “British Columbia Laboratory Manual (2009 Permittee Edition) 3 .A copy of the “British Columbia Field Sampling Manual for Continuous Monitoring and theCollection of Air, Air-Emissions, Water, Wastewater, Soil, Sediment and Biological Samples,2003 Edition and the British Columbia Laboratory Manual (2009 Permittee Edition) can bedownload from the following MoE webpage:5.0 CLOSUREhttp://www.env.gov.bc.ca/epd/wamr/labsys/lab_meth_manual.htmlLevelton has prepared this memorandum exclusively for ISL Engineering and Land ServicesLtd. The conclusions made in this report reflect Levelton’s best judgement in light of theinformation available at the time of preparation. No other warranty, expressed or implied, ismade. Any use which a third party makes of this report, or any reliance on or decisions to bemade or actions based on it, are the responsibility of such third parties. Levelton accepts noresponsibility for damages, if any, suffered by a third party as a result of decisions made oractions based on this report. The standard limitations of this report are appended. Yourattention is also drawn to the conditions outlined in the “Terms of Engagement” which will beapplicable to this report.Respectfully submitted,Levelton Consultants Ltd.Prepared by:Prepared by:Per: Gail Schultze, B.Sc., BITProject ManagerEnvironmental ScientistPer: Gina Spencer, EITEnvironmental Project Manager2 British Columbia Field Sampling Manual for Continuous Monitoring and the Collection of Air, Air-Emissions, Water, Wastewater,Soil, Sediment and Biological Samples, 2003 Edition, Page 21-223 or most recent edition, or by a suitable alternative procedure authorized by the Director
ISL Engineering and Land Services Ltd.Proposed Monitoring Well Locations & Sampling Frequency<strong>Cultus</strong> <strong>Lake</strong> <strong>Sewer</strong> SystemFV12-1536-00Page 5 of 5Reviewed by:Per: Neil Shah, P.Eng.PrincipalManager, EnvironmentalSoils & Water Group BC Mainland RegionAttachments: Figure 1 – Proposed Locations of Monitoring Wells – Situation 1Figure 2 – Proposed Locations of Monitoring Wells – Situation 2Standard Limitations
STANDARD LIMITATIONS (SITE INVESTIGATIONS)1. The findings and conclusions documented in this report have been prepared forspecific application to this project and have been developed in a manner consistentwith that level of care normally exercised by environmental professionals currentlypracticing under similar conditions in the area.2. The findings of this report are based solely on data collected on site during thisinvestigation and on the conditions of the site during the completion of the work.Levelton has relied on good faith on information provided by individuals and sourcesnoted in the report. No other warranty, expressed or implied, is made.3. If new information is developed in future work that affects the conclusions of thisreport, Levelton should be contacted to re-evaluate the conclusions of this report andprovide amendments as required.4. The service provided by Levelton in completing this report is intended to assist theclient in a business decision. The liability of the site is not transferred to Levelton asa result of such services, and Levelton does not make recommendation regardingthe purchase, sale, or investment in the property.
Fraser Valley Regional District<strong>Cultus</strong> <strong>Lake</strong> <strong>Sanitary</strong> <strong>Sewer</strong> <strong>Infrastructure</strong> <strong>Assessment</strong> – Final ReportAppendix FProject No. 30825 – September, 2012