indianapolis <strong>Airport</strong> <strong>Authority</strong>Schedule of Insurance in ForceAs of December 31, 2010CarrierCarrier NameName PolicyPolicy NumberNumber PolicyPolicy TermTerm AbstractAbstract ofof of of CoverageCoverageLimitLimit ofof of ofLiabilityLiability PremiumPremiumLexington Insurance CompanyLexington Insurance Company 012944932012944932 07/15/2010 to07/15/2010 to to to Property All All All Risk; Risk; Real/Personal; BlanketProperty All Risk; Real/Personal; Blanket $ 1,000,000,000$ 1,000,000,000$$ 652,641652,64107/15/2011 7/15/117/15/11 Boiler & Machinery, (incl. in in in Blanket)Boiler & Machinery, (incl. in Blanket) includedincludedBusiness Interruption, (as (as (as p/o p/o Blanket)Business Interruption, (as p/o Blanket) includedincluded includedincludedTerrorism Risk Risk Insurance ActTerrorism Risk Insurance Act Act includedincluded includedincludedIMC IMC specific; Property All All All Risk; Risk; R&P; BlanketIMC specific; Property All Risk; R&P; Blanket incl. incl. aboveincl. above includedincludedBoiler & Machinery, (incl. in in in Blanket)Boiler & Machinery, (incl. in Blanket) incl. incl. aboveincl. above includedincludedLoss Loss or or or Rents (per (per finance req. req. as as as p/o p/o Blanket)Loss or Rents (per finance req. as p/o Blanket) incl. incl. aboveincl. above includedincludedTerrorism Risk Risk Insurance ActTerrorism Risk Insurance Act Act incl. incl. aboveincl. above includedincludedACE ACE USA USA Property & Casualty Insurance Co.ACE USA Property & Casualty Insurance Co. Co. AAPN02202116004AAPN02202116004 07/15/2010 to07/15/2010 to to to <strong>Airport</strong> and and Aviation General Liability<strong>Airport</strong> and Aviation General Liability 100,000,000100,000,000 152,909152,90907/15/2011 7/15/117/15/11 Aviation Non-Certified War War & TerrorismAviation Non-Certified War & Terrorism 100,000,000100,000,000 10,81710,817Lloyd's, LondonLloyd's, London N9905297N9905297 07/15/2010 to07/15/2010 to to to Excess Liability - Auto; - Excess Liability - ELExcess Liability - Auto; Excess Liability - EL- EL EL 150,000,000150,000,000 includedincluded07/15/20117/15/117/15/11 Excess Non-Certified War War & TerrorismExcess Non-Certified War & Terrorism 150,000,000150,000,000 6,5236,523Hartford Fire Fire Insurance Co.Hartford Fire Insurance Co. Co. 83UENPD225483UENPD2254 07/15/2010 to07/15/2010 to to to Automobile Liability and and Physical DamageAutomobile Liability and Physical Damage 1,000,0001,000,000 84,39584,39507/15/201107/15/2011Chubb IndemnityChubb Indemnity 9915170799151707 07/15/2010 to07/15/2010 to to to Workers Compensation andWorkers Compensation and and StatutoryStatutory 344,661344,66107/15/201107/15/2011 Employers LiabilityEmployers Liability 1,000,0001,000,000 includedincludedChubb IndemnityChubb Indemnity 9915170899151708 07/15/2010 to07/15/2010 to to to Foreign Workers Compensation andForeign Workers Compensation and and StatutoryStatutory includedincluded07/15/201107/15/2011 Employers LiabilityEmployers Liability 1,000,0001,000,000 includedincludedAIG AIG WorldSourceAIG WorldSource WR10006214WR10006214 07/15/2010 to07/15/2010 to to to Foreign LiabilityForeign Liability 1,000,0001,000,000 2,5002,50007/15/201107/15/2011Lexington Insurance Co.Lexington Insurance Co. Co. 1478131114781311 07/15/2010 to07/15/2010 to to to Law Law Enforcement LiabilityLaw Enforcement Liability 2,000,0002,000,000 81,05981,05907/15/201107/15/2011Admiral Insurance Co.Admiral Insurance Co. Co. EO00000920202-03EO00000920202-03 07/15/2010 to07/15/2010 to to to Medical Professional LiabilityMedical Professional Liability 250,000/750,000250,000/750,000 30,16730,16707/15/201107/15/2011 Indiana Patient Compensation FundIndiana Patient Compensation Fund includedincludedIllinois National Insurance CoIllinois National Insurance Co Co Co 02-582-08-4602-582-08-46 07/15/2010 07/152009 to07/152009 to to to Employed Lawyers Professional LiabilityEmployed Lawyers Professional Liability 2,000,0002,000,000 5,3615,36107/15/201007/15/201107/15/2010Westchester Fire Fire Insurance CompanyWestchester Fire Insurance Company DONG24458106 002DONG24458106 002 002 07/15/2010 to07/15/2010 to to to Comprehensive CrimeComprehensive Crime 1,000,0001,000,000 4,4924,49207/15/201107/15/2011Westchester Fire Fire Insurance CompanyWestchester Fire Insurance Company DONG25730409 001DONG25730409 001 001 07/15/2010 to07/15/2010 to to to Fiduciary LiabilityFiduciary Liability 3,000,0003,000,000 3,0163,01607/15/201107/15/2011Westchester Fire Fire Insurance CompanyWestchester Fire Insurance Company DONG25730409 001DONG25730409 001 001 07/15/2010 to07/15/2010 to to to Employment Practices LiabilityEmployment Practices Liability 3,000,0003,000,000 18,27518,27507/15/201107/15/2011Westchester Fire Fire Insurance CompanyWestchester Fire Insurance Company DONG25730409 001DONG25730409 001 001 07/15/2010 to07/15/2010 to to to IAA IAA Board, Directors & Officers LiabilityIAA Board, Directors & Officers Liability 10,000,00010,000,000 38,94738,94707/15/201107/15/2011Western SuretyWestern Surety Various Bond #'sVarious Bond #'s #'s #'s VariousVarious Individual Public Official Bonds,Individual Public Official Bonds, 100,000 - 500,000100,000 - 500,000- 4,6254,625according to to to termaccording to term term IAA IAA Board MembersIAA Board Members per per bondper bondHartford Insurance Co.Hartford Insurance Co. Co. ETB017049ETB017049 04/01/2010 to04/01/2010 to to to IAA IAA Board Travel AccidentIAA Board Travel Accident 50,000/250,00050,000/250,000 2,2502,25004/01/201104/01/2011Life Life Insurance Co. Co. of of of North AmericaLife Insurance Co. of North America SPS900303SPS900303 07/01/2009 07/01/200907/01/2010tototo Volunteers Accident/Medical Volunteers Accident/Medical ;;; 2,500/25,0002,500/25,000 36036036007/01/2010 07/01/201107/01/2010 xs xs xs N/O N/O Autoxs N/O Auto Auto 500,000500,000 includedincludedACE ACE American Insurance Co.ACE American Insurance Co. Co. G24660254002G24660254002 11/04/2009 11/04/200911/04/2010tototo Underground Storage Tanks LiabilityUnderground Storage Tanks Liability 1,000,0001,000,000 67767767711/04/201011/04/201111/04/2010AnnualAnnual InsuranceInsurance Premiums;Premiums; estimatedestimated asas as as ofof of of DecemberDecember 31,31, 31, 20102010 $ 1,443,6751,443,675
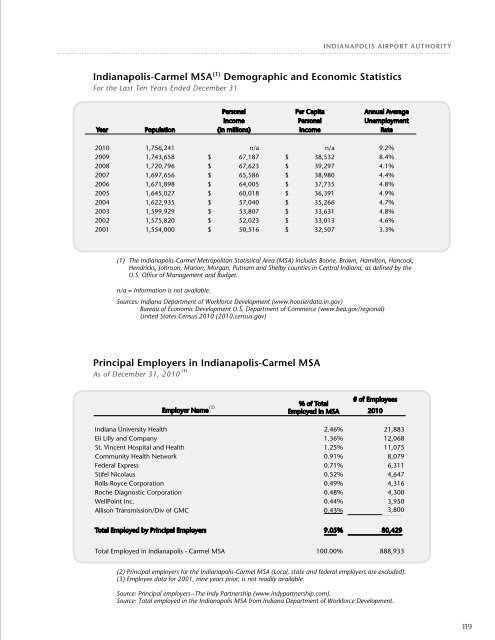
indianapolis <strong>Airport</strong> <strong>Authority</strong><strong>Indianapolis</strong>-Carmel MSA (1) Demographic and Economic StatisticsFor the Last Ten Years Ended December 31Personal Per Capita Annual AverageIncome Personal UnemploymentYear Population (in millions) Income Rate For Transmi2010 1,756,241 n/a n/a 9.2%2009 1,743,658 $ 67,187 $ 38,5328.4%2008 1,720,796 $ 67,623 $ 39,2974.1%2007 1,697,656 $ 65,586 $ 38,9804.4%2006 1,671,898 $ 64,005 $ 37,7354.8%2005 1,645,027 $ 60,018 $ 36,3914.9%2004 1,622,935 $ 57,040 $ 35,2664.7%2003 1,599,929 $ 53,807 $ 33,6314.8%2002 1,575,820 $ 52,023 $ 33,0134.6%2001 1,554,000 $ 50,516 $ 32,5073.3%2000 1,525,104 $ 48,862 $ 31,9162.4%(1) The <strong>Indianapolis</strong>-Carmel Metropolitan Statistical Area (MSA) includes Boone, Brown, Hamilton, Hancock,Hendricks, Johnson, Marion, Morgan, Putnam and Shelby counties in Central Indiana, as defined by theU.S. Office of Management and Budget.n/a = Information is not available.Sources: Indiana Department of Workforce Development (www.hoosierdata.in.gov)Bureau of Economic Development U.S. Department of Commerce (www.bea.gov/regional)United States Census 2010 (2010.census.gov)Principal Employers in <strong>Indianapolis</strong>-Carmel MSA(3)As of December 31, 2010% of Total# of EmployeesEmployer Name (1) Employed in MSA 2010# of Employees% of Total(2)Indiana University Health Employer Name (1) Employed in 2.46% MSA 2010 21,883Eli Lilly and Company 1.36% 12,068St. Indiana Vincent University Hospital Health and Health 1.25% 2.46% 11,075 21,883Community Eli Lilly and Company Health Network 0.91% 1.36% 12,068 8,079Federal St. Vincent Express Hospital and Health 0.71% 1.25% 11,075 6,311Stifel Community Nicolaus Health Network 0.52% 0.91% 4,647 8,079Rolls-Royce Federal Express Corporation 0.49% 0.71% 4,316 6,311Roche Stifel Nicolaus Diagnostic Corporation 0.48% 0.52% 4,300 4,647WellPoint Rolls-Royce Inc. Corporation 0.44% 0.49% 3,950 4,316Allison Roche Diagnostic Transmission/Div Corporation of GMC 0.43% 0.48% 3,800 4,300WellPoint Inc. 0.44% 3,950TotalAllisonEmployedTransmission/Divby Principalof GMCEmployers 9.05%0.43%80,4293,800Total Employed by Principal Employers 9.05% 80,429Total Employed in <strong>Indianapolis</strong> - Carmel MSA 100.00% 888,933Total Employed in <strong>Indianapolis</strong> - Carmel MSA 100.00% 888,933(2) Principal employers for the <strong>Indianapolis</strong>-Carmel MSA (Local, state and federal employers are excluded).(1) Principal (3) Employee employers data for for the 2001, <strong>Indianapolis</strong>-Carmel nine years prior, is MSA not readily (Local, available. state and federal employers are excluded).(1) Principal Source: employers Principal for employers--The the <strong>Indianapolis</strong>-Carmel Indy Partnership MSA (www.indypartnership.com).(Local, state and federal employers are excluded).Source: Total employed in the <strong>Indianapolis</strong> MSA from Indiana Department of Workforce Development.