Indianapolis Airport Authority - Indianapolis International Airport
Indianapolis Airport Authority - Indianapolis International Airport
Indianapolis Airport Authority - Indianapolis International Airport

Create successful ePaper yourself
Turn your PDF publications into a flip-book with our unique Google optimized e-Paper software.
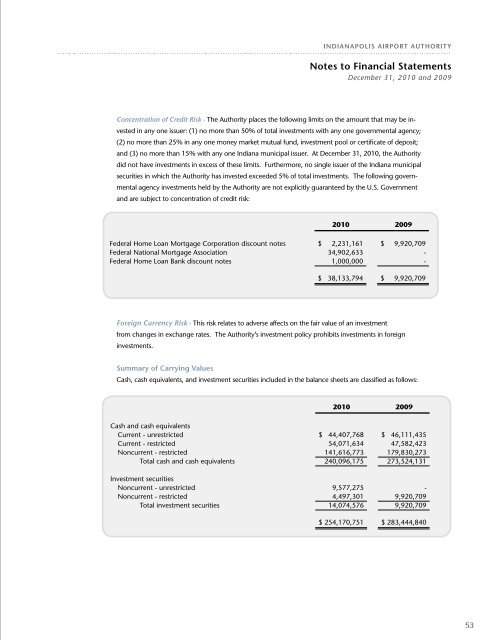
indianapolis <strong>Airport</strong> <strong>Authority</strong>Notes to Financial StatementsDecember 31, 2010 and 2009Concentration of Credit Risk - The <strong>Authority</strong> places the following limits on the amount that may be investedin any one issuer: (1) no more than 50% of total investments with any one governmental agency;(2) no more than 25% in any one money market mutual fund, investment pool or certificate of deposit;and (3) no more than 15% with any one Indiana municipal issuer. At December 31, 2010, the <strong>Authority</strong>did not have investments in excess of these limits. Furthermore, no single issuer of the Indiana municipalsecurities in which the <strong>Authority</strong> has invested exceeded 5% of total investments. The following governmentalagency investments held by the <strong>Authority</strong> are not explicitly guaranteed by the U.S. Governmentand are subject to concentration of credit risk:2010 2009Federal Home Loan Mortgage Corporation discount notes $ 2,231,161 $ 9,920,709Federal National Mortgage Association 34,902,633 -Federal Home Loan Bank discount notes 1,000,000 -$ 38,133,794 $ 9,920,7092010 20092010Foreign Currency Risk - This risk relates to adverse affects on the fair value of an investment2009Federalfrom changesHome Loanin exchangeMortgagerates.CorporationThe <strong>Authority</strong>’sdiscountinvestmentnotespolicy prohibits$ 2,231,161investments in$foreign9,920,709Cash Federal and National cash equivalents Mortgage Association 34,902,633 -Federalinvestments.Current Home - unrestricted Loan Bank discount notes $ 44,407,768 1,000,000 $ 46,111,435 -Current - restricted 54,071,634 47,582,423Noncurrent - restricted 141,616,773 179,830,273Summary of Carrying Values$ 38,133,794 $ 9,920,709Total cash and cash equivalents 240,096,175 273,524,131Cash, cash equivalents, and investment securities included in the balance sheets are classified as follows:Investment securitiesNoncurrent - unrestricted 9,577,275 -Noncurrent - restricted 4,497,301 2010 9,920,709 2009Total investment securities 14,074,576 9,920,709Cash and cash equivalentsCurrent - unrestricted $ 254,170,751 44,407,768 $ 283,444,84046,111,435Current - restricted 54,071,634 47,582,423Noncurrent - restricted 141,616,773 179,830,273Total cash and cash equivalents 240,096,1752010273,524,1312009Investment securitiesInterest Noncurrent and dividend - unrestricted income $ 6,210,897 9,577,275 $ 9,531,422 -Noncurrent - restricted 4,497,301 9,920,709Total investment securities 14,074,576 9,920,709$ 254,170,751 $ 283,444,8402010 20092010 2009Revenue Bond Interest and Principal Fund $ 53,588,251 $ 47,112,220Revenue Interest and Bond dividend Reserve income Fund $ 81,164,090 6,210,897 $ 105,153,842 9,531,422Operation and Maintenance Reserve Fund 12,003,898 11,996,916Renewal and Replacement Fund 2,549,274 2,547,746Capital Improvement Fund 26,099,258 32,296,693Passenger Facility Charge Fund 7,924,273 14,000,145Debt Service Coverage Fund 16,139,678 16,032,241Construction Fund - 2004A Revenue Bonds - 7,484,983Customer deposits 2010 483,383 2009 470,203