A new correlation for predicting hydrate formation conditions for ...
A new correlation for predicting hydrate formation conditions for ...
A new correlation for predicting hydrate formation conditions for ...

Create successful ePaper yourself
Turn your PDF publications into a flip-book with our unique Google optimized e-Paper software.
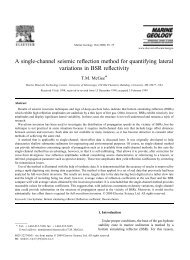
( )A.A. Elgibaly, A.M. ElkamelrFluid Phase Equilibria 152 1998 23–42 35Fig. 9. Cross plot of ANN model-D.models were considered to facilitate comparisons with models available in the literature and also tocheck whether or not more specialized models might lead to better accuracies than a generalizedmodel. Table 3 compares the statistical parameters <strong>for</strong> these models. The results show that thecomprehensive ANN model-D deliver a competitive <strong>correlation</strong> coefficient. For a total number of dataentries of 2387, this model gives an average absolute error of 19.4% and sum-squares error of 0.9794.The cross plot of this model Ž Fig. 9.confirms this fact.To further check the accuracy of the generalized model-D compared to models-C and -D, a smallsubset of the data was considered. In Table 4 the experimental <strong>hydrate</strong>-<strong>for</strong>ming pressure is tabulatedagainst the pressure predicted by different compositional models <strong>for</strong> this data subset. The resultsreveal that the ANN model-D fit is good and compares well with the other models. There<strong>for</strong>e, it canbe concluded that the comprehensive ANN model-D can be generally used to predict the <strong>hydrate</strong><strong>for</strong>mation pressure <strong>for</strong> all system compositions. The predictions of the statistical thermodynamicmodel Ž STM.are also included in Table 4 <strong>for</strong> comparison purposes.The <strong>new</strong> model can predict the <strong>hydrate</strong> <strong>for</strong>mation <strong>conditions</strong> <strong>for</strong> gas systems existing in one ormore of the following phase regions: I–H–V, L w–H–L hc, L w–H–L hc–V, and L w–H–L hc on thegeneral equilibrium pressure–temperature plot. Contrary to the statistical thermodynamic model, thedeveloped model does not necessarily require a priori knowledge of the number and type of phasesbe<strong>for</strong>e prediction.3.4. Validation of the deÕeloped modelsThe validation of the <strong>new</strong> models was examined by using data that have not been considered intheir developments. Random samples of extra measured data points, which represent different phases