mid-market m&a review mid market m&a review - Thomson Reuters ...
mid-market m&a review mid market m&a review - Thomson Reuters ...
mid-market m&a review mid market m&a review - Thomson Reuters ...

Create successful ePaper yourself
Turn your PDF publications into a flip-book with our unique Google optimized e-Paper software.
MID-MARKET MARKET M&A REVIEWLEGAL ADVISORSFirst Half 2013
First Half 2013 | Mergers & Acquisitions | Legal AdvisorsMid-Market M&A Legal ReviewTable of ContentsWorldwide Mid-Market M&A Deals Intelligence 1Worldwide Mid-Market Rankings (MML01)US Target Mid-Market Rankings (MML02)Latin America Involvement Mid-Market Rankings (MML17)234European Involvement Mid-Market Rankings (MML03) 5UK Involvement Mid-Market Rankings (MML04)French Involvement Mid-Market Rankings (MML05)German Involvement Mid-Market Rankings (MML06)Italian Involvement Mid-Market Rankings (MML07)6789Spanish Involvement Mid-Market Rankings (MML08) 10Nordic Involvement Mid-Market Rankings (MML09)Benelux Involvement Mid-Market Rankings (MML10)Eastern Europe Involvement Mid-Market Rankings (MML16)Hochinma Involvement Mid-Market Rankings (MML13)Hong Kong Involvement Mid-Market Rankings (MML12)Australia/New Zealand Involvement Mid-Market Rankings (MML11)Singapore Involvement Mid-Market Rankings (MML14)Japanese Involvement Mid-Market Rankings (MML15)Chinese Involvement Mid-Market Rankings (MML20)111213141516171819Indian Involvement Mid-Market Rankings (MML21) 20Ranking Criteria Summary 21https://www.thomsonone.com
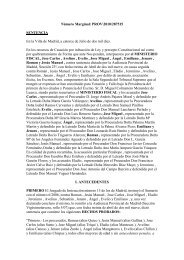
M&A Rankings For Small-Cap Deals Valued Up To US$50m Are Also AvailableFirst Half 2013DEALS VALUED UP TO US$500 MILLIONMID-MARKET M&A LEGAL REVIEWMid-Market Deals IntelligenceWorldwide announced Mid-Market M&A deals valued up to $500 million (including undisclosed value deals)totaled US$322.9 billion in the first half of 2013 – a 9.8% decrease from the first half of 2012.Worldwide Mid-Market M&A up to US$500m by Rank Value Range$25014,000The Americas region (by target domicile) led the <strong>market</strong>, with US$116.2 billion of announced deal activity,respresenting a 36% <strong>market</strong> share, up 5.9% year-on-year.The European region (by target domicile) led the <strong>market</strong> in number of deals announced, with 5,889 deals forthe first half, or 35.2% of the 16,749 deals announced worldwide.The Real Estate sector comprised 20.5% of announced value, followed by Industrials and Energy and Power,representing 11.8% and 11.5% of the total <strong>market</strong>, respectively.Rank Value (US$b)$200$150$10012,00010,0008,0006,000# of DealsJones Day captured the largest share of worldwide deal count, advising on 146 <strong>mid</strong>-<strong>market</strong> M&A deals in thefirst half of 2013. White & Case led the value rankings, with a total of $6.7 billion of Rank Value.Announced Mid-Market M&A by Target Nation Up To US$500m Jan 1 - Jun 301/1/2013- 6/30/2013 1/1/2012 - 6/30/2012 %Region/NationWorldwideRank ValueUS$m322,856.7# ofDeals16,749Rank ValueUS$m354,670.7# ofDeals18,969Change inRankValue-9.0 ▼Americas 116,166.3 5,301 138,986.0 5,724 -16.4 ▼United States of America82,440.1 3,784 92,453.7 3,822 -10.8 ▼Canada 16,068.4 822 21,195.6 986 -24.2 ▼Brazil 7,250.0 252 12,415.9 396 -41.6 ▼Mexico 3,623.1 95 1,902.0 89 90.5 ▲Peru1,487.7 70 1,005.8 57 47.9 ▲Chile1,236.2 762,099.8 89 -41.1 ▼Guatemala 911.0 40.02 - -Europe77,391.8 5,889 90,075.6 7,081 -14.1 ▼United Kingdom21,052.2 1,015 25,325.1 1,249 -16.9 ▼Germany8,398.7 586 8,721.5 709 -3.7 ▼France6,428.5 738 7,593.4 810 -15.3 ▼Russian Federation5,798.9 8748,911.4 1,226 -34.9 ▼Spain5,172.8 3203,654.9 415 41.5 ▲SwedenItaly4,494.43,678.33532103,274.95,222.237923537.2 ▲-29.6 ▼Turkey3,330.9 1503,251.3 123 2.4 ▲NorwayPoland3,302.22,402.92151273,400.92,879.5302122-2.9 ▼-16.6 ▼Netherlands2,371.0 1992,925.8 261 -19.0 ▼Africa/Middle East/Central Asia9,570.0 517 12,579.6 632 -23.9 ▼Israel2,287.6 902,437.8 94 -6.2 ▼South Africa 2,137.8 1233,830.9 154 -44.2 ▼Asia-Pacific (ex Central Asia)97,582.6 4,080 96,780.8 4,439 0.8 ▲China44,405.5 1,400 37,233.3 1,554 19.3 ▲Australia14,138.5 596 16,130.5 660 -12.3 ▼South Korea9,863.9 433 10,762.6 483 -8.4 ▼Hong Kong6,130.1 1934,986.5 172 22.9 ▲India5,106.5 4496,915.1 455 -26.2 ▼Singapore 3,762.4 1724,895.3 173 -23.1 ▼Malaysia2,615.2 2514,451.6 221 -41.3 ▼New ZealandIndonesia1,905.31,903.559100765.42,081.471148148.9 ▲-8.5 ▼Japan22,146.1 962 16,248.7 1,093 36.3 ▲4,000$502,000$0-US$200 - 500m US$100 - 200m US$50 - 100m US$0 - 50m # of DealsWorldwide Mid-Market M&A up to US$500m by Target Industry Jan 1 - Jun 30 20134.4% 2.3% Real Estate4.5%20.5%Industrials5.2%Energy and PowerFinancials6.0%MaterialsHigh TechnologyMedia and Entertainment6.4%11.8%HealthcareConsumer Staples7.1%RetailConsumer Products and Services11.5%Telecommunications9.0%Government and Agencies11.3%https://www.thomsonone.com1
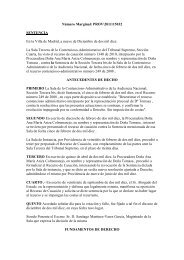
First Half 2013 │ Mid-Market M&A Up To US$500m │ Legal AdvisorsWorldwide Mid-Market Rankings (MML01)MML01 - Undisclosed Values & Values up to US$500mJan 1 - Jun 30Worldwide Mid-Market M&A up to US$500m by Target Nation RegionJan 1 - Jun 30# of Deals per AdvisorRank Value per Advisor (US$m)2013 2012 # ofChange inRank2013 YoY RankRank Value (US$b)Legal AdvisorRank Rank Deals# of DealsValue US$m Rank Val Chg (%)Jones Day 1 2146-33 ▼5,044.27 -34.9 ▼$0 $50 $100 $150 $200 $250 $300 $350DLA Piper LLP 2 1140-47 ▼ 6,261.5417.7 ▲Allen & Overy 3 5110-13 ▼5,356.35 -23.6 ▼Kirkland & Ellis4 795-12 ▼6,631.62 -0.9 ▼ 2009Baker & McKenzie5 3 90-53 ▼4,649.311 -46.3 ▼Clifford Chance 6 888-13 ▼4,990.08 -23.1 ▼Linklaters7 486-44 ▼4,735.010 -53.2 ▼ 2010CMS 8 983-17 ▼1,985.341 -23.2 ▼Latham & Watkins 9 679-40 ▼6,331.03 -22.6 ▼White & Case LLP 10 26 78 19 ▲6,715.61 109.8 ▲Freshfields Bruckhaus Deringer 11 13 73-9 ▼3,478.619 -51.9 ▼2011Hogan Lovells 12 1269-16 ▼4,617.212 13.9 ▲Gowling Lafleur Henderson LLP 13 1163-28 ▼2,082.338 -41.0 ▼Nagashima Ohno & Tsunematsu 14 19*58-11 ▼5,048.7687.5 ▲ 2012Herbert Smith Freehills15* 1655-24 ▼2,905.224 -55.5 ▼Blake Cassels & Graydon15* 1455-26 ▼1,862.645 -62.1 ▼Skadden17 1553-27 ▼4,986.69 -50.4 ▼Stikeman Elliott 18 48* 5111 ▲4,415.21386.7 ▲2013Mori Hamada & Matsumoto19 1748-27 ▼2,820.425 -36.4 ▼King & Wood Mallesons20 3547-2 ▼4,410.514-9.0 ▼Wilson Sonsini Goodrich & Rosati 21* 24*43-18 ▼1,868.844 -42.8 ▼Weil Gotshal & Manges 21* 1843-28 ▼2,510.6 29 -59.1 ▼Africa/Middle East Americas Asia-Pacific Europe JapanDorsey & Whitney LLP23 2842-13 ▼1,056.177 119.8 ▲Shearman & Sterling LLP24* 37*40-7 ▼3,529.81860.6 ▲Morgan Lewis & Bockius24* 2240-25 ▼2,326.731 -13.9 ▼Mayer Brown LLP 26* 2139-28 ▼3,049.521 -14.0 ▼Bryan Cave LLP26* 30*39-13 ▼685.6110 -67.2 ▼Nishimura & Asahi28 4137-8 ▼2,219.635 -14.5 ▼Ashurst29* 1034-63 ▼1,219.570 -81.6 ▼$1004,000Osler Hoskin & Harcourt LLP29* 45*34-7 ▼2,308.3 32 -31.1 ▼Q2 Volume (US$b)Kim & Chang31 24*33-28 ▼2,051.2 39 -43.8 ▼$903,474Simpson Thacher & Bartlett32 50*32-7 ▼ 3,605.017 -16.53,375▼3,1433,500AZB & Partners33* 62*31-2 ▼953.484 -41.5 ▼$80Number of DealsDavis Polk & Wardwell33* 45*31-10 ▼3,457.620 -38.8 ▼2,8233,000Norton Rose 33* 2731-27 ▼1,674.648 -67.8 ▼$702,673Vinson & Elkins LLP 33* 4231 -13 ▼ 3,690.416 -40.7 ▼2,3492,7672,409Eversheds33* 37*31-16 ▼820.992 -22.0 ▼2,1912,241$60Dechert38* 3430-20 ▼574.9122 -74.2 ▼2,500Minter Ellison38* 57*30-5 ▼1,622.25052.3 ▲Olswang38* 141*3017 ▲457.7147 5.5 ▲$50 1,8722,000Fenwick & West LLP41 30*29-23 ▼1,611.551 -30.1 ▼Paul Hastings42* 19*28-41 ▼625.5118 -75.6 ▼$401,500Gibson Dunn & Crutcher42* 3328-23 ▼2,978.92217.9 ▲Amarchand Mangaldas 42* 87*284 ▲1,457.958-1.0 ▼$30Schoenherr Attorney's at Law45* 109* 277 ▲537.61298.1 ▲1,000Ropes & Gray45* 53*27-10 ▼ 1,647.949 -18.7 ▼$20Advokatfirman Vinge 47* 79*260 - 724.7105 20.7 ▲Squire Sanders LLP47* 3626-22 ▼487.6139 -69.4 ▼$10500Gide Loyrette Nouel 47* 87* 26 2 ▲189.2 234 -81.2 ▼Akin, Gump, Strauss, Hauer & Feld 47* 92*26 3 ▲3,958.7 15 150.7 ▲$00Industry Total16,749-2,220 ▼322,856.7-9.0 ▼2003 2004 2005 2006 2007 2008 2009 2010 2011 2012 2013*tieWorldwide Cross Border Volume up to $500m Jan 1 - Jun 30Rank Value (US$b)# of Dealshttps://www.thomsonone.com2
First Half 2013 │ Mid-Market M&A Up To US$500m │ Legal AdvisorsUS Target Mid-Market Rankings (MML02)MML02 - Undisclosed Values & Values up to US$500mJan 1 - Jun 30US Mid-Market M&A up to US$500m by Rank Value Range# of Deals per AdvisorRank Value per Advisor (US$m)Legal Advisors2013Rank2012Rank# ofDealsChange in# of DealsRankValue US$m2013RankYoY RankVal Chg (%)Jones Day1 173 -31 ▼1,997.813 -59.7 ▼Kirkland & Ellis2 271-24 ▼3,925.0 2 -33.9 ▼DLA Piper LLPLatham & Watkins34435352-20-23▼▼1,804.44,244.9141-8.7 ▼-36.4 ▼Wilson Sonsini Goodrich & RosatiBryan Cave LLP56593834-20-10▼▼1,724.3628.71642-42.1 ▼-62.6 ▼Skadden 7* 12*32 -6 ▼3,577.93 -27.6 ▼Morgan Lewis & Bockius7* 6 32-20 ▼2,239.9 9 -5.3 ▼Dorsey & Whitney LLP 9 731 -16 ▼665.0 39 112.7 ▲Vinson & Elkins LLP 10* 1027-14 ▼3,526.14 -41.6 ▼Weil Gotshal & Manges10* 12*27 -11 ▼1,740.315 -54.5 ▼Fenwick & West LLP12* 823-23 ▼709.6 38 -68.1 ▼Akin, Gump, Strauss, Hauer & Feld 12* 49* 2310 ▲3,485.45 150.8 ▲Goodwin Procter LLP14* 1821-14 ▼955.732 -45.1 ▼Cooley LLP 14* 26*21-5 ▼937.733-4.0 ▼Hogan Lovells16 23*20-7 ▼ 1,330.023 -21.8 ▼Ropes & Gray 17* 21*19-10 ▼1,042.7 30 -29.7 ▼White & Case LLP17* 37*19-1 ▼2,519.6747.0 ▲Shearman & Sterling LLP 19* 30*18 -5 ▼1,649.217 118.9 ▲Foley & Lardner 19* 34*18-4 ▼0.0173* - -Andrews Kurth LLP 19* 2818-7 ▼1,445.820 -12.0 ▼Simpson Thacher & Bartlett 19* 2918 -6 ▼2,328.48 -25.3 ▼Davis Polk & Wardwell 23* 30*17-6 ▼2,589.16 -32.6 ▼Fried Frank Harris Shriver & Jacobson 23* 44*171 ▲ 2,140.712 227.2 ▲Paul Hastings25* 12*16-22 ▼113.0104 -92.8 ▼Gibson Dunn & Crutcher25* 1616-21 ▼2,189.81023.1 ▲O'Melveny & Myers 25* 4816 2 ▲1,578.91850.8 ▲Greenberg Traurig 28 21*15-14 ▼1,377.1223.0 ▲Dechert29* 30*14-9 ▼184.782 -67.7 ▼Sullivan & Cromwell 29* 23*14-13 ▼2,143.611 -12.8 ▼Mayer Brown LLP31* 26*13-13 ▼1,166.02726.0 ▲Troutman Sanders LLP 31* 59*134 ▲1,441.521 139.5 ▲Wachtell Lipton Rosen & Katz 31* 51*131 ▲1,545.619 -3.1 ▼Bingham McCutchen LLP 34* 34*12-10 ▼471.247 -19.6 ▼Morrison & Foerster34* 12*12-26 ▼517.145 -80.9 ▼King & Spalding34* 11 12-27 ▼210.378 -78.4 ▼Cravath, Swaine & Moore37* 65*114 ▲1,224.52559.2 ▲Sidley Austin LLP37* 2011-20 ▼859.135 -61.9 ▼Winston & Strawn39* 61*102 ▲85.0113*7.6 ▲McDermott Will & Emery39* 39*10-9 ▼880.734 80.1 ▲K&L Gates 39* 1710 -26 ▼172.683 -53.6 ▼Orrick Herrington & Sutcliffe LLP 39* 69*104 ▲300.063* 191.3 ▲Covington & Burling43* 54*9-1 ▼ 1,182.52631.4 ▲Norton Rose Fulbright43* 199-24 ▼1,077.929 -47.9 ▼Proskauer Rose LLP 43* 137*9 8 ▲658.84140.8 ▲Paul, Weiss43* 23*9 -18 ▼414.753 -72.0 ▼Arnold & Porter43* 54*9-1 ▼304.662 -64.1 ▼WilmerHale 48* 418-10 ▼ 220.276 -74.4 ▼Bracewell & Giuliani 48* 42* 8 -9 ▼1,236.5 24 -25.2 ▼Debevoise & Plimpton 48* 53 8 -3 ▼615.0 44 -47.5 ▼Baker & Hostetler LLP 48* 44* 8 -8 ▼441.7 51- -Baker & McKenzie 48* 36 8 -13 ▼140.8 85 - -Blake Cassels & Graydon 48* 49* 8 -5 ▼52.2 125 - -Choate, Hall & Stewart LLP 48* 104* 8 6 ▲130.0 91* - -Industry Total3,784-38 ▼82,440.1-10.8 ▼Rank Value (US$b)$70$60$50$40$30$20$10$0US Mid-Market M&A up to US$500m by Target Industry Jan 1 - Jun 30 20137.3%6.2%7.4%US$200 - 500m US$100 - 200m US$50 - 100m US$0 - 50m # of Deals2.7% 2.2%3.5%Real Estate5.1%19.8%Energy and PowerFinancials8.1%10.1%11.5%16.2%HealthcareMedia and EntertainmentIndustrialsHigh TechnologyMaterialsConsumer Products and ServicesConsumer StaplesRetailTelecommunicationsGovernment and Agencies3,0002,5002,0001,5001,000500-# of Deals* tiehttps://www.thomsonone.com3
First Half 2013 │ Mid-Market M&A Up To US$500m │ Legal AdvisorsLatin America Involvement Mid-Market Rankings (MML17)MML17 - Undisclosed Values & Values up to US$500mJan 1 - Jun 30Latin American Mid-Market M&A up to US$500m by Rank Value Range# of Deals per AdvisorRank Value per Advisor (US$m)Legal Advisors2013Rank2012Rank# ofDealsChange in# of DealsRankValue US$m2013RankYoY RankVal Chg (%)Mattos Filho Veiga Filho Marrey Jr 1 4 13 -12 ▼ 1,050.51 -45.0 ▼Tozzini Freire Teixeira e SilvaMachado Meyer Sendacz & Opice2*2*6*21111-9-20▼▼627.0355.6418400.0 ▲-85.6 ▼Pinheiro Neto AdvogadosBarbosa Mussnich & Aragao2*513119-22-18▼▼514.9875.673-79.7 ▼13.6 ▲Jones Day6* 88-5 ▼922.0220.2 ▲Veirano Advogados6* 9*8-2 ▼297.22389.4 ▲Stocche Forbes Advogados8 -77 ▲81.647 - -Gowling Lafleur Henderson LLPSouza, Cescon, Barrieu & Flesch Advog9*9*36*6*664-14▲▼342.0527.620635.4 ▲-2.8 ▼Pinheiro Guimaraes9* 116-3 ▼100.342 -39.4 ▼White & Case LLPAzevedo Sette Avogados9*9*57*5665-17▲▼343.3194.21924- --83.0 ▼Lefosse Advogados14 13*5-1 ▼328.421 -49.3 ▼Baker & McKenzie 15 13*4-2 ▼315.322 -44.5 ▼Davis Polk & Wardwell 16* 22*30 -50.6 50 -91.1 ▼Xavier Braganca Advogados16* 19*3-1 ▼163.331 -53.9 ▼Latham & Watkins16* 22*30 -0.058*- -Rubio Leguia Normand and Asociados 16* -33 ▲18.355- -Sullivan & Cromwell16* 36*31 ▲ 513.3 8*-2.6 ▼Cleary Gottlieb Steen & Hamilton 21* 19*2-2 ▼31.953 -92.5 ▼Torys21* -22 ▲372.717- -Covington & Burling21* 36*20 -513.3 8*- -Linklaters21* 9*2-8 ▼0.0 58*- -Shearman & Sterling LLP21* 22*2-1 ▼ 49.551 -90.9 ▼DLA Piper LLP21* -22 ▲133.735*- -Advokatfirmaet Thommessen AS 21* -22 ▲120.938*- -Fried Frank Harris Shriver & Jacobson 21* 22*2-1 ▼559.95 271.8 ▲Skadden21* 13*2-4 ▼116.140* -84.6 ▼Kirkland & Ellis21* -22 ▲482.0 11*- -Allen & Overy 21* -2 2 ▲85.346- -Industry Total 695-205 ▼17,974.8-27.1 ▼* tieRank Value (US$b)$18600$16500$14$12400$10300$8$6200$4100$2$0-US$200 - 500m US$100 - 200m US$50 - 100m US$0 - 50m # of DealsLatin American Mid-Market M&A up to US$500m by Target Industry Jan 1 - Jun 30 20133.6% 2.7% Financials3.9%17.8%Materials4.9%Industrials# of Deals7.4%5.1%8.6%13.0%Consumer Products and ServicesEnergy and PowerConsumer StaplesTelecommunicationsHealthcareReal Estate10.1%11.1%12.0%Media and EntertainmentRetailHigh Technologyhttps://www.thomsonone.com4
First Half 2013 │ Mid-Market M&A Up To US$500m │ Legal AdvisorsEuropean Involvement Mid-Market Rankings (MML03)MML03 - Undisclosed Values & Values up to US$500mJan 1 - Jun 30European Mid-Market M&A up to US$500m by Rank Value Range# of Deals per AdvisorRank Value per Advisor (US$m)2013 2012 # of Change inRank Value 2013 YoY RankLegal AdvisorsRank Rank Deals# of Deals US$m Euro mil Rank Val Chg (%)Allen & Overy1 483-13 ▼ 3,676.4 2,798.5 2 -37.3 ▼CMS2 382-16 ▼ 1,985.3 1,510.9 11 -13.8 ▼Clifford Chance3 577-10 ▼ 3,746.0 2,861.9 1 -34.2 ▼DLA Piper LLPJones Day45287675-254▼▲3,145.42,575.32,391.41,964.34829.3 ▲60.2 ▲Linklaters6 171-50 ▼ 3,486.1 2,668.1 3 -65.4 ▼Freshfields Bruckhaus DeringerBaker & McKenzie78766556-7-22▼▼3,114.91,590.52,362.11,211.3516-54.0 ▼-60.4 ▼White & Case LLP 9 145115 ▲ 2,938.9 2,218.8 6 170.9 ▲Hogan Lovells10 1048-6 ▼ 2,898.1 2,215.2 7 26.2 ▲Herbert Smith Freehills11 18*320 - 1,701.1 1,305.1 13 -33.2 ▼Eversheds 12 1231-13 ▼ 820.9 622.4 35 39.8 ▲Olswang13 78*2817 ▲ 457.7 348.7 735.5 ▲Schoenherr Attorney's at Law14 45*277 ▲ 537.6 409.2 618.1 ▲Advokatfirman Vinge15 27*260 - 724.7 550.5 4720.7 ▲Mayer Brown LLP16 1725-8 ▼ 1,581.3 1,200.6 17 -16.1 ▼Cuatrecasas Goncalves Pereira 17* 27* 24-2 ▼ 1,458.2 1,099.1 18 253.6 ▲Advokatfirmaet Thommessen AS 17* 31*24-1 ▼ 1,275.7980.3 2193.8 ▲Gide Loyrette Nouel17* 36*241 ▲ 181.3 138.7 136 -79.4 ▼Wikborg Rein & Co20* 27*22-4 ▼ 411.8 317.2 80 -75.2 ▼Fidal 20* 31*22-3 ▼ 109.6 84.0 160 10.3 ▲Latham & Watkins20* 1122-23 ▼ 2,039.1 1,540.8 946.8 ▲Squire Sanders LLP23* 1321-17 ▼ 238.7 182.0 119 -78.7 ▼Kirkland & Ellis23* 82*2111 ▲ 1,647.2 1,238.8 1483.8 ▲Ashurst25* 920-38 ▼ 845.9 649.6 33 -77.1 ▼Hannes Snellman25* 39*20-2 ▼ 416.8 319.9 78 -59.5 ▼Mannheimer Swartling Advokatbyra 27* 39*19-3 ▼ 780.4 591.8 40 158.8 ▲Lamartine Conseil27* 69*196 ▲ 33.3 25.3 192 114.8 ▲Advokatfirman Delphi27* 33*19-5 ▼ 226.5 174.7 121 77.0 ▲Uria Menendez30* 48*18-1 ▼ 1,999.8 1,507.8 1079.4 ▲Chiomenti Studio Legal30* 42*18-3 ▼ 325.9 249.1 103 -65.4 ▼Weil Gotshal & Manges30* 22*18-9 ▼ 1,320.1 1,010.5 20-7.6 ▼Houthoff Buruma33* 72*175 ▲ 291.7 224.3 109 267.8 ▲P+P Pollath + Partners33* 45*17-3 ▼ 579.5 437.8 55 174.0 ▲De Brauw Blackstone Westbroek 33* 53*170 - 779.3 593.3 41 -33.0 ▼Skadden33* 22*17-10 ▼ 960.6 733.2 30 -68.4 ▼Gateley LLP37 20*16-15 ▼ 0.00.0 316*- -Loyens & Loeff38* 36*15-8 ▼ 1,037.8 783.4 27-1.5 ▼Slaughter & May38* 58*15-1 ▼ 1,970.5 1,514.3 1226.2 ▲Landwell38* 111*158 ▲ 108.3 80.5 1614.7 ▲Dechert38* 39*15-7 ▼ 287.3 216.0 110 -78.5 ▼Luther Rechtsanwaltsgesellschaft mbH 38* 72*153 ▲ 207.3 160.0 125 -56.6 ▼Cleary Gottlieb Steen & Hamilton 43* 33*14-10 ▼ 1,644.7 1,241.7 15 -49.3 ▼DWF 43* 58*14-2 ▼ 136.6 104.6 152 -68.4 ▼NCTM43* 241*1412 ▲ 3.12.4 280 -98.9 ▼Paul Hastings43* 18*14-18 ▼ 101.3 78.5 165 -89.5 ▼Advokatfirmaet Wiersholm AS43* 36*14-9 ▼ 352.3 273.7 92 -62.4 ▼Amarchand Mangaldas43* 94*145 ▲ 588.7 444.4 52 -19.6 ▼Garrigues 49* 15*13-22 ▼ 748.0 556.6 44 -25.0 ▼Travers Smith49* 53* 13-4 ▼ 741.1 566.1 46 -41.8 ▼LAWIN49* 94*134 ▲ 31.5 24.0 196* -85.2 ▼Noerr LLP49* 48* 13-6 ▼ 744.8 573.7 4511.8 ▲Norton Rose 49* 33*13-11 ▼ 985.2 735.8 29 - -Gomez Acebo & Pombo 49* 82* 13 3 ▲ 683.7 510.6 48 - -Industry Total 6,815-1,356 ▼ 100,380.4 76,480.1-19.8 ▼Rank Value (US$b)$806,000$705,000$604,000$50$403,000$302,000$201,000$10$0-US$200 - 500m US$100 - 200m US$50 - 100m US$0 - 50m # of DealsEuropean Mid-Market M&A up to US$500m by Target IndustryJan 1 - Jun 30 20134.9% 3.5% Real Estate17.0%5.2%IndustrialsEnergy and Power5.3%FinancialsMaterials6.0%High Technology15.3%Healthcare6.1%Media and EntertainmentConsumer Staples6.5%Retail12.3%Consumer Products and Services7.9%Telecommunications10.1%# of Deals* tiehttps://www.thomsonone.com5
First Half 2013 │ Mid-Market M&A Up To US$500m │ Legal AdvisorsUK Involvement Mid-Market Rankings (MML04)MML04 - Undisclosed Values & Values up to US$500mJan 1 - Jun 30UK Mid-Market M&A up to US$500m by Rank Value Range# of Deals per AdvisorRank Value per Advisor (US$m)2013 2012 # ofChange inRank Value 2013 YoY RankLegal AdvisorsRank Rank Deals# of Deals US$m GBP mil Rank Val Chg (%)LinklatersAllen & OveryDLA Piper LLP1231*31*352827-15-10-23▼▼▼2,586.81,515.51,052.51,699.1989.9692.91510-50.2 ▼-48.0 ▼-43.8 ▼Hogan LovellsEversheds4*4*20*6262611-5▲▼2,310.3807.91,498.5524.8217164.4 ▲38.2 ▲Clifford ChanceFreshfields Bruckhaus Deringer6749*2322-11-2▼▼1,752.01,203.51,154.6767.047-28.3 ▼-58.6 ▼Jones DayOlswangCMS89109*2611212017-310-6▼▲▼1,156.1302.61,062.8752.9194.5694.0857998.9 ▲-30.2 ▼-28.1 ▼Gateley LLP11 716-14 ▼ 0.00.0 134*- -Herbert Smith Freehills12 1215-4 ▼ 1,217.0 804.1 6 -38.1 ▼DWFSlaughter & May1314*16*16*1413-2-3▼▼136.61,768.189.61,161.7783-68.4 ▼13.2 ▲Ashurst14* 813-12 ▼ 845.9 551.4 16 -70.6 ▼Mayer Brown LLPWhite & Case LLP14*14*16*52*1313-39▼▲926.2956.5592.6619.11311-25.5 ▼1452.8 ▲Travers Smith18* 20*12-3 ▼ 647.7 415.9 21 -33.6 ▼Squire Sanders LLP18* 5 12-21 ▼ 192.7 125.4 71 -82.8 ▼Kirkland & Ellis20 34*115 ▲ 545.7 349.4 26 -27.1 ▼Addleshaw Goddard21 34* 104 ▲ 617.7 400.6 23 803.1 ▲Baker & McKenzie22 13 9-9 ▼ 928.5 602.7 1236.0 ▲Nabarro23* 14*8-9 ▼ 34.0 22.4 108 -25.8 ▼Norton Rose23* 16*8-8 ▼ 847.9 545.4 15 -40.4 ▼Dorsey & Whitney LLP 25 63*74 ▲ 85.8 56.0 9064.4 ▲Berwin Leighton Paisner26* 20*6-9 ▼ 59.2 38.2 97 -92.9 ▼Dechert26* 30*6-1 ▼ 136.0 86.8 79 -67.7 ▼Pinsent Masons26* 52*62 ▲ 384.3 253.0 42- -Edward Nathan Sonnenbergs Inc 26* 94*64 ▲ 662.4 436.8 208.1 ▲A&L Goodbody26* 39*61 ▲ 796.2 518.3 18 1062.3 ▲Minter Ellison26* 52*62 ▲ 369.6 237.9 47 792.8 ▲Latham & Watkins26* 236-6 ▼ 640.4 412.0 2284.4 ▲Weil Gotshal & Manges26* 30* 6-1 ▼ 498.8 326.3 27- -Pannone & Partners26* -66 ▲ 4.83.1 128*- -SJ Berwin35* 34*5-1 ▼ 409.1 264.9 36 -23.9 ▼Cleary Gottlieb Steen & Hamilton 35* 275-4 ▼ 758.1 486.6 1986.9 ▲Houthoff Buruma35* 63*52 ▲ 270.4 175.2 62 241.0 ▲Shearman & Sterling LLP35* 94*53 ▲ 0.00.0 134* - -Osborne Clarke35* 14*5-12 ▼ 24.2 16.0 114 -94.1 ▼Maclay Murray & Spens35* 34*5-1 ▼ 0.00.0 134*- -King & Spalding35* 134*54 ▲ 323.8 214.0 516.7 ▲Osler Hoskin & Harcourt LLP35* 134*54 ▲ 595.7 395.7 24 222.0 ▲Simpson Thacher & Bartlett35* 39*5 0 - 876.5 568.1 14 390.5 ▲Dundas & Wilson44* 52*40 - 332.7 220.2 50 949.5 ▲Kromann Reumert44* 134*4 3 ▲ 0.00.0 134*- -AZB & Partners44* 94*42 ▲ 306.8 200.8 56 75.2 ▲Davis Polk & Wardwell44* 134* 43 ▲ 565.6 374.7 25 379.3 ▲Mannheimer Swartling Advokatbyra 44* 63*41 ▲ 182.2 120.0 72 1192.2 ▲Advokatfirman Delphi44* 134*43 ▲ 161.1 106.1 76 90.4 ▲Taylor Wessing LLP44* 94*42 ▲ 126.6 82.4 82 15.7 ▲Allens44* 52* 40 - 389.1 253.0 40- -Bryan Cave LLP 44* 52* 4 0 - 123.1 79.6 84 - -Morgan Lewis & Bockius 44* 30* 4 -3 ▼ 350.9 230.0 48 - -Gilbert + Tobin 44* 134* 4 3 ▲ 380.9 248.7 43 - -Industry Total1,605-358 ▼ 37,349.3 24,260.3-19.6 ▼Rank Value (US$b)$301,200$251,000$20800$15600$10400$5200$0-US$200 - 500m US$100 - 200m US$50 - 100m US$0 - 50m # of DealsUK Mid-Market M&A up to US$500m by Target IndustryJan 1 - Jun 30 20134.2% 3.9% Real Estate4.5%19.8%FinancialsIndustrials4.9%Energy and Power6.0%HealthcareHigh Technology6.6%11.9%MaterialsConsumer Products and ServicesConsumer Staples6.6%Media and Entertainment11.7%Telecommunications8.6%Retail11.3%# of Deals*tiehttps://www.thomsonone.com6
First Half 2013 │ Mid-Market M&A Up To US$500m │ Legal AdvisorsFrench Involvement Mid-Market Rankings (MML05)MML05 - Undisclosed Values & Values up to US$500mJan 1 - Jun 30French Mid-Market M&A up to US$500m by Rank Value Range# of Deals per AdvisorRank Value per Advisor (US$m)2013 2012 # ofChange inRank Value 2013 YoY RankLegal AdvisorsRank Rank Deals# of Deals US$m Euro mil Rank Val Chg (%)Jones DayFidalCMSLamartine Conseil123*3*729*13*242219197-346▲▼▲▲287.6109.616.733.3221.084.012.825.3234776*6636.8 ▲10.3 ▲-92.1 ▼114.8 ▲Gide Loyrette Nouel3* 4*190 - 165.2 126.3 38 -52.1 ▼Landwell6* 26*158 ▲ 108.3 80.5 484.7 ▲Linklaters 6* 115-16 ▼ 342.0 261.3 17 -81.3 ▼Clifford Chance 8* 9* 12-3 ▼ 731.3 557.6 5 -43.9 ▼Allen & Overy8* 612-6 ▼ 804.8 612.7 4 111.8 ▲Mayer Brown LLP10* 16*11-1 ▼ 256.2 193.0 31 124.3 ▲Ernst & Young Societe d'Avocats SELAS10* 33*116 ▲ 12.6 9.6 82 350.0 ▲Freshfields Bruckhaus Deringer 12* 18*10-1 ▼ 62.1 46.5 59 -96.0 ▼White & Case LLP12* 13*10-3 ▼ 1,171.5 880.6 1 191.1 ▲DLA Piper LLP12*18*10-1 ▼ 298.1 226.5 22 204.8 ▲Dechert15* 24*9 1 ▲ 262.3 196.8 28 4345.8 ▲Paul Hastings15* 4*9-10 ▼ 94.2 73.1 53 -15.5 ▼Baker & McKenzie 15* 11*9 -5 ▼ 158.9 121.9 40 -83.0 ▼De Pardieu Brocas Maffei 15* 3 9-11 ▼ 187.3 142.5 35 -57.0 ▼SJ Berwin 19* 39*73 ▲ 0.00.0 149*- -Cleary Gottlieb Steen & Hamilton 19* 39*7 3 ▲ 912.3 688.4 366.4 ▲Delsol & Associes19* 83* 7 5 ▲ 7.35.7 98* -92.3 ▼Arsene Taxand 19* 59*74 ▲ 548.3 416.2 6 -19.5 ▼LAMY LEXEL Avocats Associes 19* 83* 75 ▲ 1.61.2 129- -Hogan Lovells 19* 11* 7-7 ▼ 91.7 68.9 54 -74.9 ▼Jeantet & Associes 25* 39*62 ▲ 0.00.0 149*- -Bredin Prat25* 226-4 ▼ 153.1 119.4 44 -89.9 ▼Hyde Puylagarde Mahieu Libaud 25* 83*6▲ 0.00.0 149* - -PDGB Societe d'Avocats25* 29*60 - 13.1 10.1 80 -66.7 ▼Veil Jourde25* 24*6-2 ▼ 463.8 348.4 10 1228.9 ▲Ashurst25* 59* 63 ▲ 270.9 208.0 24* 267.1 ▲Cuatrecasas Goncalves Pereira 25* 39*62 ▲ 173.5 133.3 37 130.1 ▲Brunswick societe d'avocats 25* 83*64 ▲ 9.1 7.0 94*- -Hermetet Thomas25* 18*6-5 ▼ 3.32.5 112* -77.4 ▼STC Partners SELARL 25* 33*61 ▲ 46.2 34.4 64 -75.9 ▼Latham & Watkins25* 18*6-5 ▼ 1,053.9 794.3 2 285.1 ▲Herbert Smith Freehills25* 59*63 ▲ 379.0 289.7 11 3442.1 ▲Darrois Villey Maillot Brochier37* 39*51 ▲ 191.9 147.4 34 -51.8 ▼Racine 37* 83* 5 3 ▲ 5.3 4.0 104 - -Fuchs Cohana Reboul & Beroard 37* - 5 5 ▲ 0.7 0.5 141* - -CGR Legal SELARL 37* - 55 ▲ 321.0 244.8 21 - -Industry Total1,012-128 ▼ 13,454.0 10,242.4-13.2 ▼* tieRank Value (US$b)$14$12$10$8$6$4$2$04French Mid-Market M&A up to US$500m by Target IndustryJan 1 - Jun 30 20137.3%8.2%US$200 - 500m US$100 - 200m US$50 - 100m US$0 - 50m # of Deals5.1%4.3% 2.7% Real Estate4.5%20.2%Industrials15.3%MaterialsEnergy and PowerRetailHigh TechnologyConsumer Products and ServicesHealthcareFinancials700600500400300200100-# of Deals9.5%10.4%11.2%Media and EntertainmentConsumer StaplesTelecommunicationshttps://www.thomsonone.com7
First Half 2013 │ Mid-Market M&A Up To US$500m │ Legal AdvisorsGerman Involvement Mid-Market Rankings (MML06)MML06 - Undisclosed Values & Values up to US$500mJan 1 - Jun 30German Mid-Market M&A up to US$500m by Rank Value Range# of Deals per AdvisorRank Value per Advisor (US$m)2013 2012 # ofChange inRank Value 2013 YoY RankLegal AdvisorsRankRank Deals# of Deals US$m Euro mil Rank Val Chg (%)CMS1 136-6 ▼ 418.5 319.5 11 -49.0 ▼Clifford Chance2 4263 ▲ 587.6 447.7 444.1 ▲Freshfields Bruckhaus DeringerJones Day342*10*2016-80▼-1,216.8550.1927.4421.516-60.0 ▼201.4 ▲Luther Rechtsanwaltsgesellschaft mbH 5* 14154 ▲ 207.3 160.0 21 307.3 ▲P+P Pollath + PartnersAllen & OveryWhite & Case LLPHengeler Mueller5*789516*25*2*15141311-558-17▼▲▲▼579.5510.0689.51,062.4437.8385.0531.4807.05732174.0 ▲-14.3 ▼- --42.9 ▼Noerr LLP10* 10*10-6 ▼ 397.1 305.4 12 -37.9 ▼Baker & McKenzie10* 7*10-8 ▼ 188.6 142.7 23 -89.2 ▼Heuking Kuehn Lueer Wojtek 12* 18 80 - 167.3 128.8 2628.9 ▲Hogan LovellsLinklaters12*14*7*1387-10-8▼▼92.693.471.772.83635-86.2 ▼-92.3 ▼Gleiss Lutz14* 19*70 - 258.3 195.5 19 430.4 ▲DLA Piper LLP 16* 66-13 ▼ 6.45.0 53 -92.9 ▼Kirkland & Ellis 16* 50*64 ▲ 0.00.0 58*- -Schoenherr Attorney's at Law 18 50* 53 ▲ 0.00.0 58* - -Osborne Clarke 19* 76*43 ▲ 0.00.0 58*- -GSK Stockmann + Kollegen 19* 36* 41 ▲ 152.4 117.0 31-6.8 ▼Advokatfirman Vinge19* 76*43 ▲ 56.7 43.8 42- -Gowling Lafleur Henderson LLP 22* -3 3 ▲ 299.2 227.0 17- -Houthoff Buruma 22* -3 3 ▲ 7.96.0 52- -Wikborg Rein & Co22* -33 ▲ 79.4 60.7 39- -Esche Schuemann Commichau 22* 76*32 ▲ 0.00.0 58*- -GORG Rechtsanwalte22* 36*30 - 0.00.0 58*- -Ashurst 22* 16*3-6 ▼ 41.1 31.3 44 -77.7 ▼Norton Rose22* 25* 3-2 ▼ 0.0 0.0 58*- -Blake Cassels & Graydon 22* 36* 3 0 - 28.3 21.7 48* -92.8 ▼Olswang 22* 50* 31 ▲ 0.0 0.0 58*- -Willkie Farr & Gallagher 22* 25* 3 -2 ▼ 389.3 296.8 14-0.4 ▼Cleary Gottlieb Steen & Hamilton 32* 22* 2 -4 ▼ 419.5 315.0 10 195.2 ▲Loyens & Loeff 32* 31* 2 -2 ▼ 0.0 0.0 58* - -Gomez Acebo & Pombo 32* 76* 2 1 ▲ 0.0 0.0 58* - -Binder Groesswang 32* - 2 2 ▲ 12.3 9.4 51 - -SJ Berwin 32* 76* 2 1 ▲ 473.1 363.0 9 - -Roedl und Partner 32* 31* 2 -2 ▼ 0.0 0.0 58* - -Mannheimer Swartling Advokatbyra 32* 50* 2 0 - 83.2 63.9 38 - -BEITEN BURKHARDT 32* 19* 2 -5 ▼ 0.0 0.0 58* - -NCTM 32* - 2 2 ▲ 0.0 0.0 58* - -Cuatrecasas Goncalves Pereira 32* 76* 2 1 ▲ 189.8 142.6 22 - -Skadden 32* 22* 2 -4 ▼ 0.0 0.0 58* - -LAWIN 32* - 2 2 ▲ 0.0 0.0 58* - -Havel Holasek & Partners sro 32* 36* 2 -1 ▼ 0.0 0.0 58* - -Bryan Cave LLP 32* 76* 2 1 ▲ 0.5 0.4 57 - -King & Wood Mallesons 32* 50* 2 0 - 162.9 122.9 27 23.8 ▲Advokatfirmaet Wiersholm AS 32* 76* 2 1 ▲ 0.0 0.0 58*- -Wilson Sonsini Goodrich & Rosati 32* - 2 2 ▲ 0.00.0 58* - -Milbank Tweed Hadley & McCloy 32* 50* 2 0 - 0.0 0.0 58* - -Dentons 32* 15 2 -8 ▼ 109.7 82.0 34 -39.1 ▼Bar & Karrer 32* - 2 2 ▲ 0.0 0.0 58* - -King & Spalding 32* - 2 2 ▲ 0.0 0.0 58* - -Latham & Watkins 32* 7* 2 -16 ▼ 89.6 68.3 37 - -Weil Gotshal & Manges 32* 50* 2 0 - 0.0 0.0 58* - -Chiomenti Studio Legal 32* - 2 2 ▲ 0.0 0.0 58* - -Industry Total897-165 ▼ 12,969.9 9,876.0-17.1 ▼Rank Value (US$b)$12700$10600500$8400$6300$4200$2100$0-US$200 - 500m US$100 - 200m US$50 - 100m US$0 - 50m # of DealsGerman Mid-Market M&A up to US$500m by Target IndustryJan 1 - Jun 30 2013Real Estate5.1%Industrials5.3%Materials5.4%Energy and Power33.7%Media and Entertainment6.2%RetailTelecommunicationsConsumer Staples8.4%FinancialsConsumer Products and ServicesHigh Technology9.1%12.7%Healthcare9.9%# of Deals* tiehttps://www.thomsonone.com8
First Half 2013 │ Mid-Market M&A Up To US$500m │ Legal AdvisorsItalian Involvement Mid-Market Rankings (MML07)MML07 - Undisclosed Values & Values up to US$500mJan 1 - Jun 30Italian Mid-Market M&A up to US$500m by Rank Value Range# of Deals per AdvisorRank Value per Advisor (US$m)2013 2012 # ofChange inRank Value 2013 YoY RankLegal AdvisorsChiomenti Studio LegalClifford ChanceNCTMRank123Rank19*23*Deals171413# of Deals-4911▼▲▲US$m325.983.93.1Euro mil249.163.62.4Rank51424Val Chg (%)-65.4 ▼-64.0 ▼-98.9 ▼d'Urso Gatti e Associati 4* -1010 ▲ 505.7 386.4 1- -Gianni Origoni Grippo Cappelli & Partne 4* 210-2 ▼ 52.3 39.5 18 -88.7 ▼CMS6 5*92 ▲ 409.2 313.9 2- -Freshfields Bruckhaus Deringer7* 18*74 ▲ 155.7 116.6 11 292.2 ▲Bonelli Erede e Pappalardo 7* 47 -3 ▼ 1.31.0 25 -99.9 ▼Hogan Lovells9* 18*52 ▲ 52.6 40.9 15*- -Allen & OveryDLA Piper LLP9*11*12*5*541-3▲▼0.00.00.00.026*26*----Latham & Watkins11* 9*4-1 ▼ 370.6 281.0 3 1483.8 ▲Jones Day13* 12*3-1 ▼ 0.0 0.0 26*- -Studio Pedersoli e Associati13* 7*3-3 ▼ 0.00.0 26*- -AshurstLegance Studio Legale Associato13*13*12*7*33-1-3▼▼0.00.00.00.026*26*----Gattai Minoli & Partners13* -3 3 ▲ 0.00.0 26*- -La Torre Morgese Cesaro Rio13* 23*31 ▲ 5.1 4.0 23 -90.5 ▼Cleary Gottlieb Steen & Hamilton 19* 18*2-1 ▼ 232.9 178.5 10 -74.0 ▼Linklaters19* 32-9 ▼ 0.00.0 26*- -Gomez Acebo & Pombo19* -22 ▲ 312.3233.0 6*- -Landwell19* -22 ▲ 0.00.0 26* - -Shearman & Sterling LLP19* 37*21 ▲ 0.00.0 26*- -Labruna Mazziotti Segni19* -22 ▲ 346.9 271.4 4- -Veil Jourde19* -22 ▲ 0.00.0 26*- -Ernst & Young Societe d'Avocats SELAS 19* -22 ▲ 0.00.0 26*- -Norton Rose19* 37*21 ▲ 0.0 0.0 26*- -JP Karsenty & Associes SELARL 19* -22 ▲ 0.00.0 26*- -EY Societe d'Avocats 19* -22 ▲ 0.00.0 26* - -Noerr LLP 19* -22 ▲ 305.8 235.0 8 - -Olswang19* - 2 2 ▲ 0.0 0.0 26*- -Orrick Herrington & Sutcliffe LLP 19* 12* 2 -2 ▼ 0.00.0 26*- -Industry Total296-36 ▼ 5,334.8 4,067.4-33.3 ▼* tieRank Value (US$b)$9$8$7$6$5$4$3$2$1$0US$200 - 500m US$100 - 200m US$50 - 100m US$0 - 50m # of DealsItalian Mid-Market M&A up to US$500m by Target Industry2.9% 2.8% Energy and Power3.4%Financials28.6%Industrials30025020015010050-# of DealsJan 1 - Jun 30 201312.5%Real Estate23.2%23.3%MaterialsHigh TechnologyConsumer StaplesHealthcareConsumer Products and ServicesRetailMedia and Entertainmenthttps://www.thomsonone.com9
First Half 2013 │ Mid-Market M&A Up To US$500m │ Legal AdvisorsSpanish Involvement Mid-Market Rankings (MML08)MML08 - Undisclosed Values & Values up to US$500mJan 1 - Jun 30Spanish Mid-Market M&A up to US$500m by Rank Value Range# of Deals per AdvisorRank Value per Advisor (US$m)2013 2012 # ofChange inRank Value 2013YoY RankLegal AdvisorsCuatrecasas Goncalves PereiraRank1Rank2Deals17# of Deals-6▼US$m1,256.6Euro mil944.3Rank2Val Chg (%)247.0 ▲Uria Menendez2 3151 ▲ 1,839.4 1,383.7 1 177.6 ▲Gomez Acebo & Pombo3 9136 ▲ 683.7 510.6 5 16992.5 ▲GarriguesDLA Piper LLPClifford Chance4561610*12109-22-13▼▼▲497.4726.9676.3372.1549.1517.7946-49.9 ▼26.7 ▲163.9 ▲Khaitan & CoAmarchand Mangaldas7*7*-24*6665▲▲286.9286.9214.8214.813*13*----LinklatersHerbert Smith Freehills9*9*719*55-43▼▲216.9658.9165.9504.5177-75.4 ▼28.2 ▲Jones Day11* 10*4-2 ▼114.6 87.7 20 -45.2 ▼Baker & McKenzie11*84-4 ▼ 109.2 84.9 21 -83.8 ▼Hogan Lovells 13* 19*31 ▲ 370.5 282.6 11 127.2 ▲Sullivan & Cromwell13* -33 ▲ 907.0 694.8 3- -Latham & Watkins13* 15*3 0 - 107.8 82.5 22 -59.0 ▼Covington & Burling16* -22 ▲ 513.3 394.8 8- -CMS16* 24*21 ▲ 367.2 278.1 12 - -Osborne Clarke16* 24*2 1 ▲ 48.2 37.0 24- -Perez Llorca16* 12*2-3 ▼ 135.7 103.3 19 -46.6 ▼Olswang16* -22 ▲ 0.00.0 30*- -Ramon & Cajal Abogados16* 24*2 1 ▲ 7.96.1 27- -Torys 22* - 1 1 ▲ 256.7 197.4 15- -KPMG22* 19*1 -1 ▼ 0.00.0 30* - -Freshfields Bruckhaus Deringer 22* 15* 1 -2 ▼ 1.8 1.4 28 -99.4 ▼Loyens & Loeff 22* - 1 1 ▲ 0.00.0 30* - -Simmons & Simmons 22* - 1 1 ▲ 0.0 0.0 30* - -Bingham McCutchen LLP 22* - 1 1 ▲ 0.0 0.0 30* - -J Sagar Associates 22* - 1 1 ▲ 14.5 11.2 25 - -Ashurst 22* 12* 1 -4 ▼ 0.0 0.0 30* - -Davis Polk & Wardwell 22* 19* 1 -1 ▼ 50.6 37.9 23 -91.2 ▼Mayer Brown LLP 22* - 1 1 ▲ 184.0 141.0 18 - -PAGBAM 22* - 1 1 ▲ 393.7 300.0 10 - -Gramond & Associes 22* - 1 1 ▲ 0.0 0.0 30* - -Gianni Origoni Grippo Cappelli & Partne 22* - 1 1 ▲ 0.0 0.0 30* - -Souza, Cescon, Barrieu & Flesch Advog 22* - 1 1 ▲ 0.0 0.0 30* - -Lobo & de Rizzo Advogados 22* - 1 1 ▲ 0.0 0.0 30* - -Deloitte 22* 4* 1 -11 ▼ 234.8 175.7 16 -30.7 ▼Stocche Forbes Advogados 22* - 1 1 ▲ 0.0 0.0 30* - -Squire Sanders LLP 22* - 11 ▲ 0.00.0 30* - -La Torre Morgese Cesaro Rio 22* - 1 1 ▲ 0.0 0.0 30* - -Allen & Overy 22* 14 1-3 ▼ 12.0 9.3 26 -97.5 ▼Pannone & Partners 22* -1 1 ▲ 1.4 1.0 29 - -Industry Total404 -137 ▼ 9,412.1 7,144.111.8 ▲*tieRank Value (US$b)$9$8$7$6$5$4$3$2$1$0Spanish Mid-Market M&A up to US$500m by Target Industry7.0%US$200 - 500m US$100 - 200m US$50 - 100m US$0 - 50m # of Deals4.5%9.6%4.2%2.7%4.1%21.4%20.7%FinancialsIndustrialsMedia and EntertainmentEnergy and PowerTelecommunicationsConsumer Products and ServicesReal EstateMaterialsConsumer Staples40035030025020015010050-# of DealsJan 1 - Jun 30 201311.4%11.7%RetailHigh TechnologyHealthcarehttps://www.thomsonone.com10
First Half 2013 │ Mid-Market M&A Up To US$500m │ Legal AdvisorsNordic Involvement Mid-Market Rankings (MML09)MML09 - Undisclosed Values & Values up to US$500mJan 1 - Jun 30Nordic Mid-Market M&A up to US$500m by Rank Value Range# of Deals per AdvisorRank Value per Advisor (US$m)2013 2012# ofChange in Rank Value 2013 YoY RankLegal AdvisorsAdvokatfirman VingeRank1Rank2Deals26# of Deals0-US$m724.7Euro mil550.5Rank4Val Chg (%)20.7 ▲Wikborg Rein & CoAdvokatfirmaet Thommessen AS2*2*35*2222-30▼-411.81,004.8317.2772.3151-75.1 ▼54.6 ▲Hannes SnellmanMannheimer Swartling Advokatbyra458720190-2-▼416.8780.4319.9591.8143-59.5 ▼158.8 ▲Advokatfirman Delphi6 418-6 ▼ 226.5 174.7 3377.0 ▲Advokatfirmaet Wiersholm AS7 5*14-8 ▼ 352.3 273.7 23 -62.4 ▼Baker & McKenzie8 18* 124 ▲ 101.7 77.8 4674.1 ▲Gorrissen & FederspielSelmer9*9*110*1111-16-5▼▼151.6129.7113.499.73842-72.5 ▼-74.6 ▼Gernandt & Danielsson11 910-8 ▼ 328.1 251.4 28 -17.2 ▼Kromann Reumert12* 10*9 -7 ▼ 354.4 273.3 22 -72.7 ▼White & Case LLPLAWIN12*1418*24*9812▲▲359.431.5275.024.02153*457.2 ▲-85.2 ▼Advokatfirmaet Schjodt ANS15 14*6 -6 ▼ 804.0 615.0 2 4317.6 ▲Dittmar & Indrenius16* 31* 51 ▲ 430.1 330.0 13 949.0 ▲CMS16* 24*5-1 ▼ 129.3 98.2 43 1206.1 ▲Advokatfirman Cederquist16* 63*54 ▲ 380.5 291.3 17 122.3 ▲Allen & Overy16* 21*5-2 ▼ 345.3 258.0 27 -19.0 ▼Freshfields Bruckhaus Deringer 20* 21*4-3 ▼ 502.1 385.8 78.9 ▲Linklaters20* 134-10 ▼ 0.0 0.0 76*- -DLA Piper LLP20* 34*41 ▲ 490.6 378.6 8- -Raidla Lejins & Norcous20* 31*40 - 31.5 24.0 53* -82.3 ▼Clifford Chance 24* 24* 3 -3 ▼ 641.9 490.0 5 -8.4 ▼Accura Advokataktieselskab24* 24* 3 -3 ▼ 194.6 148.1 35 -2.2 ▼Hamilton Advokatbyra Stockholm Holdin 24* - 3 3 ▲ 32.5 25.0 52 - -Hogan Lovells 24* 63* 3 2 ▲ 18.2 14.0 61 - -MAQS Law Firm Advokatbyra AB 24* - 3 3 ▲ 202.7 153.6 34 - -Advokatfirman SBB Partners AB 24* 63* 3 2 ▲ 0.0 0.0 76* - -Bird & Bird 24* 12 3 -12 ▼ 367.7 281.2 18* -17.1 ▼Attorneys At Law Borenius Ltd 24* 30 3 -2 ▼ 409.4 312.2 16 461.6 ▲Kirkland & Ellis 24* 63* 3 2 ▲ 300.0 225.8 31* - -Latham & Watkins 24* 42* 3 1 ▲ 131.0 101.3 41 91.0 ▲Greenberg Traurig 24* - 3 3 ▲ 58.8 44.1 49 - -Advokatfirman Lindahl 24* 34* 3 0 - 29.2 22.3 55* -75.2 ▼Castren & Snellman 24* 14* 3 -9 ▼ 0.0 0.0 76* - -Herbert Smith Freehills 24* 63* 3 2 ▲ 0.0 0.0 76* - -Hengeler Mueller 38* 24* 2 -4 ▼ 0.0 0.0 76* - -Jones Day 38* 34* 2 -1 ▼ 435.0 326.6 11* - -De Brauw Blackstone Westbroek 38* 63* 2 1 ▲ 347.7 268.3 24* - -Schoenherr Attorney's at Law 38* 31* 2 -2 ▼ 0.0 0.0 76* - -Krogerus Attorneys Ltd 38* 17 2 -7 ▼ 9.9 7.6 67 -95.9 ▼Bruun & Hjejle I/S 38* 42* 2 0 - 180.3 137.4 36* 309.8 ▲DLA Nordic KB 38* - 2 2 ▲ 12.0 9.0 65 - -Gleiss Lutz 38* - 2 2 ▲ 128.0 98.0 44* - -Morrison & Foerster 38* - 2 2 ▲ 367.7 281.2 18* - -Paul, Weiss 38* - 2 2 ▲ 0.0 0.0 76* - -Weil Gotshal & Manges 38* - 2 2 ▲ 610.0 463.9 6 - -O'Melveny & Myers 38* 42* 2 0 - 307.5 231.5 30 6050.0 ▲Waselius and Wist LLP 38* - 2 2 ▲ 0.0 0.0 76* - -Industry Total1,032-152 ▼ 14,363.3 10,946.4-7.9 ▼* tieRank Value (US$b)$14$12$10$8$6$4$2$0Nordic Mid-Market M&A up to US$500m by Target Industry6.1%8.4%US$200 - 500m US$100 - 200m US$50 - 100m US$0 - 50m # of Deals3.6% Real Estate3.8%17.9%Industrials5.7%Energy and Power8.4%9.4%16.9%17.0%MaterialsConsumer StaplesHigh TechnologyHealthcareRetailConsumer Products and ServicesMedia and EntertainmentTelecommunicationsFinancials800700600500400300200100-# of DealsJan 1 - Jun 30 2013https://www.thomsonone.com11
First Half 2013 │ Mid-Market M&A Up To US$500m │ Legal AdvisorsBenelux Involvement Mid-Market Rankings (MML10)MML10 - Undisclosed Values & Values up to US$500mJan 1 - Jun 30Benelux Mid-Market M&A up to US$500m by Rank Value Range# of Deals per AdvisorRank Value per Advisor (US$m)2013 2012 # ofChange inRank Value 2013 YoY RankLegal AdvisorsRank Rank Deals# of Deals US$m Euro mil Rank Val Chg (%)Allen & Overy1 124-10 ▼ 471.7 356.9 14 -80.9 ▼DLA Piper LLP2 6*225 ▲ 469.4 358.2 154.8 ▲Houthoff Buruma3 9*164 ▲ 291.7 224.3 23 267.8 ▲De Brauw Blackstone Westbroek 4* 6*15-2 ▼ 431.5 325.0 19 -62.9 ▼Linklaters4* 215-8 ▼ 691.3 524.8 7 -51.8 ▼Loyens & Loeff6* 3*13-7 ▼ 1,037.8 783.4 24.8 ▲Clifford Chance6* 9*131 ▲ 466.4 353.9 16 -63.3 ▼Freshfields Bruckhaus Deringer 6* 11*134 ▲ 537.2 405.0 9 -48.8 ▼Baker & McKenzie 9 6*12-5 ▼ 914.0 695.0 445.0 ▲CMS10* 3*11-9 ▼ 388.2 297.5 21- -Stibbe10* 14*113 ▲ 1,201.8 908.9 1- -Jones Day12* 14*80 - 168.2 130.0 41 -76.7 ▼Hogan Lovells12* 1781 ▲ 473.9 369.3 13 -12.8 ▼Schoenherr Attorney's at Law14* 70*65 ▲ 202.3 150.1 34*- -White & Case LLP14*14*6-2 ▼ 1,001.1 742.9 3 763.0 ▲Simmons & Simmons16* -55 ▲ 62.2 47.1 57 - -Paul Hastings16* 25*5 1 ▲ 0.00.0 80*- -NautaDutilh18* 54-15 ▼ 816.4 609.1 6 353.6 ▲Shearman & Sterling LLP18* 38*42 ▲ 0.00.0 80*- -Lexence NV18* -44 ▲ 0.00.0 80*- -Herbert Smith Freehills18* 27*41 ▲ 0.00.0 80*- -Blake Cassels & Graydon18* 11*4-5 ▼ 0.00.0 80*- -Chiomenti Studio Legal18* 70*43 ▲ 0.00.0 80*- -Cleary Gottlieb Steen & Hamilton 24* 18*3-3 ▼ 269.3 206.3 29 -76.6 ▼Hengeler Mueller24* 70*32 ▲ 486.7 366.0 11 339.7 ▲Ashurst24* 11*3-6 ▼ 270.9 208.0 26* 23.9 ▲AKD Prinsen Van Wijmen 24* 70*32 ▲ 0.00.0 80*- -Allens24* 38*31 ▲ 237.9 177.8 32 -20.0 ▼Orrick Herrington & Sutcliffe LLP 24* 70* 3 2 ▲ 52.7 40.0 58* - -Latham & Watkins 24* 38* 3 1 ▲ 575.9 429.0 8 443.3 ▲Macfarlanes 31* -22 ▲ 0.0 0.0 80* - -Gowling Lafleur Henderson LLP 31* 70* 2 1 ▲ 271.7 208.6 25 - -Dechert31* - 2 2 ▲ 10.0 7.6 76* - -AZB & Partners 31* 27* 2 -1 ▼ 145.7 111.9 47* -71.7 ▼Anderson Mori & Tomotsune31* - 2 2 ▲ 251.8 188.4 31 - -Mayer Brown LLP 31* 38* 2 0 - 0.0 0.0 80* - -De Pardieu Brocas Maffei 31* 38* 2 0 - 80.0 60.0 55 2400.0 ▲Sayenko Kharenko LLC 31* 70* 2 1 ▲ 104.6 80.0 54 - -Legance Studio Legale Associato 31* - 2 2 ▲ 0.0 0.0 80* - -De Breij Evers Boon BV 31* 38* 2 0 - 0.0 0.0 80* - -SORAINEN 31* - 2 2 ▲ 184.4 141.0 38 - -Bryan Cave LLP 31* 38* 2 0 - 218.6 162.4 33 - -Wragge & Co 31* - 2 2 ▲ 52.7 40.0 58* - -Davis Polk & Wardwell 31* 70* 2 1 ▲ 50.6 37.9 61 -89.7 ▼Squire Sanders LLP 31* 20* 2 -3 ▼ 0.0 0.0 80* - -Norton Rose 31* 38* 2 0 - 109.2 81.6 52 - -La Torre Morgese Cesaro Rio 31* - 2 2 ▲ 0.0 0.0 80* - -Gibson Dunn & Crutcher 31* 70* 2 1 ▲ 265.0 204.8 30 11.8 ▲Machado Meyer Sendacz & Opice 31* 70* 2 1 ▲ 0.0 0.0 80* - -King & Spalding 31* 70* 2 1 ▲ 0.0 0.0 80* - -Kirkland & Ellis 31* 70* 2 1 ▲ 485.6 360.0 12 - -Eversheds 31* 27* 2 -1 ▼ 0.0 0.0 80* - -Lazard Freres & Co LLC 31* - 2 2 ▲ 503.0 383.0 10 - -Weil Gotshal & Manges 31* 20* 2 -3 ▼ 851.2 650.9 5 - -Willkie Farr & Gallagher 31* 38* 2 0 - 370.9 284.3 22 - -Industry Total620-161 ▼ 12,313.8 9,363.1-22.2 ▼Rank Value (US$b)$12$10$8$6$4$2$0600500400300200100-US$200 - 500m US$100 - 200m US$50 - 100m US$0 - 50m # of DealsBenelux Mid-Market M&A up to US$500m by Target IndustryJan 1 - Jun 30 20132.8% 2.5% Industrials15.8%6.4%Real EstateFinancials6.6%MaterialsEnergy and Power14.8%Media and Entertainment8.4%High TechnologyRetailHealthcare8.6%Telecommunications12.7%Consumer Staples9.7%Consumer Products and Services10.0%# of Deals* tiehttps://www.thomsonone.com12
First Half 2013 │ Mid-Market M&A Up To US$500m │ Legal AdvisorsEastern Europe Involvement Mid-Market Rankings (MML16)MML16 - Undisclosed Values & Values up to US$500mJan 1 - Jun 30Eastern European Mid-Market M&A up to US$500m by Rank Value Range# of Deals per AdvisorRank Value per Advisor (US$m)2013 2012 # ofChange inRank Value 2013 YoY RankLegal AdvisorsSchoenherr Attorney's at LawRank1Rank4*Deals16# of Deals4 ▲US$m213.5Euro mil157.8Rank12Val Chg (%)1012.0 ▲Baker & McKenzie2* 11*146 ▲ 127.5 96.7 17 -22.3 ▼Allen & OveryClifford Chance2*4*28*1412-12▼▲432.9934.4324.3709.631-60.3 ▼209.0 ▲CMS4* 7121 ▲ 724.6 554.0 2 204.7 ▲LAWIN6* 11*113 ▲ 31.5 24.0 28* -75.4 ▼SORAINEN6* 4*11-1 ▼ 188.3 144.0 14 436.5 ▲White & Case LLP6* 4*11-1▼ 143.5 105.6 16-71.7 ▼Raidla Lejins & Norcous9* 8*8-2 ▼ 31.5 24.0 28* 10.1▲Havel Holasek & Partners sro9* 18-9 ▼ 0.00.0 40*- -Linklaters11* 8*6-4 ▼ 383.7 296.1 4-2.8 ▼Herbert Smith Freehills11* 21*62 ▲ 154.6 118.6 15 243.6 ▲Freshfields Bruckhaus Deringer 13* 31*42 ▲ 0.00.0 40*- -Hogan Lovells13* 19*4-1 ▼ 47.8 36.2 22 -33.1 ▼SkaddenWeil Gotshal & Manges13*13*11*15*44-4-2▼▼335.1207.3256.4161.1613-35.9 ▼-74.7 ▼Gide Loyrette Nouel 13* 24*41 ▲ 16.1 12.4 33- -DLA Piper LLP 13* 144-3 ▼ 340.3 253.2 547.8 ▲Jones Day19* - 33 ▲ 6.85.2 36- -Sayenko Kharenko LLC19* 31*31 ▲ 104.6 80.0 19 354.8 ▲Squire Sanders LLP19* 24*30 - 36.7 27.6 24- -Greenberg Traurig19* 44*32 ▲58.8 44.1 2196.0 ▲Addleshaw Goddard23* -22 ▲ 269.4 205.3 9- -Trilegal23* -22 ▲ 3.02.3 37- -YukselKarkinKucuk Attorney Partners 23* -2 2 ▲ 0.00.0 40*- -Shin & Kim 23* -2 2 ▲ 13.0 10.1 35- -Amarchand Mangaldas23* -22 ▲ 35.7 26.9 25 - -Dentons 23* 32-11 ▼ 16.8 12.9 31* -94.6 ▼Eversheds23* 31*2 0 - 0.0 0.0 40*- -Olswang23* 44*21 ▲ 0.00.0 40*- -Industry Total 1,608-364 ▼ 15,132.6 11,538.5 -17.5 ▼* tieRank Value (US$b)$121,8001,600$101,400$81,2001,000$6800$4600400$2200$0-US$200 - 500m US$100 - 200m US$50 - 100m US$0 - 50m # of DealsEastern European Mid-Market M&A up to US$500m by Target IndustryJan 1 - Jun 30 20134.3% 2.2% Energy and PowerIndustrials5.8%24.1%Materials# of Deals6.7%6.3%Real EstateRetailFinancialsConsumer Staples7.3%18.3%Media and EntertainmentHigh TechnologyTelecommunications9.9%12.3%Consumer Products and ServicesHealthcarehttps://www.thomsonone.com13
First Half 2013 │ Mid-Market M&A Up To US$500m │ Legal AdvisorsHochinma Involvement Mid-Market Rankings (MML13)MML13 - Undisclosed Values & Values up to US$500mJan 1 - Jun 30Hochinma Mid-Market M&A up to US$500m by Rank Value Range# of Deals per AdvisorRank Value per Advisor (US$m)2013 2012 # ofChange inRank Value 2013 YoY RankLegal AdvisorsRank Rank Deals# of DealsUS$mRank Val Chg (%)AZB & Partners1 2 28-3 ▼ 791.417 -50.5 ▼Amarchand Mangaldas2 4252 ▲1,422.13-1.3 ▼Khaitan & Co 3 323-2 ▼978.71021.0 ▲Jia Yuan Law Offices4 117 -35 ▼894.413 -32.4 ▼King & Wood Mallesons5* 8*150 -1,667.6228.7 ▲Baker & McKenzie5* 6*15-3 ▼ 1,048.16 -41.8 ▼DLA Piper LLP7* 15*144 ▲1,073.1 5 109.7 ▲Zhong Lun Law Firm7* 15*144 ▲880.51437.1 ▲Han Kun Law Offices 9 -1212 ▲616.3 26- -Jun He Law OfficesLinklatersAllBright Law Offices10*10*10*30*10*53*1111115-38▲▼▲982.1999.7233.59855-27.6 ▼-47.5 ▼-49.0 ▼WongPartnership LLP10* 26*114 ▲692.62331.5 ▲Fangda Partners14 6* 10-8 ▼684.524 273.8 ▲Shearman & Sterling LLP15 18*9 0 -1,122.94 164.0 ▲Mayer Brown LLP 16* 22*80 -774.318 174.1 ▲Jurisino Law Group 16* -8 8 ▲190.759- -J Sagar Associates16* 10*8-6 ▼16.4 109 -92.0 ▼Clifford Chance 19* 8*7-8 ▼543.529 -57.4 ▼Freshfields Bruckhaus Deringer 19* 22*7-1 ▼978.111 2169.4 ▲Davis Polk & Wardwell19* 43*73 ▲ 382.93867.6 ▲Dacheng Law Offices19* 97*76 ▲533.130 1859.9 ▲Kirkland & Ellis19* 43*73 ▲1,675.41 372.2 ▲Jones Day24* 43*62 ▲174.968 -67.7 ▼Skadden24* 15*6-4 ▼694.022 -12.6 ▼Hualian Law Firm24* -66 ▲0.0128*- -Herbert Smith Freehills24* 10*6-8 ▼249.251 -79.7Grandway Law Offices24* 97*65 ▲627.625 785.2 ▲PH Bathiya & Associates 24* 26*6-1 ▼0.0128*- -Allen & Overy24* 18*6-3 ▼767.01937.7 ▲Rajah & Tann LLP31* 22*5-3 ▼321.745 -64.5 ▼Allen & Gledhill 31* 22*5-3 ▼300.047 -37.2 ▼Broad & Ken Partners31* -55 ▲164.270- -Drew & Napier31* 53*5 2 ▲182.262 216.3 ▲White & Case LLP31* 34*50 -1,007.07 1165.1 ▲Slaughter & May36* 43*40 -333.643 -39.5 ▼Ashurst 36* 13 4 -9 ▼ 58.585 -95.8 ▼Stamford Law Corp 36* 53*4 1 ▲486.6 33 317.0 ▲Kim & Chang36* 53* 4 1 ▲230.656 42.2 ▲Norton Rose 36* 53* 4 1 ▲183.6 61 -13.6 ▼Hogan Lovells 36* 26* 4 -3 ▼793.6 16 142.8 ▲Simpson Thacher & Bartlett 36* 53* 4 1 ▲0.0 128* - -Orrick Herrington & Sutcliffe LLP 36* 74* 4 2 ▲919.5 12 2965.0 ▲Minter Ellison 36* 34* 4 -1 ▼330.6 44 58.9 ▲JunZeJun Law Offices 45* 74* 3 1 ▲225.8 57 67.5 ▲Tian Yin Law Firm 45* - 3 3 ▲34.5 94 - -Jincheng Tongda & Neal Law Firm 45* - 3 3 ▲809.9 15 - -Trilegal 45* 18* 3 -6 ▼3.0 122 -99.0 ▼Grandall Law Firm 45* 18* 3 -6 ▼58.4 86 -90.5 ▼Gibson Dunn & Crutcher 45* 53* 3 0 -504.6 31 69.3 ▲Ropes & Gray 45* 53* 3 0 -754.4 20 59.7 ▲Blake Cassels & Graydon 45* - 3 3 ▲49.4 87 - -Industry Total2,667 -139 ▼70,532.610.7 ▲*tieRank Value (US$b)$50$45$40$35$30$25$20$15$10$5$0US$200 - 500m US$100 - 200m US$50 - 100m US$0 - 50m # of Deals▼Hochinma Mid-Market M&A up to US$500m by Target IndustryJan 1 - Jun 30 20137.0%8.0%5.2%4.0% 3.4% Industrials15.8%4.0%Real Estate9.0%12.7%14.3%15.4%MaterialsFinancialsEnergy and PowerHigh TechnologyConsumer StaplesHealthcareConsumer Products and ServicesMedia and EntertainmentRetailTelecommunications2,0001,8001,6001,4001,2001,000800600400200-# of Dealshttps://www.thomsonone.com14
First Half 2013 │ Mid-Market M&A Up To US$500m │ Legal AdvisorsHong Kong Involvement Mid-Market Rankings (MML12)MML12 - Undisclosed Values & Values up to US$500mJan 1 - Jun 30Hong Kong Mid-Market M&A up to US$500m by Rank Value Range# of Deals per AdvisorRank Value per Advisor (US$m)2013 2012 # ofChange inRank Value 2013 YoY RankLegal AdvisorsRank Rank Deals# of DealsUS$mRank Val Chg (%)King & Wood Mallesons1 9*85 ▲1,449.62 597.6 ▲Kirkland & Ellis2 16*75 ▲1,675.41 541.2 ▲Mayer Brown LLPJun He Law OfficesLinklaters34*4*4*24*365514-1▲▲▼774.3705.8899.7453179.7 ▲56.5 ▲-2.1 ▼Allen & Gledhill4* 16*53 ▲300.0 21 2930.3 ▲Baker & McKenzie4* 4*50 -398.518 -29.6 ▼Clifford Chance8* 14-7 ▼522.19 -54.5 ▼WongPartnership LLP8* 9*41 ▲413.515 105.7 ▲Norton Rose8* 24*43 ▲183.631 631.5 ▲Slaughter & May11* 24*32 ▲164.73810.5 ▲Fangda Partners11* 9*30 - 664.5 7 6680.6 ▲Han Kun Law Offices11* -33 ▲180.232*- -Kim & Chang11* 24*32 ▲ 229.2 26 41.3 ▲Allen & Overy11* 6*3-1 ▼ 667.0663.3 ▲Orrick Herrington & Sutcliffe LLP 11* -33 ▲456.213- -Stamford Law CorpStikeman Elliott11*18*-24*3231▲▲408.8592.1178- -1721.8 ▲Bae Kim & Lee18* 9*2-1 ▼21.950 -44.8 ▼Freshfields Bruckhaus Deringer 18* 24*21 ▲411.616 15144.4 ▲Jones Day18* -22 ▲27.749- -Ashurst 18* 6*2-2 ▼56.448 -91.8 ▼Davis Polk & Wardwell18* 16*20 -7.958 -95.2 ▼DLA Piper LLP18* 6*2-2 ▼3.859 -98.6 ▼Asian Pacific International Business Law 18* -22 ▲15.852*- -Rahmat Lim & Partners18* -22 ▲0.062*- -Clayton Utz24*2▲453.414- -Gibson Dunn & Crutcher18* 16*20 -504.610 1768.9 ▲Lee and Li 18* -22 ▲15.852*- -Shin & Kim18* -22 ▲188.029 - -Simpson Thacher & Bartlett18* -22 ▲0.062* - -Akin, Gump, Strauss, Hauer & Feld 18* - 2 2 ▲273.322 - -Minter Ellison 18* 9* 2 -1 ▼227.927 - -Industry Total55154 ▲21,970.132.1 ▲* tieRank Value (US$b)$14$12$10$8$6$4$2$0US$200 - 500m US$100 - 200m US$50 - 100m US$0 - 50m # of Deals18* 1Hong Kong Mid-Market M&A up to US$500m by Target IndustryJan 1 - June 30 20133.8% 2.5% Real Estate4.1%20.6%Consumer Staples4.2%MaterialsIndustrials4.8%Energy and PowerFinancials40035030025020015010050-# of Deals9.5%13.6%Media and EntertainmentHealthcareRetail10.9%11.4%12.7%Consumer Products and ServicesHigh TechnologyTelecommunicationshttps://www.thomsonone.com15
First Half 2013 │ Mid-Market M&A Up To US$500m │ Legal AdvisorsAustralia/New Zealand Involvement Mid-Market Rankings (MML11)MML11 - Undisclosed Values & Values up to US$500mJan 1 - Jun 30Australia/New Zealand Mid-Market M&A up to US$500m by Rank Value Range# of Deals per AdvisorRank Value per Advisor (US$m)2013 2012 # of Change inRank Value 2013 YoY RankLegal AdvisorsRank Rank Deals # of DealsUS$mRank Val Chg (%)King & Wood Mallesons1 3*320 -3,304.8110.9 ▲Herbert Smith Freehills2 131-14 ▼1,283.24 -67.1 ▼Minter Ellison 3 3*27-5 ▼1,371.7329.5 ▲Clayton UtzAllens457222201-18▲▼948.62,111.172-15.2 ▼-34.4 ▼Baker & McKenzie6 8* 15-4 ▼1,186.25 -33.2 ▼AshurstNorton Rose7858*1413-16-6▼▼459.7221.91220-57.7 ▼-83.1 ▼DLA Piper LLPChapman Tripp9*9*6161212-104▼▲573.1194.91023-26.8 ▼-64.1 ▼Gilbert + Tobin9* 13*120 -969.86 -22.2 ▼HopgoodGanimAllen & Overy12*12*13*1188-4-7▼▼110.29.63245*-76.0 ▼-97.7 ▼Johnson Winter & Slattery14 -77 ▲688.8 9- -Linklaters15 43*54 ▲529.611- -McCullough Robertson16* 124-10 ▼86.635 -74.3 ▼Steinepreis Paganin16* -44 ▲315.917- -Clifford Chance18* 17*3-3 ▼342.415 -46.3 ▼Stikeman Elliott18* 29*31 ▲763.3 8 2791.3 ▲Kim & Chang18* -33 ▲203.522- -K&L Gates 18* 23*3-1 ▼17.4 42 -96.7 ▼WongPartnership LLP18* 26*30 -5.448 -86.2 ▼Simpson Grierson18* 17*3-3 ▼260.118 358.7 ▲Corrs Chambers Westgarth18* 103-14 ▼457.213 -70.2 ▼Allen & Gledhill25* 43*21 ▲378.614 1047.3 ▲Skadden25* 43*21 ▲157.428 -57.5 ▼Edward Nathan Sonnenbergs Inc 25* 43*21 ▲39 -39.0 ▼Bell Gully 25* 152-8 ▼9.645* -95.5 ▼Olswang 25* -22 ▲78.536- -Blake Cassels & Graydon25* 29*20 -187.6 24* 29.3 ▲Industry Total815-113 ▼19,404.8 -14.8 ▼* tieRank Value (US$b)$16$14$12$10$8$6$4$2$0US$200 - 500m US$100 - 200m US$50 - 100m US$0 - 50m # of Deals43.9Australia/New Zealand Mid-Market M&A up to US$500m by Target Industry5.7%3.3% 3.1% Real Estate3.5%22.2%Energy and PowerMaterials800700600500400300200100-# of DealsJan 1 - Jun 30 20136.2%IndustrialsMedia and Entertainment7.3%8.2%15.7%FinancialsHigh TechnologyConsumer StaplesConsumer Products and ServicesRetailHealthcare9.2%14.6%Telecommunicationshttps://www.thomsonone.com16
First Half 2013 │ Mid-Market M&A Up To US$500m │ Legal AdvisorsSingapore Involvement Mid-Market Rankings (MML14)MML14 - Undisclosed Values & Values up to US$500mJan 1 - Jun 30Singapore Mid-Market M&A up to US$500m by Rank Value Range# of Deals per AdvisorRank Value per Advisor (US$m)2013 2012 # ofChange inRank Value 2013YoY RankLegal AdvisorsRank Rank Deals# of DealsUS$mRank Val Chg (%)WongPartnership LLP1 2192 ▲ 1,303.4138.5 ▲Allen & GledhillShook Lin & Bok LLP23141412-184▼▲1,055.6351.7216-63.4 ▼-60.2 ▼Rajah & Tann LLP4 37-2 ▼670.8 553.8 ▲Baker & McKenzie5 5*6-1 ▼628.3675.3 ▲Linklaters 6* 10*51 ▲408.314- -Stamford Law CorpHerbert Smith Freehills6*6*8*14*55-12▼▲578.3128.372220.6 ▲-78.5 ▼Mori Hamada & Matsumoto9* -44 ▲63.926- -King & Wood Mallesons9* 5*4-3 ▼384.615-4.4 ▼Drew & Napier9* 5*4-3 ▼182.2208.8 ▲Nagashima Ohno & Tsunematsu 12* -33 ▲206.619- -Clifford Chance12* -33 ▲858.33- -White & Case LLP 12* -33 ▲485.28- -Jones Day 15* 14*2-1 ▼69.725 -86.5 ▼AZB & Partners15* 37* 21 ▲151.12151.1 ▲Legance Studio Legale Associato 15* -22 ▲0.039*- -SORAINEN 15* -22 ▲0.039*- -YukselKarkinKucuk Attorney Partners 15* -2 2 ▲0.039*- -William Fry 15* - 22 ▲0.039*- -Khaitan & Co15* 19* 2 0 -335.217 401.0 ▲Johnson Winter & Slattery15* - 22 ▲ 125.923- -Olswang15* -22 ▲0.039*- -Allen & Overy 15* 10* 2-2 ▼678.74 194.8 ▲Amarchand Mangaldas15* 19* 20 -72.224 1504.4 ▲Industry Total382-41 ▼ 10,896.9 -15.1 ▼* tieRank Value (US$b)$9$8$7$6$5$4$3$2$1$0US$200 - 500m US$100 - 200m US$50 - 100m US$0 - 50m # of DealsSingapore Mid-Market M&A up to US$500m by Target IndustryJan 1 - Jun 30 201330025020015010050-# of Deals4.2%4.1%3.3% 2.3% Real Estate3.7%Media and Entertainment27.6%IndustrialsFinancials6.5%7.1%Energy and PowerHigh TechnologyConsumer StaplesRetail10.3%18.2%Consumer Products and ServicesMaterialsHealthcare11.8%Telecommunicationshttps://www.thomsonone.com17
First Half 2013 │ Mid-Market M&A Up To US$500m │ Legal AdvisorsJapanese Involvement Mid-Market Rankings (MML15)MML15 - Undisclosed Values & Values up to US$500mJan 1 - Jun 30Japanese Mid-Market M&A up to US$500m by Rank Value Range# of Deals per AdvisorRank Value per Advisor (US$m)Legal Advisors2013Rank2012Rank# ofDealsChange in# of DealsRank ValueUS$m2013RankYoY RankVal Chg (%)Nagashima Ohno & Tsunematsu 1 258-11 ▼5,048.71 87.5 ▲Mori Hamada & Matsumoto2 148-26 ▼2,820.42 -35.2 ▼Nishimura & AsahiAnderson Mori & Tomotsune 34353717-81▼▲2,219.61,385.434-14.5▼30.7 ▲Baker & McKenzieMorrison & FoersterTMI Associates567486*14109-7-2-4▼▼▼489.4808.8562.41258-57.9 ▼33.1 ▲23.9 ▲Skadden8* 14*60 -407.015 -57.9▼White & Case LLP8* 19*61 ▲515.010 321.1 ▲Allen & Overy8* 14*60 -672.6790.1 ▲Shearman & Sterling LLP11* 26*51 ▲466.8142.8 ▲Oh-Ebashi LPC & Partners11* 42*53 ▲730.16 438.4 ▲Jones Day13* 134-3 ▼44.056 -90.4 ▼City Yuwa Partners13* 32*4 1 ▲209.829 114.5 ▲Kim & Chang13* 6*4-9 ▼23.164 -93.9 ▼Hibiya-Nakata13* -44 ▲525.59- -Rajah & Tann LLP 17* -33 ▲340.020- -Clifford Chance17* 26*3-1 ▼224.727 255.5 ▲Bae Kim & Lee 17* 32*30 - 227.226 73.8 ▲Freshfields Bruckhaus Deringer 17* 10*3 -7 ▼ 49.551* -91.9 ▼Sato Sogo Law Office 17* 32* 3 0 -1.4 93 -98.2 ▼Shiraishi Atsusi Horitsu Jimusho 17* - 3 3 ▲88.7 46 - -Khaitan & Co 17* 26* 3 -1 ▼10.4 81* -97.0 ▼Simpson Thacher & Bartlett 17* 32* 3 0 -129.8 39 -79.8 ▼Ropes & Gray 17* - 3 3 ▲116.2 40* - -Slaughter & May 26* 63* 2 1 ▲319.6 22 400.9 ▲Bingham McCutchen LLP 26* 32* 2 -1 ▼60.7 48 574.4 ▲Ozawa & Akiyama 26* - 2 2 ▲26.5 63 - -CMS 26* - 2 2 ▲0.0 96* - -Ashurst 26* 10* 2 -8 ▼363.8 19 -57.9 ▼Pinheiro Neto Advogados 26* 19* 2 -3 ▼49.5 51* -93.4 ▼Allen & Gledhill 26* 32* 2 -1 ▼38.2 57 -87.0 ▼Yoon & Yang 26* - 2 2 ▲19.3 67 - -Kitahama Partners 26* 42* 2 0 -65.7 47 -68.8 ▼Nakamura, Tsunoda & Matsumoto 26* 63* 2 1 ▲132.8 38 269.9 ▲Daiichi Law Office PC 26* - 2 2 ▲7.9 85 - -Cooley LLP 26* 63* 2 1 ▲175.0 36 -16.7 ▼Soewito Suhardiman EddyMurthy Kardo 26* - 2 2 ▲336.6 21 - -Harashima Horitsu Jimusho 26* - 2 2 ▲46.2 54 - -Norton Rose Fulbright 26* 42* 2 0 -497.1 11 98.8 ▲Wilson Sonsini Goodrich & Rosati 26* - 2 2 ▲250.0 24* - -Lee & Ko 26* 9 2 -9 ▼26.6 60* -93.7 ▼Industry Total 1,289-184 ▼29,701.37.4 ▲* tieRank Value (US$b)$18$16$14$12$10$8$6$4$2$0900800700600500400300200100-US$200 - 500m US$100 - 200m US$50 - 100m US$0 - 50m # of DealsJapanese Mid-Market M&A up to US$500m by Target Industry# of DealsJan 1 - Jun 30 20133.6% 3.0% Real Estate4.2%Industrials4.5%High TechnologyFinancials37.7%5.3%RetailEnergy and Power7.1%MaterialsConsumer StaplesHealthcare9.1%Consumer Products and Services10.5%12.7%Media and EntertainmentTelecommunicationshttps://www.thomsonone.com18
First Half 2013 │ Mid-Market M&A Up To US$500m │ Legal AdvisorsChinese Involvement Mid-Market Rankings (MML20)MML20 - Undisclosed Values & Values up to US$500mJan 1 - Jun 30Chinese Mid-Market M&A up to US$500m by Rank Value Range# of Deals per AdvisorRank Value per Advisor (US$m)2013 2012 # of Change inRank Value 2013 YoY RankLegal Advisors Rank Rank Deals# of DealsUS$m Rank Val Chg (%)Jia Yuan Law Offices 1 1 17 -35 ▼ 894.4 5 5862.7 ▲Zhong Lun Law Firm 2 4* 14 4 ▲ 880.5 6 1280.1 ▲Jun He Law Offices 3* 16* 11 6 ▲ 982.1 2 -11.0 ▼AllBright Law Offices 3* 28* 11 8 ▲ 233.5 33 -31.5 ▼Han Kun Law Offices 3* - 11 11 ▲ 436.1 23 8622.0 ▲King & Wood Mallesons 3* 4* 11 1 ▲ 798.8 8 1231.3 ▲Fangda Partners 7 3 10 -7 ▼ 684.5 15 23.9 ▲WongPartnership LLP 8 - 9 9 ▲ 692.6 13 158.3 ▲Jurisino Law Group 9 - 8 8 ▲ 190.7 35 2197.6 ▲Shearman & Sterling LLP 10* 10* 6 -1 ▼ 688.7 14 -14.5 ▼Dacheng Law Offices 10* 57* 6 5 ▲ 513.1 19 123.1 ▲Hualian Law Firm 10* - 6 6 ▲ 0.0 76* - -Grandway Law Offices 10* 57* 6 5 ▲ 627.6 16 174.9 ▲Kirkland & Ellis 10* 40* 6 4 ▲ 1,359.4 1 83.8 ▲Mayer Brown LLP 15* 16* 5 0 - 774.3 10 289.3 ▲Broad & Ken Partners 15* - 5 5 ▲ 164.2 37 39.2 ▲Skadden 15* 6* 5 -4 ▼ 694.0 12 - -Slaughter & May 18* - 4 4 ▲ 333.6 28 2066.2 ▲Freshfields Bruckhaus Deringer 18* 10* 4 -3 ▼ 978.1 3 71.1 ▲Orrick Herrington & Sutcliffe LLP 18* 40* 4 2 ▲ 919.5 4 - -Hogan Lovells 18* 57* 4 3 ▲ 793.6 9 561.3 ▲Clifford Chance 22* 8* 3 -5 ▼ 21.4 63 - -Tian Yin Law Firm 22* - 3 3 ▲ 34.5 53 - -Davis Polk & Wardwell 22* 28* 3 0 - 377.9 25 -7.0 ▼JunZeJun Law Offices 22* 40* 3 1 ▲ 225.8 34 -52.9 ▼Linklaters 22* 10* 3 -4 ▼ 0.0 76* - -Jincheng Tongda & Neal Law Firm 22* - 3 3 ▲ 809.9 7 193.0Grandall Law Firm 22* 6* 3 -6 ▼ 58.4 48 -94.8 ▼Ropes & Gray 22* 28* 3 0 - 754.4 11 1717.8 ▲Baker & McKenzie 22* 14* 3 -3 ▼ 284.0 30 -0.4 ▼Allen & Overy 22* 16* 3 -2 ▼ 0.0 76* - -Jingtian & Gongcheng 32* 2 2 -20 ▼ 167.6 36 -69.8 ▼LLinks Law Offices 32* 40* 2 0 - 548.5 17 - -Kim & Chang 32* 40* 2 0 - 42.6 51 -77.9 ▼Ashurst 32* 8* 2 -6 ▼ 58.5 47 1439.5 ▲Gold Sun law Firm 32* - 2 2 ▲ 5.8 70 5700.0 ▲Jiangsu Yangtze River Delta Law Firm 32* - 2 2 ▲ 8.0 69 - -Herbert Smith Freehills 32* 16* 2 -3 ▼ 0.0 76* - -Gibson Dunn & Crutcher 32* - 2 2 ▲ 504.6 20 - -Minter Ellison 32* 28* 2 -1 ▼ 102.7 39 148.1 ▲Shook Lin & Bok LLP 32* 23* 2 -2 ▼ 24.6 60 - -Simpson Thacher & Bartlett 32* 40* 2 0 -0.0 76* - -White & Case LLP 32* 28* 2 -1 ▼525.3 18 678.2 ▲Industry Total1,557 -154 ▼ 50,761.9 21.4 ▲Rank Value (US$b)$35$30$25$20$15$10$5$0▲Chinese Mid-Market M&A up to US$500m by Target Industry Jan 1 - Jun 30 20135.5%7.8%5.3%US$200 - 500m US$100 - 200m US$50 - 100m US$0 - 50m # of Deals3.5% 2.7% Real Estate17.2%4.3%Materials15.4%IndustrialsFinancialsHigh TechnologyEnergy and PowerConsumer StaplesHealthcare1,2001,000800600400200-# of Deals* tieRetail9.5%Media and Entertainment13.0%14.5%Consumer Products and ServicesTelecommunicationshttps://www.thomsonone.com19
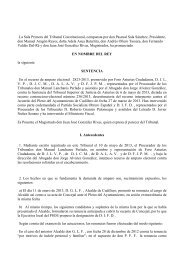
First Half 2013 │ Mid-Market M&A Up To US$500m │ Legal AdvisorsIndian Involvement Mid-Market Rankings (MML21)MML21 - Undisclosed Values & Values up to US$500mJan 1 - Jun 30Indian Mid-Market M&A up to US$500m by Rank Value Range# of Deals per Advisor Rank Value per Advisor (US$m)2013 2012 # of Change in Rank Value 2013 YoY RankLegal Advisors Rank Rank Deals # of DealsUS$mRank Val Chg (%)$7450AZB & Partners 1 1 28 -3 ▼ 791.4 4 7.0 ▲Amarchand Mangaldas 2 3 25 3 ▲ 1,422.1 1 291.2 ▲$6400Khaitan & Co 3 2 23 -2 ▼ 978.7 3 564.9 ▲350DLA Piper LLP 4 10* 12 9 ▲ 1,069.3 2 - -$5J Sagar Associates 5 4 8 -6 ▼ 16.4 27 -97.2 ▼300PH Bathiya & Associates 6 7 6 -1 ▼ 0.0 34* - -Davis Polk & Wardwell 7 - 4 4 ▲ 5.0 30 -97.7 ▼$4250Freshfields Bruckhaus Deringer 8* 31* 3 2 ▲ 0.0 34* - -Jones Day 8* 13* 3 1 ▲ 77.5 19 -89.0 ▼Linklaters 8* 13* 3 1 ▲ 100.0 14 - -$3200Trilegal 8* 6 3 -6 ▼ 3.0 31 -99.5 ▼150White & Case LLP 8* 31* 3 2 ▲ 481.7 5* - -$2Rajah & Tann LLP 13* 31* 2 1 ▲ 80.0 18 1059.4 ▲100Shearman & Sterling LLP 13* 13* 2 0 - 118.2 12 277.6 ▲$1Herbert Smith Freehills 13* 13* 2 0 - 122.0 11 - -50Blake Cassels & Graydon 13* - 2 2 ▲ 18.5 25* -40.9 ▼Allen & Overy 13* 13* 2 0 - 358.6 9 309.8 ▲ $0-Nagashima Ohno & Tsunematsu 18* - 1 1 ▲ 0.0 34* - -Heuking Kuehn Lueer Wojtek 18* - 1 1 ▲ 0.0 34*- -Houthoff Buruma 18* - 1 1 ▲0.0 34* - -Torys18* - 1 1 ▲45.5 20* 1066.7 ▲Udwadia Udeshi & Berjis 18* - 1 1 ▲1.233 -99.4 ▼US$200 - 500m US$100 - 200m US$50 - 100m US$0 - 50m # of DealsThompson Hine LLP 18* - 11 ▲0.034* - -Ashurst 18* -1 1 ▲0.0 34* - -Goodmans 18* 31* 1 0 -45.5 20* -54.5 ▼Burstall Winger LLP 18* - 1 1 ▲45.5 20* - -Cleary Gottlieb Steen & Hamilton 18* - 1 1 ▲258.6 10 - -Indian Mid-Market M&A up to US$500m by Target IndustryJan 1 - Jun 30 2013Orsay Paris & Lyon 18* -11 ▲98.1 15 227.0 ▲Anderson Mori & Tomotsune 18* 13* 1 -1 ▼10.4 28* - -Rajani & Associates 18* 31* 1 0 -10.4 28* - -Economic Laws Practice 18* - 1 1 ▲379.1 7* 3346.4 ▲3.1% 2.9% IndustrialsDe Brauw Blackstone Westbroek 18* - 11 ▲ 0.0 34* - -3.2%Mayer Brown LLP 18* 31* 1 0 -0.0 34* - -Materials23.4%NCTM 18* - 1 1 ▲0.0 34* - -4.3%FinancialsDacheng Law Offices 18* - 1 1 ▲20.0 24 - -Tatva Legal 18* 5 1 -10 ▼0.0 34* - -Energy and PowerAndrews Kurth LLP 18* - 1 1 ▲18.5 25* - -8.2%Holland & Hart 18* - 1 1 ▲32.5 23 - -Consumer Products and ServicesMilbank Tweed Hadley & McCloy 18* - 1 1 ▲481.7 5* - -Gibson Dunn & Crutcher 18* 10* 1 -2 ▼0.0 34* - -HealthcareHopgoodGanim 18* 10* 1 -2 ▼90.4 16* - -Gagrat & Company 18* - 1 1 ▲379.1 7* - -High TechnologyStibbe 18* - 1 1 ▲0.0 34* - -Desai & Diwanji 18* 8 1 -4 ▼1.9 32 - -9.8%Consumer StaplesCrawford Bayley & Co 18* 31* 1 0 -0.0 34* - -Edward Nathan Sonnenbergs Inc 18* - 1 1 ▲112.5 13 - -Real EstateKing & Spalding 18* - 1 1 ▲0.0 34* - -Simpson Thacher & Bartlett 18* 31* 1 0 -0.0 34*- -21.5%Media and EntertainmentSteinepreis Paganin 18* - 1 1 ▲90.4 16* - -Industry Total536-7 ▼6,821.2-18.5 ▼10.1%TelecommunicationsRetail* tie12.2%Rank Value (US$b)# of Dealshttps://www.thomsonone.com20
First Half 2013 │ Mid-Market M&A Up To US$500m │ Legal AdvisorsRanking Criteria SummaryIf you would like to participate in the submissionprocess, receive quarterly press releases, or havequestions about league table criteria pleasecontact:AmericasMichael RawlingsTel: +1 646 223 8364E-mail: michael.rawlings@thomsonreuters.comEurope, Middle East & AfricaRedina DodaTel: +44 (0) 207 542 3558E-mail: redina.doda@thomsonreuters.comAsia-PacificKelvin BianTel: +852 3761 1852E-mail: kelvin.bian@thomsonreuters.comJapanAkemi MamiyaTel: +813 6441 1158E-mail: akemi.mamiya@thomsonreuters.com- Announced league tables include all deals that were announced between January 1, 2013 and June 30, 2013 and of which <strong>Thomson</strong> <strong>Reuters</strong> was made aware. All current data and previous year'sdata is as of 12:00pm EDT on July 8, 2013.- League tables include rank eligible mergers, acquisitions, repurchases, spin-offs, self-tenders, minority stake purchases and debt restructurings.- A tender/merger transaction is considered to be effective at the time of consummation of the merger or the date on which it is declared wholly unconditional.--Deals with undisclosed dollar values are rank eligible but with no corresponding Rank Value. Non-US dollar denominated transactions are converted to the US dollar equivalent at the time ofannouncement of terms.Financial and legal advisors receive full credit for each deal on which they provide financial or legal advisory services, unless they represent minority sellers or advise on only a portion of thetransaction or <strong>Thomson</strong> <strong>Reuters</strong> has not been made aware of their participation in that transaction. For pending transactions, advisors to targets of multiple bids receive credit for the transactionagreed to or, in the absence of an agreement, the value of the highest offer.- Any Involvement league tables include deals where the target, acquiror, or either ultimate parent are domiciled (nation of headquarters) in the specified region or nation.-League tables, commentary, and charts citing announced activity are based on Rank Date and include intended, pending, partially complete, completed, pending regulatory, and unconditionaltransactions. Rank Date is defined as the earliest public announcement of when a value can be applied to a transaction.While <strong>Thomson</strong> <strong>Reuters</strong> has used reasonable endeavors to ensure that the information provided in this document is accurate and up to date as at the time of issue, neither <strong>Thomson</strong> <strong>Reuters</strong> nor itsthird party content providers shall be liable for any errors, inaccuracies or delays in the information, nor for any actions taken in reliance thereon, nor does it endorse any views or opinions of anythird party content provider. <strong>Thomson</strong> <strong>Reuters</strong> disclaims all warranties, express or implied, as to the accuracy or completeness of any of the content provided, or as to the fitness of the content forany purpose to the extent permitted by law. The content herein is not appropriate for the purposes of making a decision to carry out a transaction or trade and does not provide any form of advice(investment, tax, legal) amounting to investment advice, nor make any recommendations or solicitations regarding particular financial instruments, investments or products, including the buying orselling of securities. <strong>Thomson</strong> <strong>Reuters</strong> has not undertaken any liability or obligation relating to the purchase or sale of securities for or by any person in connection with this document.© 2013 <strong>Thomson</strong> <strong>Reuters</strong>. All rights reserved.<strong>Thomson</strong> <strong>Reuters</strong> and the <strong>Thomson</strong> <strong>Reuters</strong> logo are registered trademarks and trademarks of <strong>Thomson</strong> <strong>Reuters</strong> and its affiliated companies. Any third party name or markherein belongs to the relevant third party.https://www.thomsonone.com21
<strong>Thomson</strong> <strong>Reuters</strong> Solutions for the Deal Making CommunityFOR INVESTMENT BANKERS<strong>Thomson</strong>ONE.com Investment Banking is our flagship desktop solution that combinesreal-time <strong>market</strong> data and <strong>Reuters</strong> news with our world class reference data. It includesaccess to Recent Deals, Active Acquirers and M&A New Issues terms and conditions.SOLUTION FOR• Managing Client Relationships• Deal Origination• New Issues Pre-Marketing / RoadshowsFOR JUNIOR BANKERS<strong>Thomson</strong> <strong>Reuters</strong> Advanced Analytics for deal making improves efficiency at every step,from screening and targeting, to comparables analysis, building league tables, valuing acompany and developing a client pitch book. This set of analytical and presentation toolsenables you to undertake all these key tasks without having to leave Microsoft Office®.You can also access our key content sets easily to support your analysis.SOLUTION FOR• Financial Modeling• Customized League Tables• Simple Deals screening• Valuation analysis and comparable deal screening• Full integration into Microsoft Office® for on-brand pitch book creationFOR INFORMATION PROFESSIONALS, MARKET DATA, RESEARCHSDC Platinum is the world’s foremost financial transactions database, covering newissues, M&A, syndicated loans, private equity, project finance, poison pills, and more.SOLUTION FOR• Market Analysis & Trends (Geography, Sector, Asset Class, Deal Type, Deal Size,etc.)• Deal Origination (Debt Maturity Analysis, Company Lifecycle including PrivateEquity)• Pitch Creation (Firm Credentials, Representative Acquirors)• M&A Targeting (Active Strategic/Sponsor Acquirors, Target Company Screener)• Negotiation (T&C Benchmarking)FOR STRATEGY AND PLANNING TEAMS<strong>Thomson</strong> <strong>Reuters</strong> Deals Business Intelligence enables you to slice and dice ourrenowned Deals and Fees data to create ad hoc reports, analyze <strong>market</strong> trends,benchmark your performance and identify opportunities – all within a tool built into yourworkflow in Excel®, saving you valuable time and giving you a competitive edge.SOLUTION FOR• Conducting <strong>market</strong> analysis and identifying trends• Benchmarking your performance and monitoring competitors• Targeting clients by wallet size and banking relationship• Allocating resources more effectively by evaluating and analyzing lost dealsSend us a sales enquiry at: financial.thomsonreuters.com/salesRead more about our products at:financial.thomsonreuters.com/productsTo purchase individual <strong>Thomson</strong> <strong>Reuters</strong> Deals or League Tablereports,please contact our <strong>Thomson</strong> <strong>Reuters</strong> On Demand group:Web: http://financial.thomsonreuters.com/ondemandEmail: trondemand@thomsonreuters.comAccess unique analysis for free anytime using <strong>Thomson</strong> <strong>Reuters</strong>Deals Intelligence website and receive regular updates,delivered direct to your inbox.Go to online.thomsonreuters.com/dealsintelligenceMicrosoft, Office, Word, Excel and PowerPoint are either registered trademarks or trademarks of Microsoft Corporation in the United States and/or other countries. Copyright 2013 <strong>Thomson</strong> <strong>Reuters</strong>. All rights reserved.22