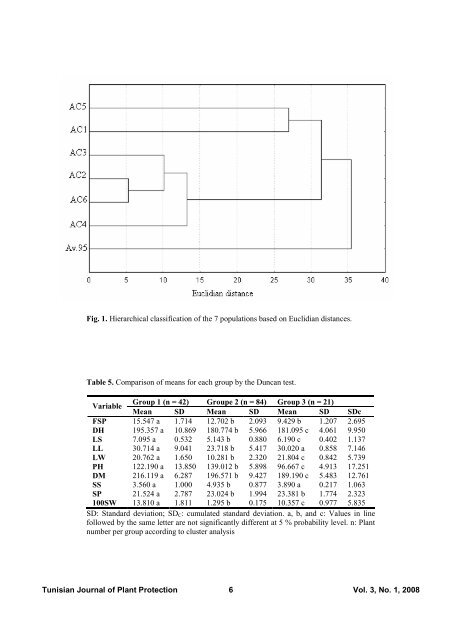
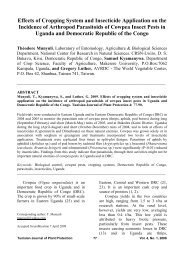
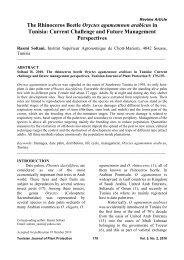
Fig. 1. Hierarchical classification <strong>of</strong> the 7 populations based on Euclidian distances.Table 5. Comparison <strong>of</strong> means for each group by the Duncan test.VariableFSPDHLSLLLWPHDMSSSP100SWGroup 1 (n = 42) Groupe 2 (n = 84) Group 3 (n = 21)Mean SD Mean SD Mean SD SDc15.547 a 1.714 12.702 b 2.093 9.429 b 1.207 2.695195.357 a 10.869 180.774 b 5.966 181.095 c 4.061 9.9507.095 a 0.532 5.143 b 0.880 6.190 c 0.402 1.13730.714 a 9.041 23.718 b 5.417 30.020 a 0.858 7.14620.762 a 1.650 10.281 b 2.320 21.804 c 0.842 5.739122.190 a 13.850 139.012 b 5.898 96.667 c 4.913 17.251216.119 a 6.287 196.571 b 9.427 189.190 c 5.483 12.7613.560 a 1.000 4.935 b 0.877 3.890 a 0.217 1.06321.524 a 2.787 23.024 b 1.994 23.381 b 1.774 2.32313.810 a 1.811 1.295 b 0.175 10.357 c 0.977 5.835SD: Standard deviation; SD C: cumulated standard deviation. a, b, and c: Values in linefollowed by the same letter are not significantly different at 5 % probability level. n: Plantnumber per group according to cluster analysis<strong>Tunisian</strong> Journal <strong>of</strong> Plant Protection 6Vol. 3, No. 1, 2008
DISCUSSIONSeveral agronomic traitsrecommended by the IBPGR (25) for oatswere observed on different spontaneousoats collected in Tunisia. Result showed asignificant diversity in all the traitsmeasured in this material. In a study onAvena fatua, Allard (2) found thatselection had occurred within the studiedpopulations due to variation in continuouscharacters such as plant height and number<strong>of</strong> days to heading (5). The variationrecorded within the variety Av.95 wasmarkedly high for the number <strong>of</strong> days toheading and for plant height; it was aboutthe double <strong>of</strong> the variation in thespontaneous populations. Moreover, allpopulations showed significant varianceheterogeneity which cannot be accountedonly for sampling variation (4, 5), butgenetic differences should be implicated aswell.The evaluation <strong>of</strong> heritability by themethod <strong>of</strong> Knapp et al., (13) is reported asapproximate providing initial indicatorsabout the parental lines to be used incrosses. Our results concerning theagronomic traits showed that 100-seedweight gave the highest heritabilitybetween-populations (0.9969). Theestimated heritabilities (H²) <strong>of</strong> the othertraits were not very variables rangingbetween 0.8214 and 0.9936. Stuthman andStucker (23) reported significant variationfor grain yield in highly inbred oat lines(11). In our study, plant height showed ahigh heritability whereas Zhu andKeappler (24) reported that the oat lineMAM17-5 had shown low heritability inUSA. It’s interesting to determinate theheritability <strong>of</strong> agricultural traits, indicatinghere that the most useful in breeding aretraits with high H².The cluster pattern showed that the 7populations were arranged in 3 groupsindependently <strong>of</strong> the geographic origin, butploidy level <strong>of</strong> these accessions wasimplicated. The diploid oats AC3, AC4,AC6, and AC2 are arranged in one groupwhereas the hexaploid spontaneous oatsAC1 and AC5 are classified in anothercluster closely grouped with the cultivatedoat Av.95. These results are in accordancewith those <strong>of</strong> Li et al. (16) working withother oat material. These authors foundthat three major branches were detectedamong 12 oat species; one branchincluded diploid species, another branchconsisted <strong>of</strong> only one diploid speciesAvena abyssinica; the major branchincluded hexaploid species closelygrouped. Due to the vast distribution area<strong>of</strong> wild oats in the world, extensive intraspecificdiversity occurs independentlywith the ploidy level (17). Since AC1,AC5 are hexaploid species havingappreciated agronomic traits; they can beeasily inter-crossed to improve fodderquality and crown rust resistance.Moreover, AC1 and AC5 were the bestpopulation due to the lowest value <strong>of</strong>AUDPC, UCm and US and the highestlatent period. These spontaneous oataccessions characterized by their goodagronomic traits and resistance to oatcrown rust can be a valuable materielpotentially useful in breeding programs.In selecting parental material,important characteristics such as diseaseresistance, quality <strong>of</strong> product, and crosscompatibilityshould be considered toachieve a well genetic gain (6, 3, 18).Comparative analysis <strong>of</strong> the whole specificdiversity <strong>of</strong> oat was incited by thepr<strong>of</strong>ound interest to use these forms inbreeding practice (8, 10, 14).Hexaploid oat species identified assources <strong>of</strong> the assessed traits may bedirectly included in the breeding processfor disease resistance, agronomic traits,and grain quality for feed and food.Numerous studies in this direction andpractical results <strong>of</strong> oat breeding haveevidenced that utilization <strong>of</strong> spontaneous<strong>Tunisian</strong> Journal <strong>of</strong> Plant Protection 7Vol. 3, No. 1, 2008