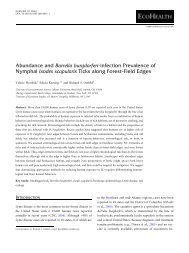
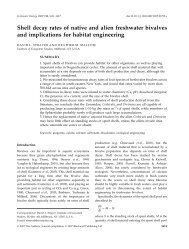
<strong>Van</strong> <strong>de</strong> <strong>Bogert</strong> et al.Benthic and pelagic metabolismFig. 6. Comparison of metabolism values based on 3 different methods.Estimates from the center of the lake are shown in squares, estimatesbased on volume-weighted averages of all sensor locations are shown incircles, and spatially explicit whole-lake mo<strong>de</strong>l estimates for the 12 dayswhen the mo<strong>de</strong>l was run are shown with triangles. Estimates based onsingle, central sensors are often much lower than estimates whichaccount for spatial variability in metabolism.When average 5-min wind speeds topped 2.75 m s –1 for morethan a total of 1 of the first 18 h of a day (nearly half of alldays studied in 2003), standard <strong>de</strong>viation in daily metabolismestimates among sites was 5 mmol O 2m –2 d –1 and of these, 9 displayed the hypothesizedpattern of highest metabolism near shore and lowest atthe center of the lake (Fig. 8).DiscussionMo<strong>de</strong>ls of dissolved oxygen at individual locations withina lake as well as simultaneous mo<strong>de</strong>ls of whole transectsrevealed that dynamics were not homogenous throughoutspace in our study lake. In<strong>de</strong>ed, severalfold differences inmetabolism estimates from site to site were common.Although these differences did not always follow predictableFig. 7. Estimates of whole-lake GPP and R (mmol O 2m –2 d –1 ) and thebenthic contribution of each based on the spatially explicit mo<strong>de</strong>l. Errorbars show 95% confi<strong>de</strong>nce intervals based on 10,000 bootstrap iterations.Data from 2002 (fertilized) are shown using squares and data from2003 (not fertilized) are shown using circles.patterns, on average an estimate based on a single, centrallocation un<strong>de</strong>restimated whole lake values.Epilimnetic water circulation may be one factor that <strong>de</strong>terminesthe <strong>de</strong>gree to which a single son<strong>de</strong> estimate of metabolisma<strong>de</strong>quately represents whole-lake metabolism. Water circulation(and the differential rates and patterns of that circulation throughtime) can mask the real heterogeneity in un<strong>de</strong>rlying ecosystemprocesses which occur at slower rates. When circulation occursquickly relative to the un<strong>de</strong>rlying biotic processes, measurementsof metabolism will be similar regardless of location, and a singlemeasurement location may provi<strong>de</strong> a reliable estimate of wholelakeepilimnetic metabolism. When circulation occurs muchmore slowly relative to the biotic processes, site-to-site variationshould occur in a predictable manner, with highest values nearshore and lowest values in the center of the lake.As a driver of water circulation, measurements of wind speedcan provi<strong>de</strong> one prediction of the <strong>de</strong>gree of homogenizationin metabolism estimates among sites. When wind speeds arehigh, metabolism estimates are quite similar between locations.Even short periods of high wind are enough to set cir-152
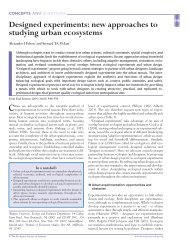
<strong>Van</strong> <strong>de</strong> <strong>Bogert</strong> et al.Benthic and pelagic metabolismFig. 8. Relationship between site-to-site variation in daily metabolismestimates (GPP and R combined) and the amount of time in the first 18 hof the day with 5-min average wind speeds greater than 2.75 m s –1 . Eachpoint corresponds to one 24-h transect from 2003. Filled-in points <strong>de</strong>notedays when metabolism was highest near shore and lowest in the centerof the lake and are the days when we were able to partition benthic andpelagic metabolism.culation patterns in motion that conceal the un<strong>de</strong>rlying heterogeneityin ecosystem processes. For Peter Lake, thereappeared to be a threshold of 1 h with 5-min average windspeeds above 2.75 m s –1 : above this threshold, metabolism estimateswere always similar among sites. This threshold is likelya function of the magnitu<strong>de</strong> of the differences in un<strong>de</strong>rlyingecosystem processes. Larger differences between benthic andpelagic metabolism rates could raise this <strong>de</strong>tection threshold.When wind speeds are low, other physical drivers (e.g., precipitation,convection currents) can provi<strong>de</strong> homogenizingforces and may need to be consi<strong>de</strong>red.Differences among lakes (e.g., size, morphometry, andtrophic state) may also affect the <strong>de</strong>gree to which a singleson<strong>de</strong> estimate of metabolism a<strong>de</strong>quately represents wholelakevalues (Fee 1979; Håkanson 2005). In large lakes withvery steep littoral zones (and thus small littoral area relativeto total lake area), pelagic metabolism may make up a largerproportion of the total. In this case, even if a son<strong>de</strong> measuresnone of the benthic metabolism, the measurement should becloser to whole-lake values than one in a smaller lake withlarge littoral zones. The effect of lake size, however, is likelymore complicated and in need of further study. It is reasonableto hypothesize, for example, that across a gradient of increasinglake size, central son<strong>de</strong>s will receive less and less signalfrom the littoral zone because the increased distance allowsthe littoral signal to be muted by atmospheric diffusion. Thebalance between this signal loss and its initial magnitu<strong>de</strong>would likely <strong>de</strong>termine how close a single estimate of metabolismin the center of lake approaches the true whole-lakevalue. In lakes smaller and shallower than Peter Lake, benthicmetabolism may make up a greater proportion of the total. Ifbenthic metabolism is not effectively measured by a centralson<strong>de</strong>, the measurement may be a more extreme un<strong>de</strong>restimateof the true whole-lake value. Alternatively, if the shorterdistance between the shore and center allows the benthic signalto reach the center of the lake without being muted byatmospheric diffusion, a single sensor may be able to accuratelymeasure whole system metabolism. In any given case,an investigator can use the approach presented here to examinespatial heterogeneity in metabolism and <strong>de</strong>sign a <strong>de</strong>ploymentstrategy suitable for capturing whole-lake metabolism.In Peter Lake a son<strong>de</strong> placed at a central location measuredpelagic metabolism and an unknown portion of benthic-littoralmetabolism. In the cases where we could apply the spatiallyexplicit mo<strong>de</strong>l, we found that a son<strong>de</strong> in the center of the lakemeasured only an average of 75% of the whole-lake epilimneticGPP and 73% of the whole-lake epilimnetic R. On these days,the central son<strong>de</strong> only measured approximately 25% of thebenthic GPP and R—the remaining portion was not <strong>de</strong>tectablewith a single sensor in the center of the lake. Because these dayshad the lowest rates of mixing as <strong>de</strong>termined by wind speed,this estimate may be a lower bound on the proportion of benthicmetabolism seen by the central son<strong>de</strong>.Ecologists often are more concerned with net ecosystemproduction than either GPP or R alone (<strong>Cole</strong> et al. 1994; 2000).The data presented here illustrate that NEP is also heterogeneouswith pelagic metabolism tending toward net autotrophyand benthic processes tending toward net heterotrophy.In this case, inference based on a single measurement maylead to erroneous conclusions about a lake’s trophic status.Similarly, Pace and Prairie (2005) report spatial variation inpCO 2within lakes and surmise that this variation is also dueto spatial heterogeneity in NEP.Although we were only able to apply the spatial mo<strong>de</strong>l on 12of 40 days, the remain<strong>de</strong>r of the <strong>de</strong>ployments were still usefulfor measuring site-specific and volume-weighted epilimneticmetabolism. Furthermore, collecting data using automatedsamplers is fairly easy. There is not much difference in the worknee<strong>de</strong>d to collect data for 3 days vs. 10 days because the additionalsampling costs only instrument time—not labor ormoney. What might be consi<strong>de</strong>red oversampling for answeringthe benthic-pelagic question is still useful for obtaining betterestimates of whole-lake metabolism. The benthic-littoral portioncan be inferred from days during the <strong>de</strong>ployment whenweather conditions (e.g., low wind speed) allow the use of thespatially explicit mo<strong>de</strong>l presented in this article.Comments and recommendationsThe results of this study suggest that ecologists interested inwhole-lake metabolism should recognize the potential for heterogeneityin within lake processes and acknowledge that singlesiteestimates may not represent whole-lake metabolism or153