Fact Book 2009-2010 - Kentucky State University
Fact Book 2009-2010 - Kentucky State University
Fact Book 2009-2010 - Kentucky State University

Create successful ePaper yourself
Turn your PDF publications into a flip-book with our unique Google optimized e-Paper software.
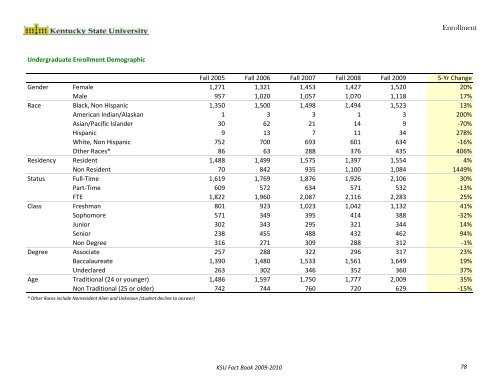
EnrollmentUndergraduate Enrollment DemographicFall 2005 Fall 2006 Fall 2007 Fall 2008 Fall <strong>2009</strong> 5‐Yr ChangeGender Female 1,271 1,321 1,453 1,427 1,520 20%Male 957 1,020 1,057 1,070 1,118 17%Race Black, Non Hispanic 1,350 1,500 1,498 1,494 1,523 13%American Indian/Alaskan 1 3 3 1 3 200%Asian/Pacific Islander 30 62 21 14 9 ‐70%Hispanic 9 13 7 11 34 278%White, Non Hispanic 752 700 693 601 634 ‐16%Other Races* 86 63 288 376 435 406%Residency Resident 1,488 1,499 1,575 1,397 1,554 4%Non Resident 70 842 935 1,100 1,084 1449%Status Full‐Time 1,619 1,769 1,876 1,926 2,106 30%Part‐Time 609 572 634 571 532 ‐13%FTE 1,822 1,960 2,087 2,116 2,283 25%Class Freshman 801 923 1,023 1,042 1,132 41%Sophomore 571 349 395 414 388 ‐32%Junior 302 343 295 321 344 14%Senior 238 455 488 432 462 94%Non Degree 316 271 309 288 312 ‐1%Degree Associate 257 288 322 296 317 23%Baccalaureate 1,390 1,480 1,533 1,561 1,649 19%Undeclared 263 302 346 352 360 37%Age Traditional (24 or younger) 1,486 1,597 1,750 1,777 2,009 35%Non Traditional (25 or older) 742 744 760 720 629 ‐15%* Other Races include Nonresident Alien and Unknown (student decline to answer)KSU <strong>Fact</strong> <strong>Book</strong> <strong>2009</strong>‐<strong>2010</strong> 78